
The business of replacing human heart valves is, by almost any metric, a fantastic way to generate cash. It is technically difficult, heavily regulated, and serves a demographic that is generally not interested in price shopping for life saving surgery. Edwards Lifesciences Corporation (EW) has spent decades perfecting this niche, particularly through its transcatheter aortic valve replacement (TAVR) technology.
On this Thursday, November 19, 2026, the broader market is having a bit of a crisis, with E-Mini S&P 500 Futures down 2.10% and the Nasdaq 100 Futures sliding 2.45%. In this environment, investors tend to rediscover their love for companies that actually have money in the bank. Edwards Lifesciences currently carries a net cash surplus of $3.94 billion, which is a polite way of saying they have more cash than they know what to do with while the 10-Year Treasury yield sits at 5.05%.
The Cost of Being Too Good
When a company becomes as dominant as Edwards Lifesciences, the primary risk often shifts from the laboratory to the courtroom. In July 2026, the Justice Department filed a proposed final judgment in the case of United States v. Edwards Lifesciences Corp. and Genesis MedTech Group Limited. This regulatory friction is the tax a company pays for attempting to consolidate a high-margin market.
The DOJ settlement highlights the structural ceiling for inorganic growth in the surgical appliance sector. While the company continues to win Department of Veterans Affairs contracts (such as the $0.37 million award for SAPIEN 3 RESILIA valves in June 2026), its ability to simply buy out smaller innovators is now under a microscope. This forces the company to rely on internal R&D, which is more expensive and takes longer, but fortunately, they have the margins to afford it.
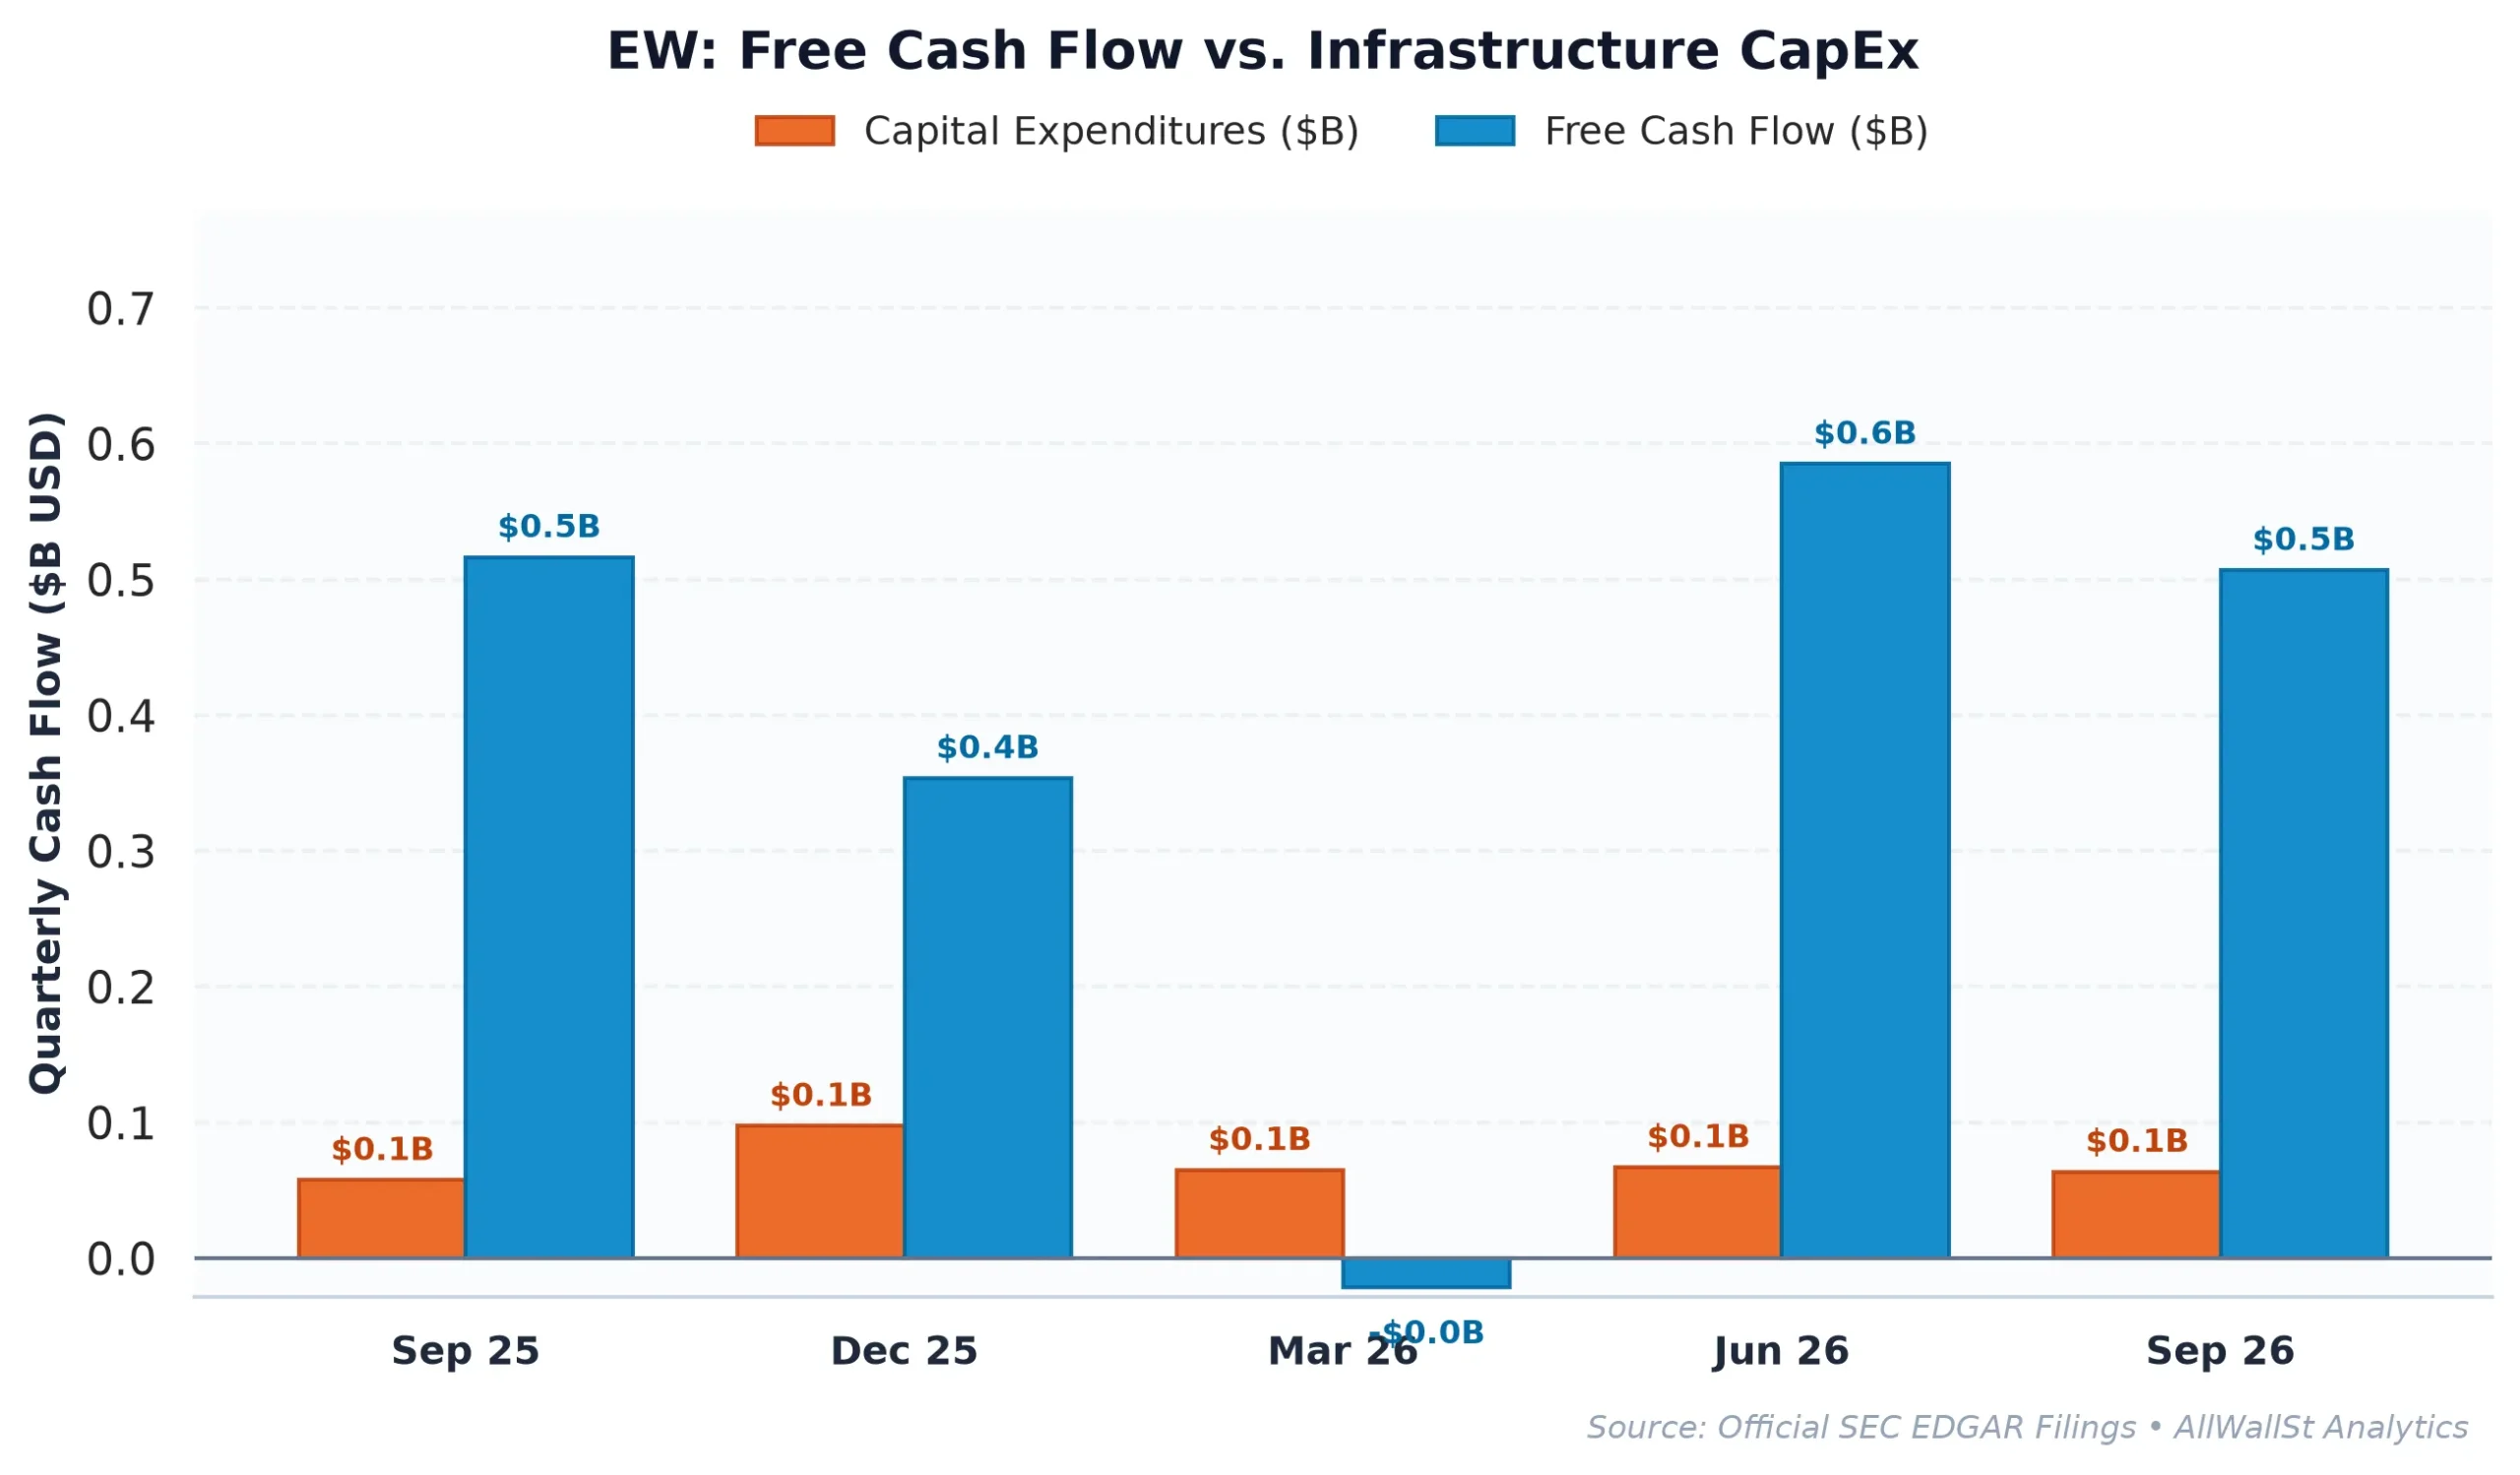
The Capital Efficiency Machine
The fundamental story here is one of high-octane return on invested capital (ROIC). Edwards Lifesciences generates an ROIC of 23.75%, which comfortably clears its estimated cost of capital. While revenue growth has moderated from the double-digit highs of previous years to a steady 10.50%, the operating efficiency remains elite.
| Period | Revenue | Operating Income | Operating Margin | Free Cash Flow | SBC Expense |
|---|---|---|---|---|---|
| FY2022 | $4.46B | $1.54B | 34.5% | $953.4M | $126.8M |
| FY2023 | $5.01B | $1.49B | 29.7% | $629.5M | $139.4M |
| FY2024 | $5.44B | $1.48B | 27.2% | $259.9M | $162.3M |
| FY2025 | $6.07B | $1.64B | 27.0% | $1.33B | $158.1M |
The transition from FY2024 to FY2025 saw a massive jump in Free Cash Flow to $1.33 billion, even as operating margins stabilized around 27%. It is worth noting that stock-based compensation (SBC) consumed about 9.2% of operating cash flow over the last twelve months. This is a manageable figure for a high-growth med-tech firm, but it does mean the “real” free cash flow yield is closer to 1.65% than the headline figure.
Peer Valuation and Market Positioning
Comparing Edwards Lifesciences to the broader healthcare landscape reveals a company that is priced for its quality rather than its size. At a $59.7 billion market cap, it is a fraction of the size of Eli Lilly or Johnson & Johnson, but it maintains a more focused operational profile.
| Company (Ticker) | Market Cap | Forward P/E | EV/EBITDA | Rev Growth (YoY) | Operating Margin | FCF Yield |
|---|---|---|---|---|---|---|
| Edwards Lifesciences (EW) | $59.7B | 30.7x | 27.1x | 10.50% | 28.82% | 1.92% |
| Eli Lilly (LLY) | $1.20T | 26.6x | 27.5x | 38.6% | 51.3% | 0.78% |
| UnitedHealth (UNH) | $296.1B | 14.2x | 12.7x | -0.4% | 5.9% | 8.95% |
| Johnson & Johnson (JNJ) | $643.1B | 23.0x | 19.8x | 5.9% | 26.6% | 2.88% |
The forward P/E of 30.7x might look expensive compared to Johnson & Johnson (23.0x), but Edwards is growing revenue nearly twice as fast. When you factor in the net cash position, the enterprise value multiples become even more attractive. The company is essentially a defensive fortress with a growth kicker.
Options Plumbing and Dealer Pinning
In the options market, the structure for Edwards Lifesciences is remarkably balanced. The Put/Call Open Interest ratio of 0.93 suggests that institutional hedging and retail speculation are in a state of rare equilibrium. However, the “Max Pain” strike sits at $90.00, which is about 13.36% below the current spot price of $103.88.
This distance to Max Pain typically suggests that if the broader market selloff continues, the stock could face mechanical gravity toward that $90 level as dealers hedge their gamma exposure. There is a formidable Call Wall at $110, which should act as a ceiling for any short-term rallies. For the long-term investor, these options-driven price swings are noise; for the trader, they suggest that the $103 level is a temporary perch in a volatile week.
The recent governance changes disclosed in the August 28, 2026, Form 8-K (Item 5.02) regarding executive compensatory arrangements suggest a board that is tightening its focus on performance-based retention. This is exactly what you want to see when a company is navigating both antitrust scrutiny and a high-rate macro environment.
Investment Committee Steelman Dissent
The primary bear case rests on the August 4, 2026, CMS rule changes for hospital inpatient prospective payment systems (IPPS), which could compress reimbursement rates for TAVR procedures and erode Edwards’ pricing power. Furthermore, if the DOJ’s aggressive stance on the Genesis MedTech deal signals a permanent ban on bolt-on acquisitions, the company’s growth could stall as internal R&D cycles take years to bear fruit.
AllWallSt Investment Verdict: BUY (Initiation)
Edwards Lifesciences Corporation (EW)
Sources & References
- Official SEC Form 10-K Annual Report (Filed 2026-02-25)
- Official SEC Form 10-Q Quarterly Report (Filed 2026-11-04)
- SEC Form 8-K Exhibit 99.x (2026-08-28)
- SEC DEF 14A Proxy / M&A Filing (2026-03-26)
- Federal Register (2026-08-04): Medicare Program; Hospital Inpatient Prospective Payment Systems for Acute Care…
- USASpending Federal Contract Award ($0.5M, Department of Veterans Affairs)
- ClinicalTrials.gov NCT07742839 (NOT_YET_RECRUITING)
- SEC EDGAR: Edwards Lifesciences Corp (CIK 0001099800)
- Edwards Lifesciences Investor Relations
- Federal Register: United States v. Edwards Lifesciences Corp. and Genesis MedTech Group Limited
Disclaimer: This report is for informational purposes only and does not constitute financial, legal, or investment advice. AllWallSt and its analysts maintain a fundamental research bias based on primary regulatory filings. Investing in medical device equities involves significant risks, including regulatory approval delays, clinical trial failures, and changes in government reimbursement policies.