
⚡ Executive Morning Takeaways
- Overnight Futures & Rates Impulse: Equity futures are bleeding into the Friday open, with Nasdaq 100 contracts (NQ=F) dropping 1.46% as the 10-Year Treasury yield holds a restrictive 5.05% level.
- Sector Rotation Leaders & Laggards: Capital is fleeing high-multiple Industrials and Tech, seeking shelter in Consumer Staples (XLP) and Utilities (XLU) as the VIX surges toward 30.
- Primary Corporate Catalyst: Deere & Company (DE) is underperforming the broader market as institutional desks digest a 6.70x Net Debt to EBITDA ratio and a valuation that looks rich compared to faster-growing peers like Caterpillar.
🌐 Pre-Market Macro, Futures & Rates Dashboard
| Asset / Benchmark | Ticker | Current Price / Level | Change (%) | 52-Week Low | 52-Week High |
|---|---|---|---|---|---|
| E-Mini S&P 500 Futures (ES=F) | ES=F | $7157.00 | -0.56% | $6353.25 | $7897.50 |
| E-Mini Nasdaq 100 Futures (NQ=F) | NQ=F | $26210.75 | -1.46% | $22961.50 | $31616.50 |
| S&P 500 (SPY) | SPY | $715.87 | -1.96% | $629.28 | $781.62 |
| Nasdaq 100 (QQQ) | QQQ | $645.04 | -2.19% | $555.60 | $762.86 |
| Russell 2000 (IWM) | IWM | $264.22 | -2.18% | $228.90 | $305.18 |
| 20+ Year Treasury (TLT) | TLT | $80.35 | +0.16% | $76.43 | $90.86 |
| High Yield Corporate (HYG) | HYG | $76.53 | -0.16% | $76.39 | $81.24 |
| Gold (GLD) | GLD | $335.18 | -1.76% | $335.05 | $509.70 |
| WTI Crude Oil (CL=F) | CL=F | $82.21/bbl | -0.28% | $54.98 | $119.48 |
| US Dollar Index Bullish (UUP) | UUP | $29.63 | +0.03% | $26.40 | $29.66 |
| CBOE Volatility Index (^VIX) | ^VIX | 29.25 | +2.85% | 13.38 | 35.30 |
| 2-Yr US Treasury Yield (2YY=F) | 2YY=F | 4.75% | +0.00% | 3.38% | 4.88% |
| 10-Yr US Treasury Yield (^TNX) | ^TNX | 5.05% | -0.28% | 3.96% | 5.36% |
The macro environment is currently a masterclass in equity duration pain. With the 10-Year Treasury yield (^TNX) stubbornly pegged at 5.05%, the equity risk premium for the S&P 500 has effectively vanished. When the risk-free rate is this high, investors stop paying for “potential” and start demanding immediate, cold cash flows.
The 2.85% jump in the VIX indicates that the market is finally waking up to the reality that higher-for-longer interest rates are not just a headline, but a mechanical drain on corporate valuations. Gold (GLD) and Crude Oil (CL=F) are both sliding, suggesting a broad liquidation event as traders move to the sidelines ahead of the weekend.
📊 Sector Rotation Leaders & Laggards
| Rotation Rank | Sector ETF | Ticker | Price | Change (%) | Trailing P/E | Dividend Yield | 52-Week Low | 52-Week High |
|---|---|---|---|---|---|---|---|---|
| Leader (#1) | Energy (XLE) | XLE | $60.89 | -0.65% | 15.2x | 2.18% | $43.77 | $70.15 |
| Leader (#2) | Utilities (XLU) | XLU | $43.01 | -1.24% | 17.7x | 2.79% | $39.03 | $47.80 |
| Leader (#3) | Consumer Staples (XLP) | XLP | $89.86 | -1.45% | 24.2x | 2.46% | $76.51 | $93.48 |
| Spotlight Sector | Industrials (XLI) | XLI | $161.36 | -2.00% | 25.9x | 1.13% | $147.14 | $188.19 |
| Laggard (#8) | Materials (XLB) | XLB | $49.42 | -2.06% | 20.6x | 1.64% | $42.22 | $54.63 |
| Laggard (#9) | Communication Services (XLC) | XLC | $102.76 | -2.67% | 16.3x | 1.38% | $99.33 | $120.41 |
| Laggard (#10) | Consumer Discretionary (XLY) | XLY | $115.88 | -2.79% | 24.3x | 0.81% | $105.19 | $125.01 |
The rotation table shows a classic “risk-off” posture. The relative outperformance of Energy (XLE) and Utilities (XLU) is not about growth: it is about dividends and low valuation multiples. When Industrials (XLI) trade at a 25.9x trailing P/E while earnings growth is slowing, the sector becomes a prime target for institutional trimming.
Consumer Discretionary (XLY) is the morning’s biggest casualty, dropping 2.79%. This reflects growing concern that the American consumer, burdened by high credit card rates and depleting savings, is finally hitting a wall. Capital is rotating into “defensive” areas where demand is inelastic, leaving high-multiple industrial names like Deere & Company exposed.
⏱️ Today’s Earnings & Economic Radar
Imminent Corporate Earnings Releases
| Company / Ticker | Timing | Consensus EPS | Consensus Revenue | Key Strategic Theme |
|---|---|---|---|---|
| Target (TGT) | Nov 18 (Reported) | $2.68 | $32.07B | Discretionary Apparel/Home Basket Size & Inventory Shrink |
| HPE (HPE) | Nov 23 (Scheduled) | $1.28 | $14.43B | Operating Margins & Capital Return |
| Deere & Co (DE) | Nov 25 (Scheduled) | $4.01 | $10.34B | Large Ag Machinery Replacement Cycle & Dealer Inventory De-Stocking |
High-Impact Economic Data & Central Bank Actions
| Time (ET) | Event | Impact | Key Institutional Focus |
|---|---|---|---|
| 09:30 AM | Monthly Options Expiration (OPEX) & Dealer Gamma Unwind | CRITICAL | S&P 500 & Mega-Cap Call/Put Wall Unpinning |
| 10:00 AM | Leading Economic Indicators & Existing Home Sales | HIGH | Housing Turnover & Credit Transmission |
| 01:00 PM | Baker Hughes North American Rig Count | MEDIUM | Upstream Oilfield Services Activity |
The 9:30 AM open is particularly dangerous today due to monthly options expiration (OPEX). As dealer gamma unpins, we could see violent moves in either direction as market makers adjust their hedges. For Deere & Company, the 1.27 Put/Call ratio suggests that the “market plumbing” is heavily skewed toward protecting against a breakdown.
🎯 Pre-Market Spotlight: Deere & Company (DE)
Deere & Company (DE) is often described as a proxy for the American heartland, but its current balance sheet looks more like a levered financial institution. The company is carrying $64.58B in total debt, resulting in a Net Debt to EBITDA ratio of 6.70x. In a world of 5.05% risk-free rates, that level of leverage is no longer a strategic advantage (it is a structural liability).
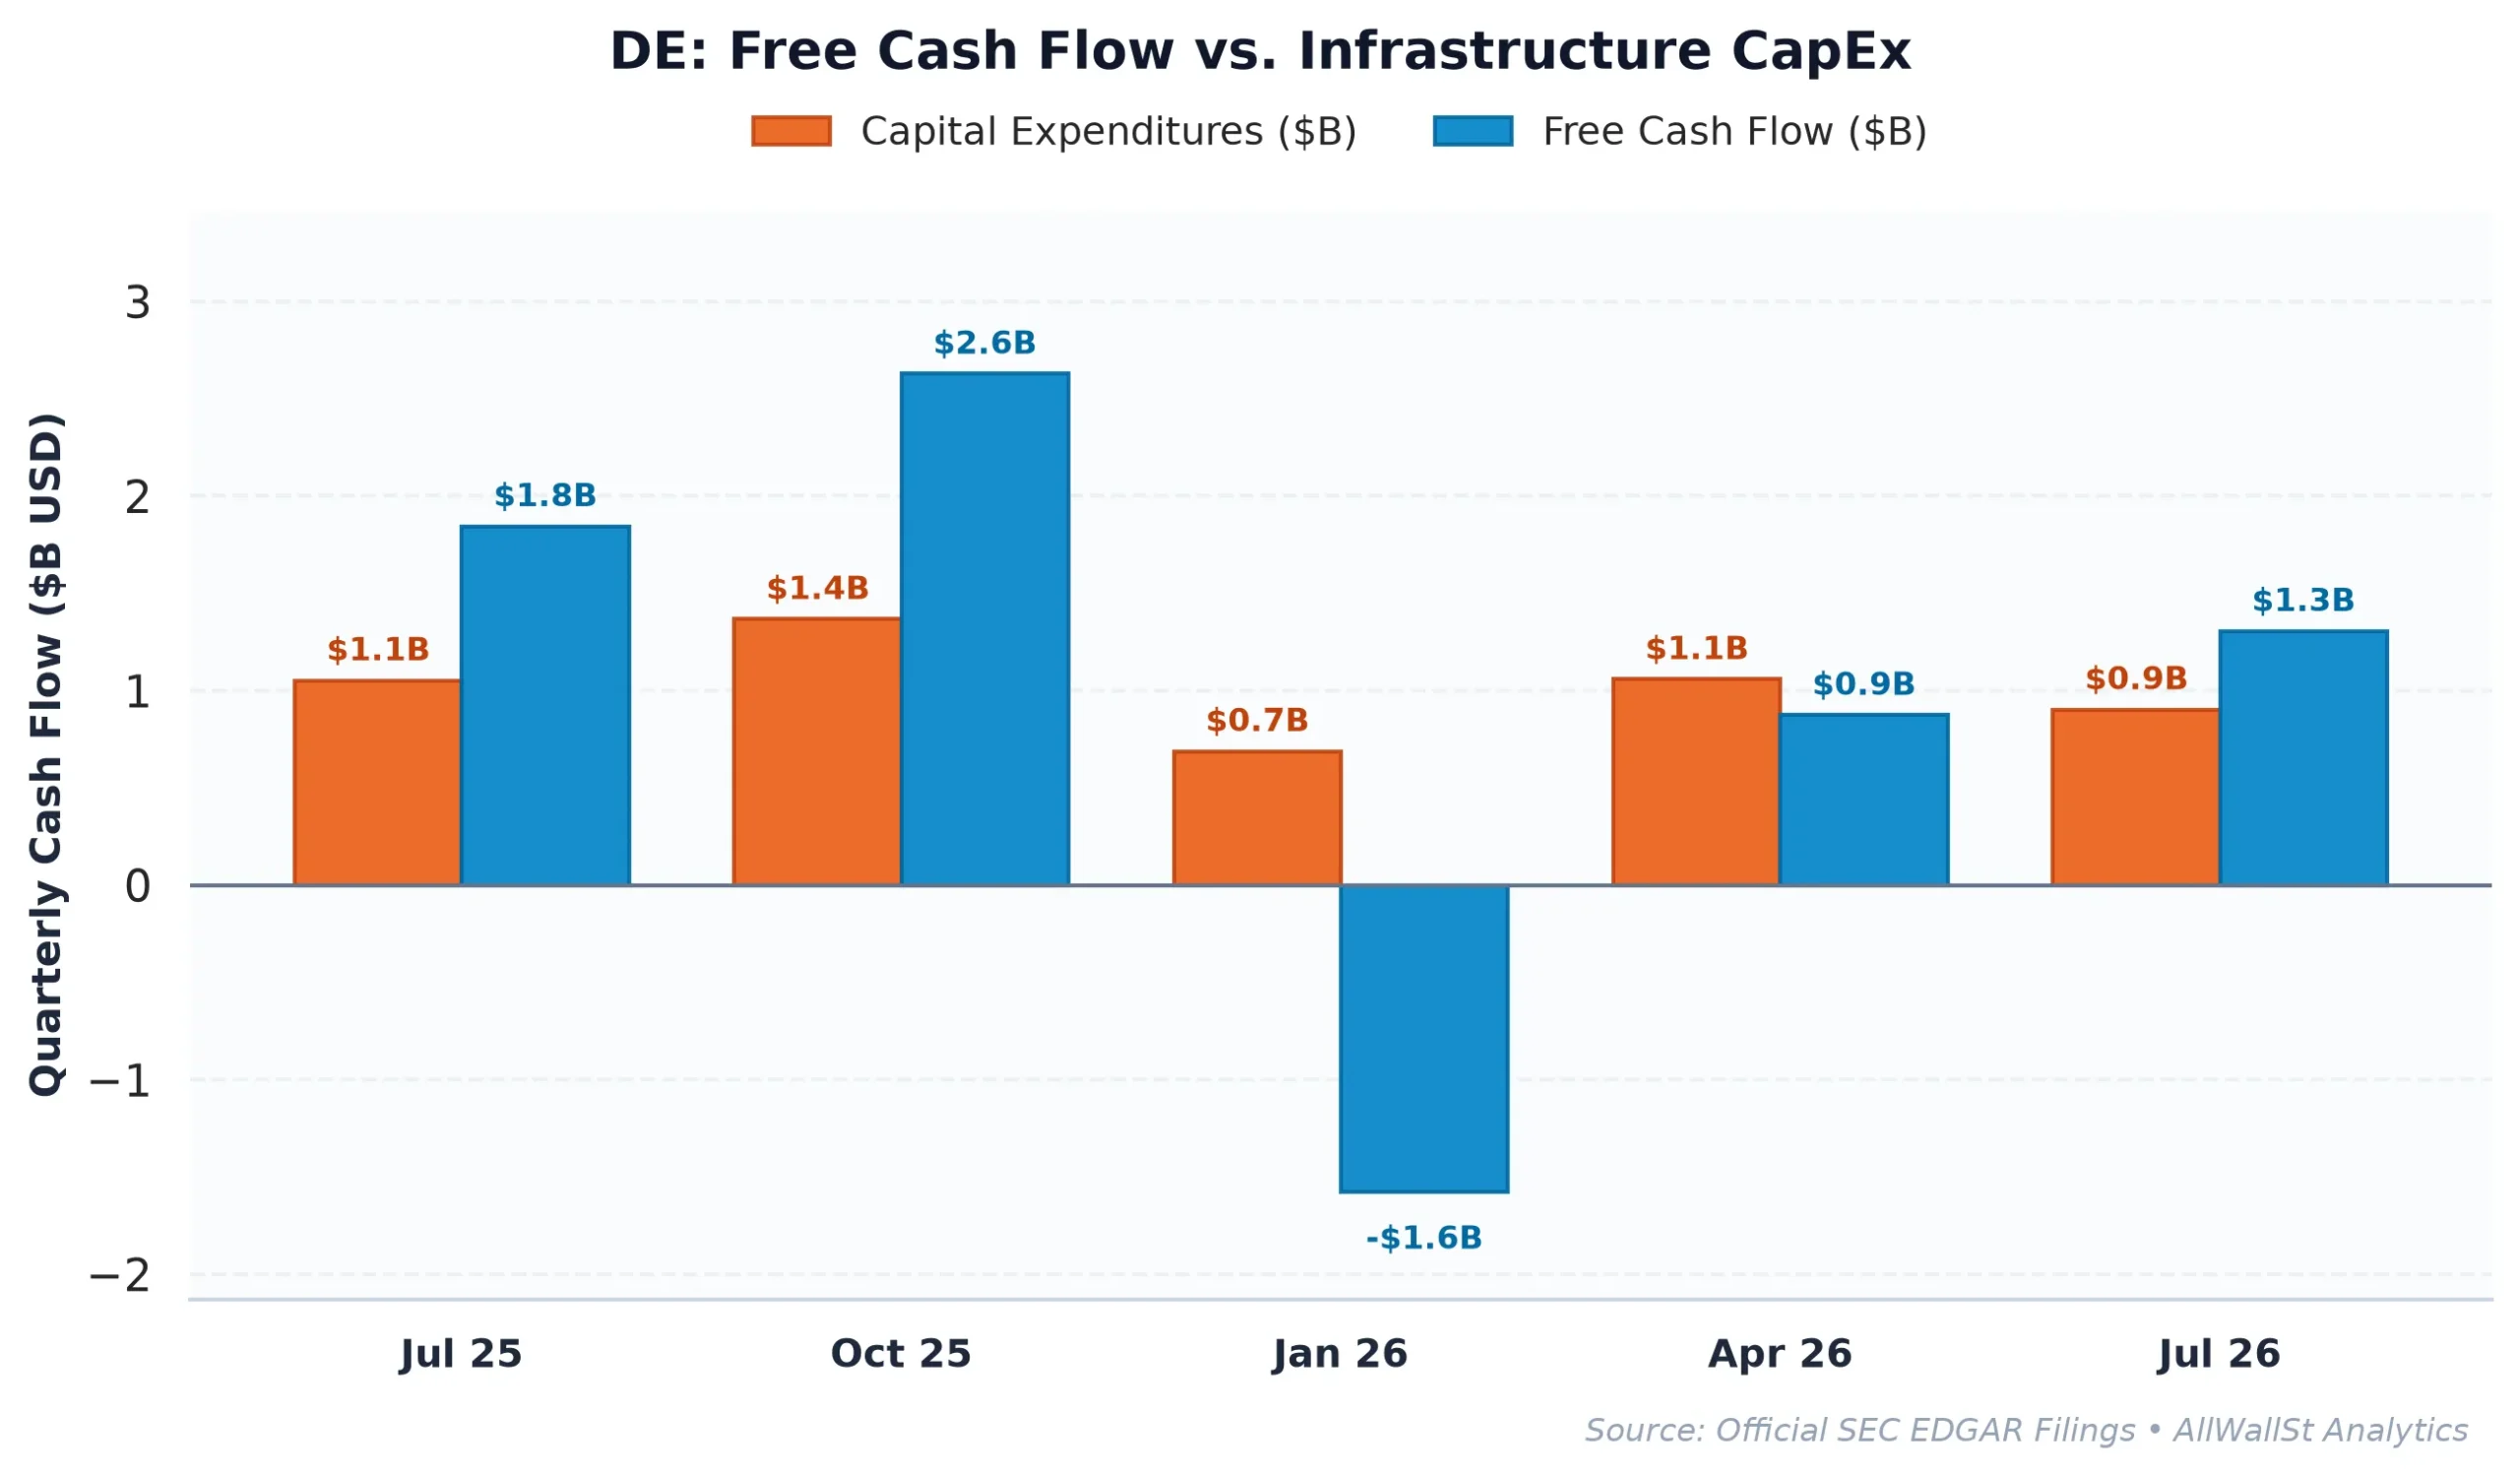
The fundamental disconnect is glaring when you look at the Return on Invested Capital (ROIC). Deere’s ROIC sits at 6.12%, which is significantly below its estimated 8.5% cost of capital. Effectively, the company is destroying shareholder value with every new dollar it invests. When you compare this to Caterpillar (CAT), which boasts an 18.8% operating margin and a more reasonable 16.7x forward P/E, Deere’s 27.3x multiple looks entirely disconnected from reality.
Deere’s recent acquisition of Orchard AI on November 20, 2026, highlights a desperate pivot toward “precision farming” to justify its high-tech multiple. While plant-level crop intelligence is a compelling narrative, it does little to solve the immediate problem of a 2.68% Free Cash Flow yield. When you can get 5.05% from a Treasury bill without the risk of a tractor factory strike or a corn price collapse, the “green tractor premium” becomes impossible to defend.
The options market is already positioning for a retreat. With a Put/Call ratio of 1.27 and a Max Pain strike of $420, the structural gravity is pulling significantly lower. Dealers are currently holding a defensive skew, and any failure to hold the current price level could trigger a mechanical sell-off as put protection is monetized. Even the appointment of former EY CEO Julie Boland to the board (announced in an 8-K on November 2) suggests a board that is increasingly focused on tightening financial controls rather than aggressive expansion.
Investment Committee Steelman Dissent: The bull case rests on the “software-ification” of agriculture, where Orchard AI and precision tech turn Deere into a high-margin recurring revenue engine that farmers cannot afford to skip. If the replacement cycle for large ag machinery accelerates due to these productivity gains, Deere could outgrow its debt pile and force a massive short-covering rally toward its call walls.
AllWallSt Investment Verdict: SELL (Quantitative Downgrade)
Deere & Company (DE)
Sources & References
- Official SEC Form 10-K Annual Report (Filed 2025-12-18)
- Official SEC Form 10-Q Quarterly Report (Filed 2026-08-27)
- SEC Form 8-K Exhibit 99.x (2026-11-02)
- SEC Form 8-K Primary Filing Body (2026-06-01)
- SEC SC 13D/A Beneficial Ownership Disclosure (2022-07-22)
- SEC DEF 14A Proxy / M&A Filing (2026-01-14)
- USASpending Federal Contract Award ($1.9M, Department of Defense)
- Federal Docket: Deere & Company v. Sutton (2026-11-13)
- SEC EDGAR Filings (Deere & Co): https://www.sec.gov/edgar/browse/?CIK=0000315189
- Investor Relations: https://www.deere.com
- Federal Contract Awards: https://www.usaspending.gov
Disclaimer: This report is for informational purposes only and does not constitute investment advice. AllWallSt is not a registered investment advisor. High-yield and industrial equities involve significant risk, including capital loss. Quantitative metrics and options flow data are subject to rapid market shifts.