
The business of selling chocolate is, in its purest form, an administrative exercise in brand loyalty. You do not buy a Reese’s Cup because you have conducted a rigorous cost-benefit analysis of cocoa solids versus peanut butter density. You buy it because the orange packaging has occupied a specific, high-rent district of your brain since childhood. For The Hershey Company (HSY), this psychological real estate translates into a Return on Invested Capital (ROIC) of 21.86%, a figure that suggests for every dollar the company puts into the ground, it extracts nearly twenty-two cents of pure economic profit.
This is a remarkably defensive engine, yet the market has treated it with a degree of skepticism usually reserved for companies facing existential technological obsolescence. While the broader indices chase hyperscaler dreams, The Hershey Company has spent the last few months quietly shuffling its leadership and defending its shelf space. We are looking at a business that generates a 4.78% Free Cash Flow yield in a world where the risk-free 10-Year Treasury offers 5.05%. Usually, a negative spread to Treasuries is a warning sign, but when that spread comes from a company with a 38.00% Return on Equity, you are paying for the durability of the tollbooth, not just the coins in the tray.
The CFO Transition and the Steady Hand on the Ledger
In September 2026, The Hershey Company filed an 8-K announcing that Dave Hulays would succeed Steve Voskuil as Chief Financial Officer. In the world of corporate governance, CFO transitions are often the moments when activists start checking the locks on the boardroom doors. However, this appears to be a textbook example of institutional continuity. Voskuil is staying on as Senior Vice President of Strategic Projects through early 2027, a move that provides a long runway for Hulays to manage the company’s $4.75 billion in net debt.
The financial mandate for the new regime is clear: defend the margins. The Hershey Company currently operates with a gross margin of 41.95%, which is the primary shock absorber against volatile cocoa prices. When your operating margin sits at 21.20%, you have the luxury of making mistakes that would bankrupt a lesser grocer. The company’s recent focus on “Reese’s Innovation” and the return of seasonal favorites like the Reese’s Pie are not just marketing gimmicks. They are attempts to drive unit volume in a category where pricing power is starting to meet the ceiling of consumer elasticity.
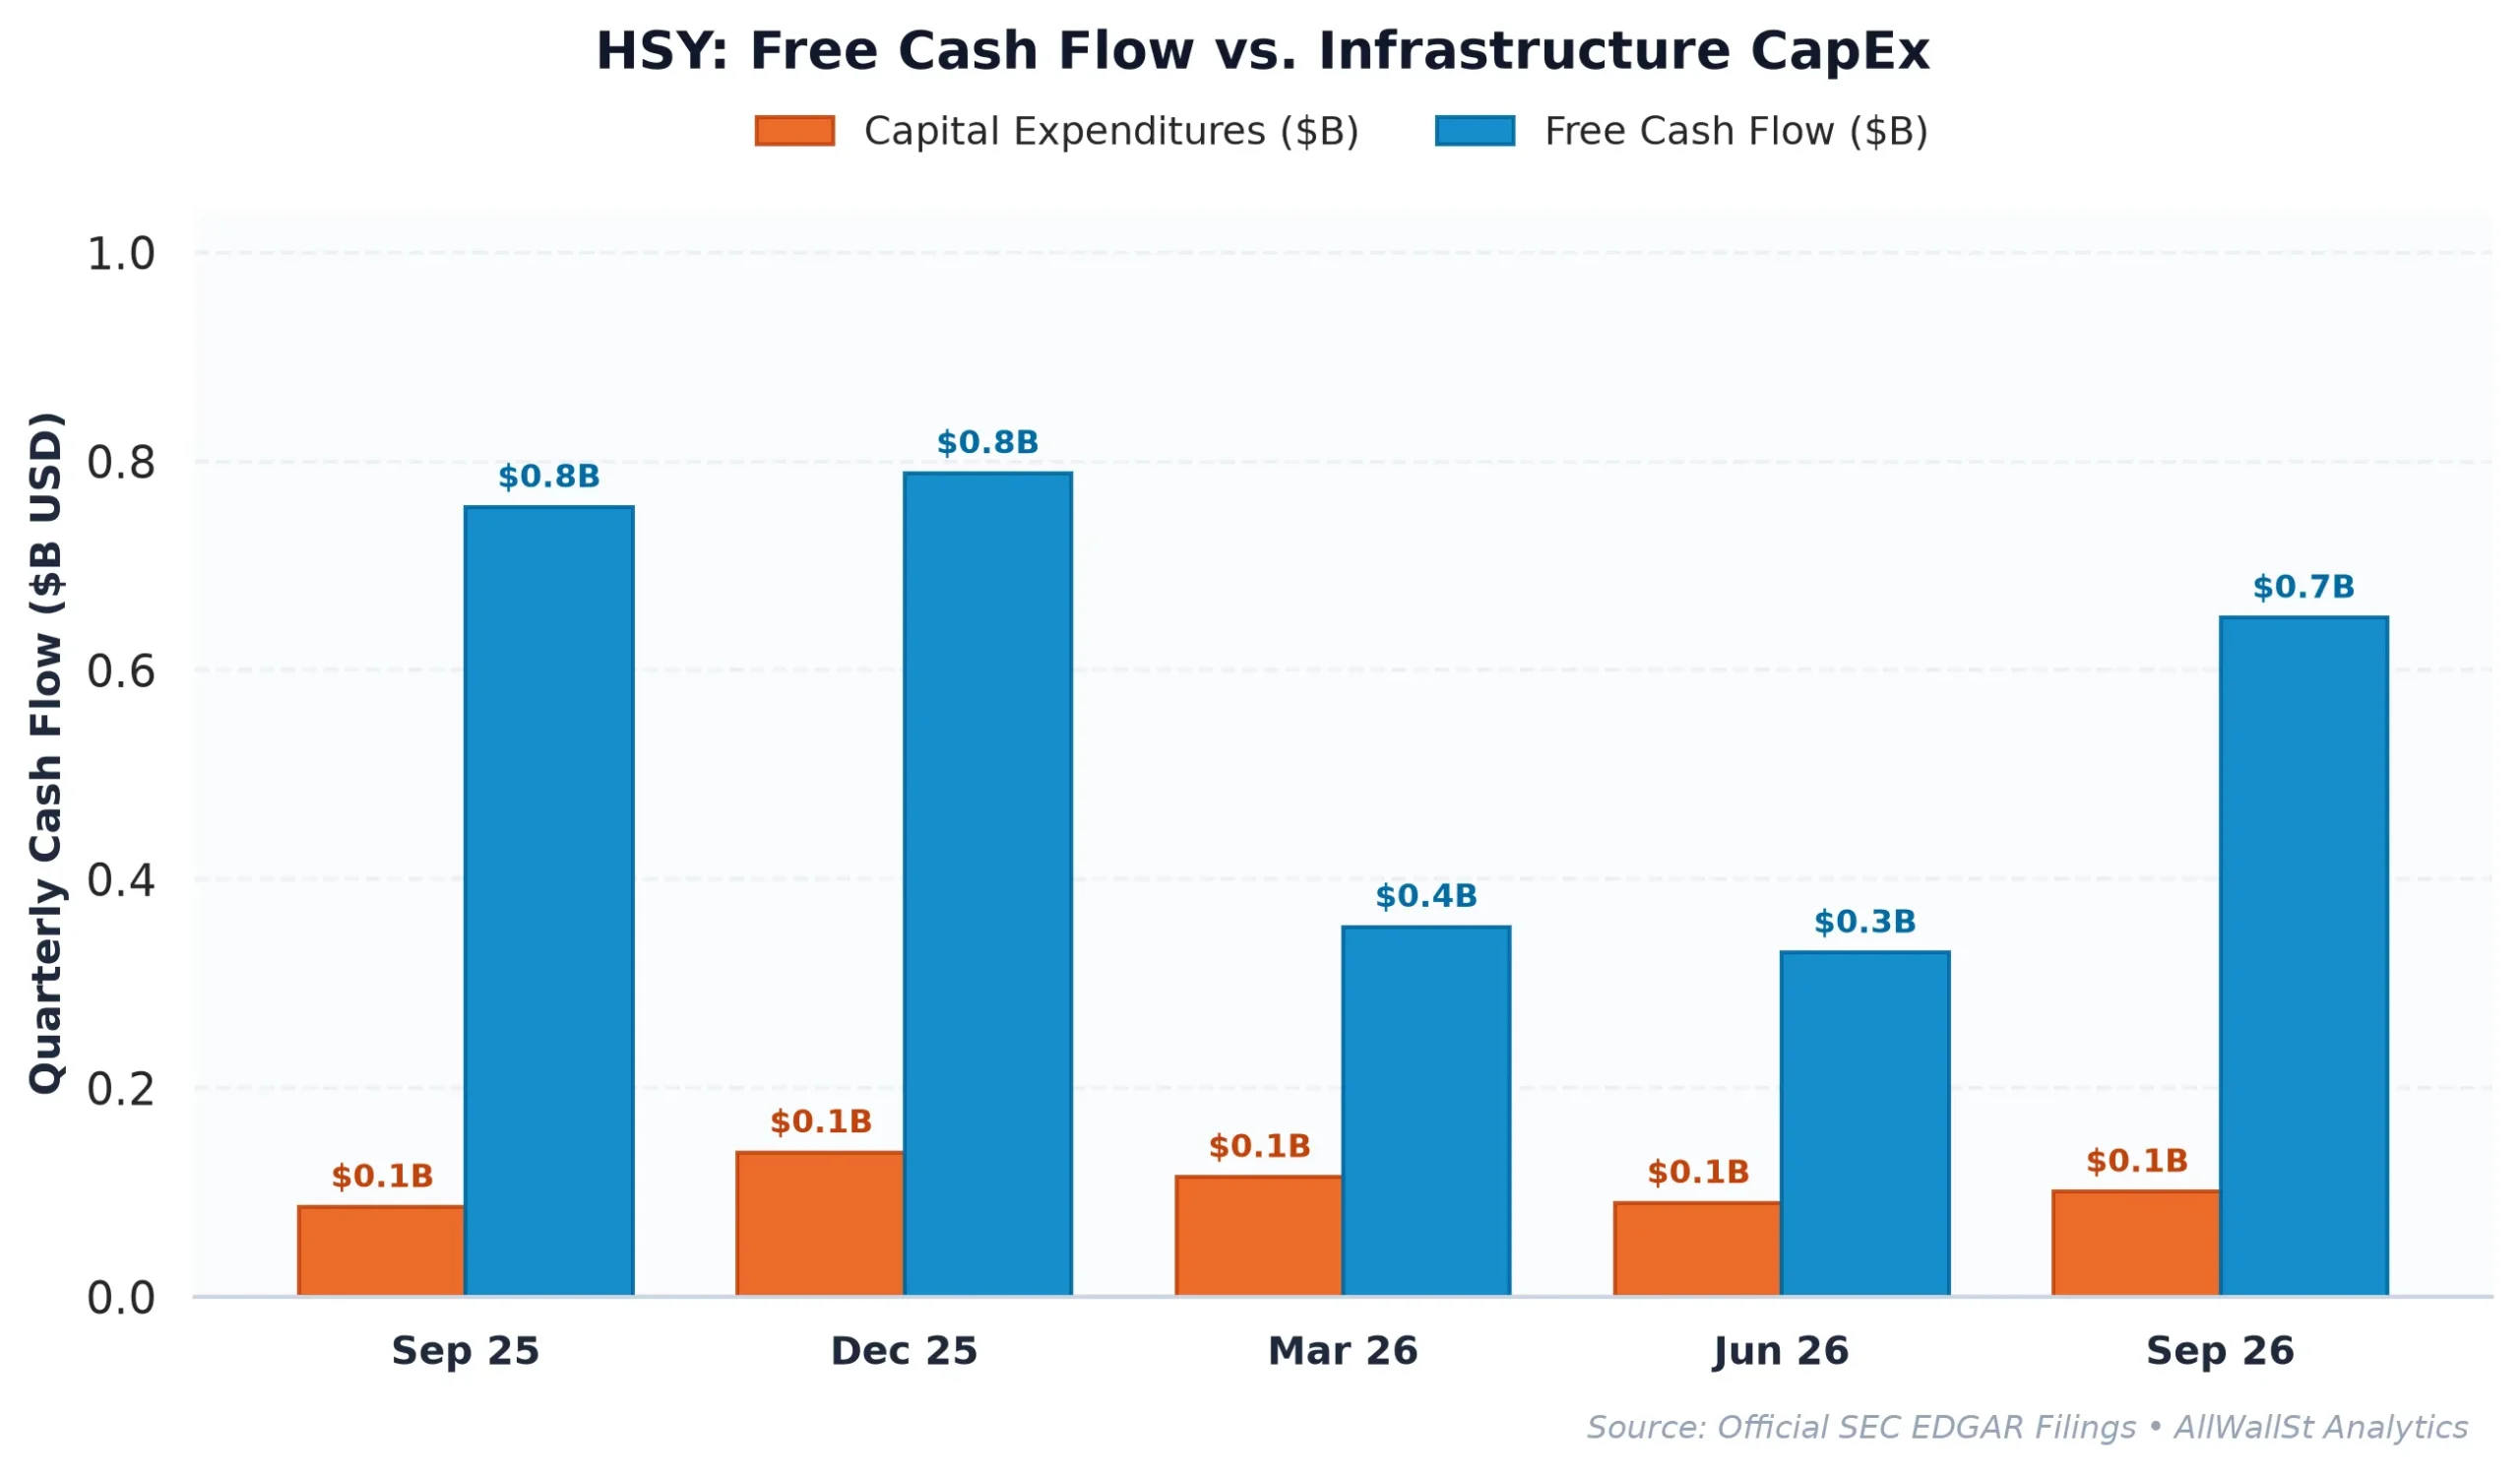
From a capital allocation perspective, the company is remarkably disciplined. It spends only 3.61% of its revenue on CapEx, meaning the vast majority of its operating cash flow is available for shareholders. While share buybacks have been quiet recently, the 3.34% dividend yield provides a solid floor for total return. In an environment where the “Rule of 40” score (a metric combining growth and profit) sits at a modest 16.6%, the story here is not about explosive expansion. It is about the relentless, compounding efficiency of a dominant market position.
The Valuation Gap and the Retail Premium
When you place The Hershey Company alongside the titans of retail, the valuation disconnect becomes a narrative of its own. The market is currently paying massive premiums for the platforms that sell the chocolate, while discounting the company that actually makes it. This creates a structural opportunity for investors who prefer high-margin production over low-margin distribution.
| Company (Ticker) | Market Cap | Forward P/E | EV/EBITDA | Rev Growth (YoY) | Operating Margin | FCF Yield |
|---|---|---|---|---|---|---|
| The Hershey Company (HSY) | $35.0B | 18.4x | 12.7x | 3.00% | 21.20% | 4.78% |
| Walmart (WMT) | $1.00T | 39.0x | 24.5x | 5.9% | 3.9% | 0.71% |
| Costco Wholesale (COST) | $484.7B | 43.7x | 33.4x | 11.1% | 3.8% | 1.39% |
| Amazon.com (AMZN) | $2.78T | 23.6x | 16.2x | 12.1% | 13.1% | -1.25% |
The Hershey Company trades at a forward P/E of 18.4x, which looks almost bored compared to Walmart’s 39.0x. While Walmart and Costco are arguably better “growth” stories due to their membership models and scale, they operate on razor-thin operating margins of roughly 4%. The Hershey Company, by contrast, keeps more than five times as much profit from every dollar of sales. We are seeing a market that rewards retail volume but ignores the superior unit economics of the underlying brands. If the consumer environment softens, the company with the 21% margin has significantly more room to maneuver than the retailer with the 4% margin.
The Gamma Pin and the Path to $180
The options market currently reflects a state of high-conviction equilibrium. The Max Pain strike, which is the price point where the largest number of options contracts expire worthless, sits at $175.00. With the stock trading at $174.05, the market is effectively pinned. Dealers are currently in a “Neutral Gamma” state, meaning they do not have to aggressively buy or sell shares to hedge their positions, which usually results in lower volatility and sideways price action.
However, a look at the “walls” tells a more interesting story. There is a significant Call Wall at $180, representing roughly 1,493 contracts. This acts as a ceiling because as the stock approaches $180, option sellers must sell shares to remain neutral, creating natural resistance. On the downside, the Put Wall at $165 serves as a structural floor. If the stock were to drop toward $165, dealers would be forced to buy shares to hedge their puts, providing a mechanical bid.
The expected 30-day move is approximately 8.6% in either direction. Given the fundamental support of the 4.78% FCF yield and the lack of index-driven “gravity” (since HSY is a small weight in the S&P 500), the risk-reward is skewed to the upside. The Hershey Company is a classic “boring” winner: it has high barriers to entry, massive margins, and a valuation that has finally become attractive relative to its retail peers.
Investment Committee Steelman Dissent: The primary risk to this thesis is the continued elevation of the 10-Year Treasury yield above 5.00%, which may force a further “yield-based” de-rating of defensive staples regardless of their individual quality. Additionally, if cocoa input costs undergo a secondary parabolic spike, the company’s ability to defend its 21% operating margin through pricing alone may finally reach a breaking point with the price-sensitive consumer.
AllWallSt Investment Verdict: BUY (Initiation)
The Hershey Company (HSY)
Sources & References
- Official SEC Form 10-K Annual Report (Filed 2026-02-17)
- SEC EDGAR: HERSHEY CO Complete Filing History
- SEC Form 8-K Exhibit 99.1 (Press Release / Earnings) (2026-09-02)
- SEC Form 8-K Primary Filing Body (2026-06-09)
- SEC DEF 14A Proxy / M&A Filing (2026-03-25)
- The Hershey Company Investor Relations: https://www.thehersheycompany.com/en_us/investors.html
- SEC EDGAR Filing (Form 10-Q): https://www.sec.gov/Archives/edgar/data/47111/000162828026068136/hsy-20260927.htm
- SEC EDGAR Filing (Form 8-K): https://www.sec.gov/Archives/edgar/data/47111/000162828026060131/hsy-20260902.htm
- Federal Court Docket (Mozer v. HSY): https://www.courtlistener.com/docket/74750951/mozer-v-the-hershey-company/
Disclaimer: This report is for informational purposes only and does not constitute financial, legal, or investment advice. The AllWallSt Editorial and Quantitative desks utilize primary regulatory filings and market data to form independent opinions. Past performance is not indicative of future results.