
Borrowing Cash While Wall Street Misses the Turn
On November 18, 2026, C.H. Robinson Worldwide, Inc. (CHRW) filed an SEC Form 8-K disclosing a new Delayed Draw Term Loan Credit Agreement arranged by U.S. Bank National Association. In corporate finance, a delayed draw term loan is a pre-arranged borrowing facility that allows a company to pull down cash in tranches when needed rather than taking on immediate interest expense across the entire principal amount.
Mainstream financial coverage immediately fixated on the potential drag of ticking fees and elevated borrowing costs in a high rate environment where the 10-Year Treasury yield trades near 4.94%. The prevailing sell-side narrative argues that freight brokers face ongoing spot rate pressure, making fresh credit facilities a sign of balance sheet defensive positioning.
That narrative misinterprets asset-light freight logistics. C.H. Robinson does not own fleets of semi-trucks or maintain capital-heavy rail yards. It operates a digital matching engine that connects shippers with motor carriers, taking a margin spread on every transaction. Securing flexible bank financing provides capital optionality to fund strategic growth and capture synergy targets, including ongoing integration savings from recent logistics transactions like the RXO deal framework.
Operational Discipline Meets Capital Returns
A multi-year review of C.H. Robinson’s underlying financial trajectory reveals a clear pattern of margin recovery despite macroeconomic volatility. When post-pandemic freight demand normalized, revenue fell from $24.70B in FY2022 to $16.23B in FY2025.
However, management focused relentlessly on internal productivity, routing algorithms, and automated load matching. Operating margins bottomed at 2.9% in FY2023 before expanding to 4.9% in FY2025 and reaching 5.27% over the trailing twelve months.
+-------------------------------------------------------------------+
|               C.H. ROBINSON OPERATIONAL SUMMARY                   |
+------------------------------------+------------------------------+
| Metric                             | Value                        |
+------------------------------------+------------------------------+
| Trailing 12-Month Revenue          | $18.22 Billion               |
| YoY Revenue Growth                 | +29.50%                      |
| Return on Invested Capital (ROIC)  | 19.95%                       |
| Estimated WACC Hurdle Rate         | ~8.50%                       |
| Net Debt / EBITDA                  | 1.95x                        |
| CapEx Intensity (CapEx / Revenue)  | 0.37%                        |
+------------------------------------+------------------------------+
The true strength of the business lies in its capital efficiency. C.H. Robinson delivers a Return on Invested Capital (ROIC) of 19.95%, significantly outpacing its estimated 8.5% weighted average cost of capital hurdle.
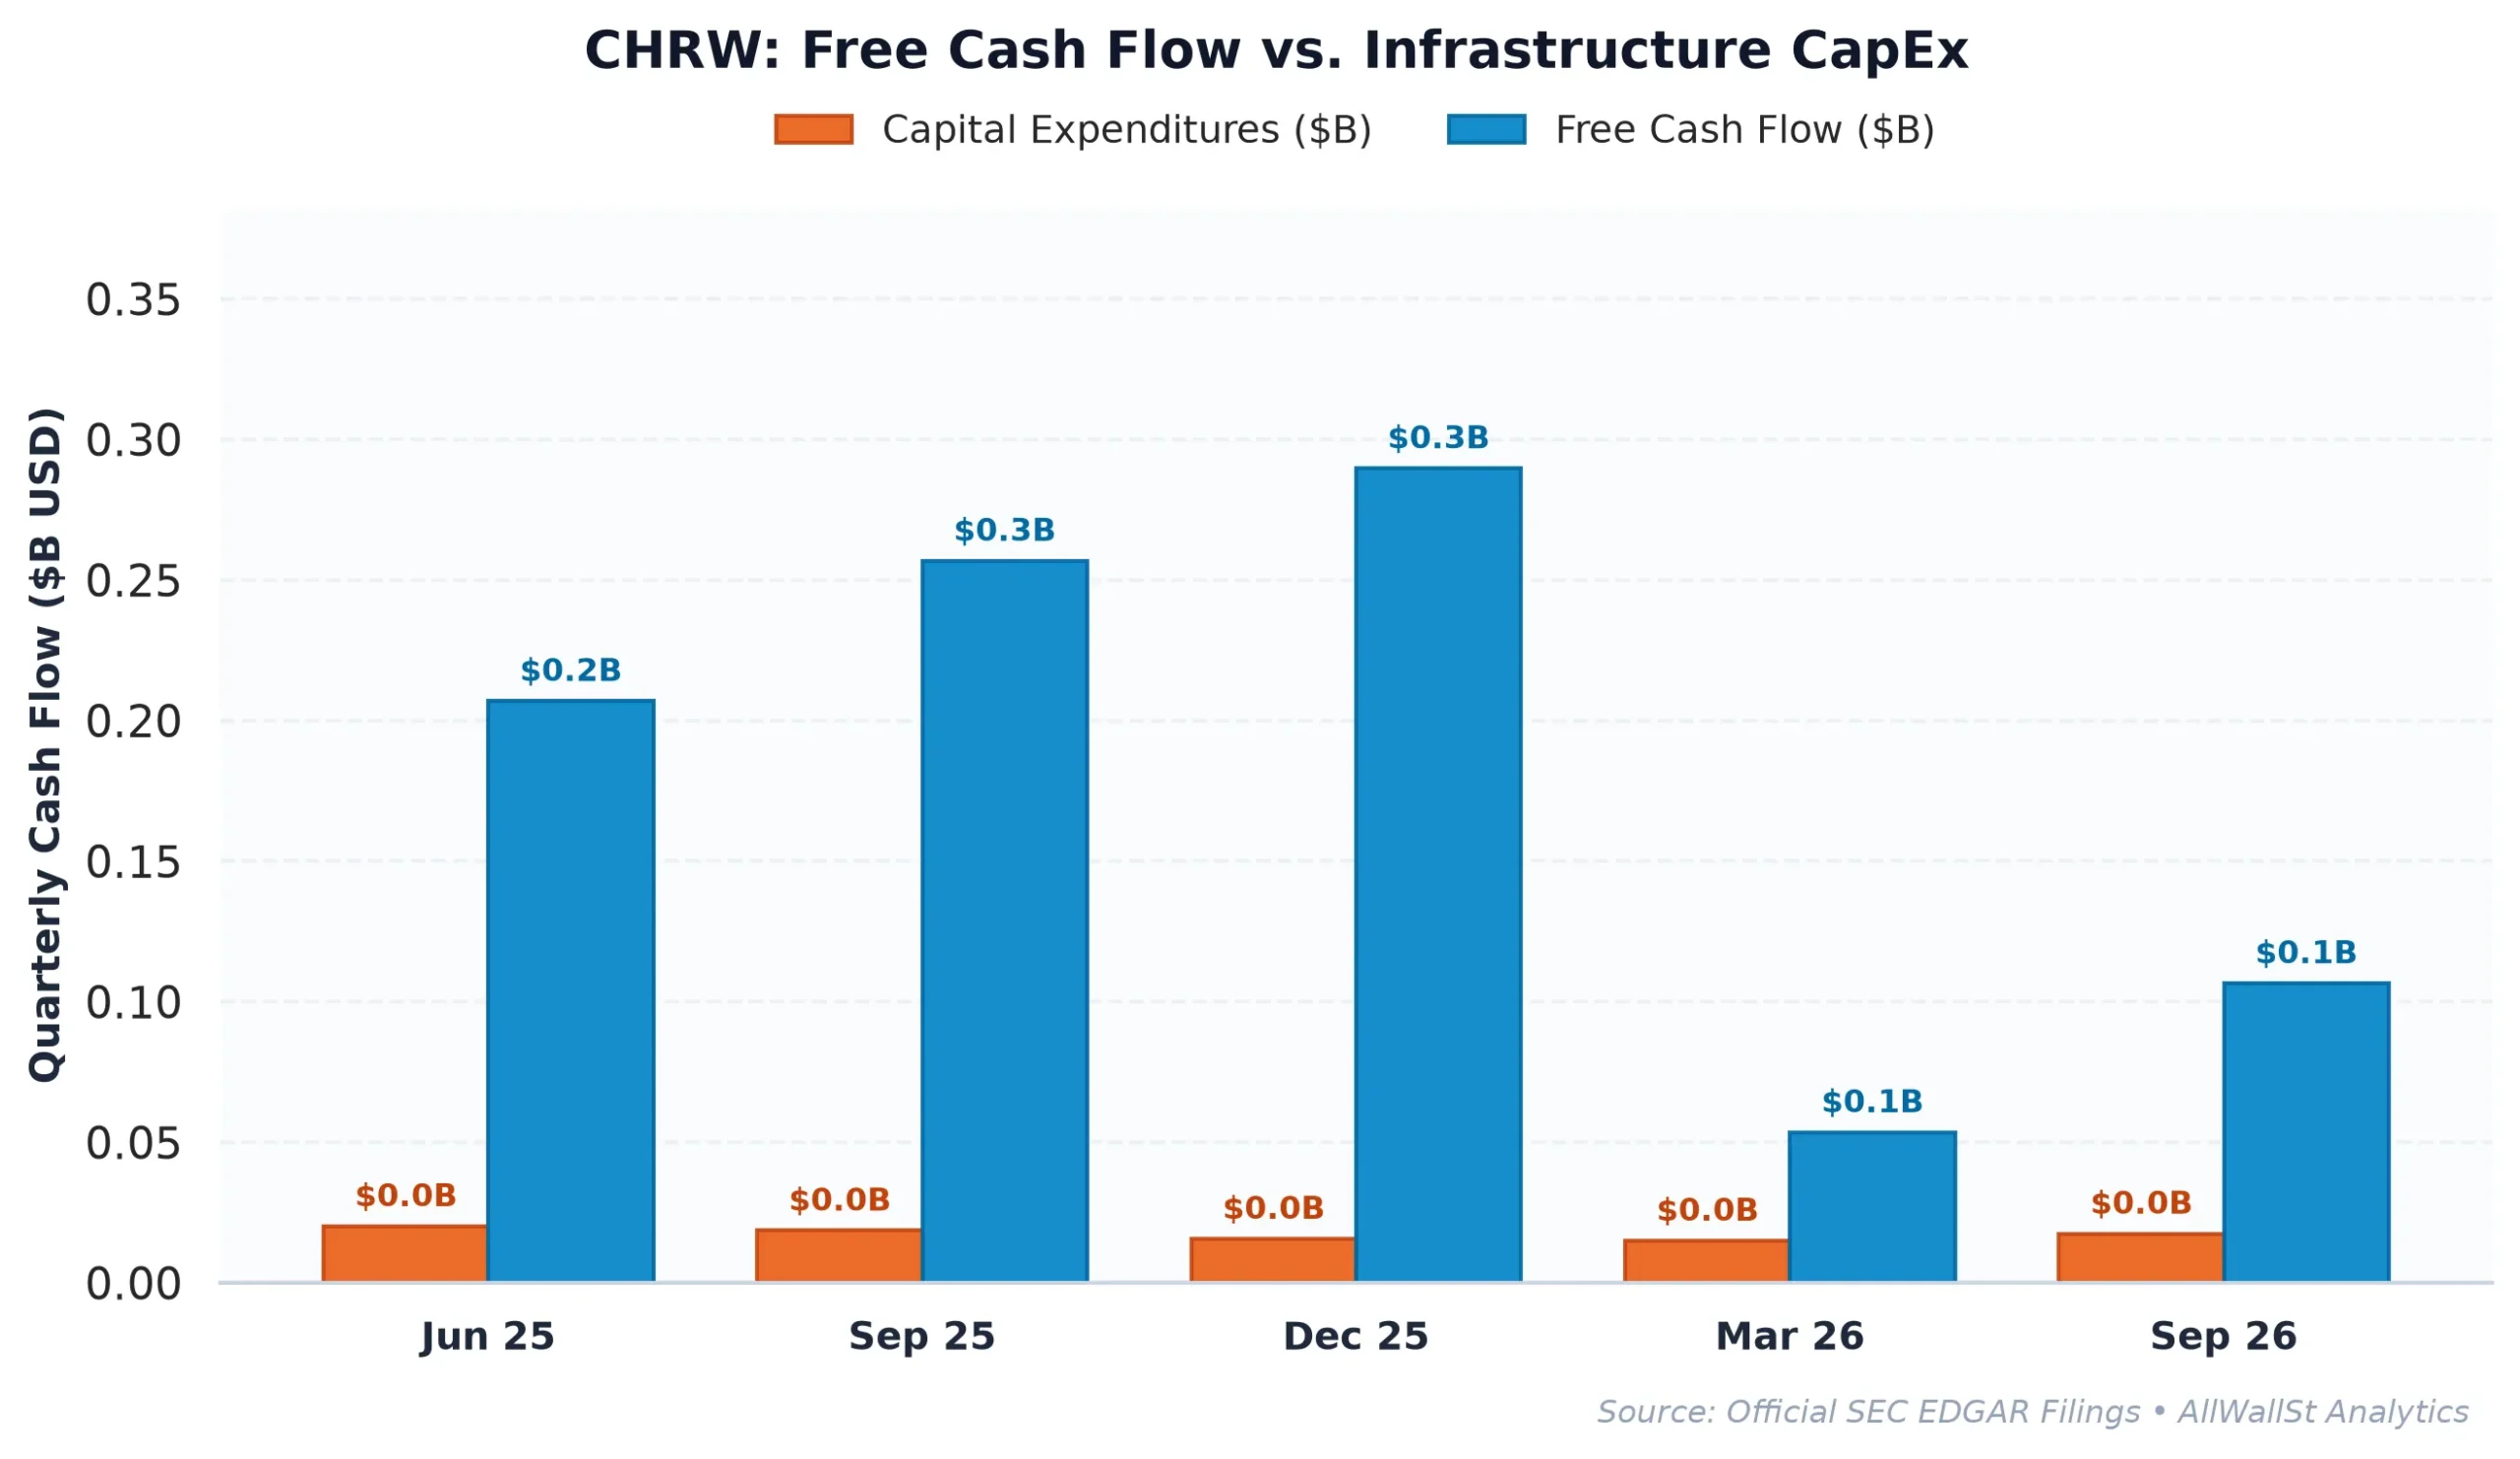
For every dollar of capital deployed into its platform, the company earns nearly 20 cents in economic returns. Because capital expenditure intensity consumes just 0.37% of revenue, operational cash flows flow almost entirely into net cash generation.
Free cash flow sits at $379.5M, or $300M when netting out $80M in stock-based compensation. Management pairs a 1.88% dividend yield with $350M in annual share buybacks, delivering a total shareholder yield of 4.12%. Net debt of 1.95x EBITDA provides ample structural leverage safety while allowing the business to reinvest through cyclical downturns.
The Valuation Disconnect and the Peer Group Gap
Wall Street analysts often lump C.H. Robinson into heavy industrial categories, benchmarking its valuation against physical equipment manufacturers and capital goods conglomerates. This comparison creates a noticeable disconnect in market pricing.
| Company (Ticker) | Market Cap | Forward P/E | EV/EBITDA | Rev Growth (YoY) | Operating Margin | FCF Yield |
|---|---|---|---|---|---|---|
| C.H. Robinson Worldwid (CHRW) | $15.8B | 18.3x | 17.9x | 29.50% | 5.27% | 2.40% |
| Caterpillar (CAT) | $236.3B | 16.0x | 16.8x | 17.3% | 18.8% | 1.68% |
| GE Aerospace (GE) | $323.2B | 33.6x | 29.3x | 15.9% | 19.7% | 1.96% |
| Eaton (ETN) | $121.4B | 18.9x | 21.1x | 28.0% | 17.7% | 2.50% |
C.H. Robinson trades at 18.3x forward earnings while generating 29.50% top-line growth. By contrast, capital-intensive compounders like GE Aerospace command 33.6x forward earnings for 15.9% growth.
While heavy manufacturers must build factories and purchase inventory, C.H. Robinson scales electronically. Its elevated price-to-book ratio of 10.02x reflects an asset-light balance sheet where earnings power stems from network scale rather than physical plants.
The company’s free cash flow yield of 2.40% sits below the 4.94% 10-Year Treasury yield, resulting in a nominal equity risk premium spread of -2.54%.
However, evaluating asset-light compounders solely on static spot cash yields misses the compounding mechanism. When revenue expands near 30% alongside double-digit operating margin potential, earnings growth rapidly narrows the initial yield gap.
Options Positioning, Risk Bounds, and Verdict
Derivatives market structure reveals strong institutional call buying alongside key price magnet levels. With the stock trading around $136.44, options open interest shows 28,570 calls against 8,628 puts, generating a low Put/Call ratio of 0.30.
+-------------------------------------------------------------------+
|               OPTIONS MARKET STRUCTURE & GAMMA MAP                |
+------------------------------------+------------------------------+
| Current Spot Price                 | $136.44                      |
| Put / Call Open Interest Ratio     | 0.30 (Call Dominant)         |
| Max Pain Strike                    | $125.00 (-8.38% from Spot)   |
| Primary Call Resistance Walls      | $135 / $140 / $170           |
| Primary Put Support Walls          | $130 / $125 / $100           |
| Implied Volatility (IV)            | 40.33%                       |
| 30-Day Deterministic Range         | +/-11.56% (+/-$15.77)        |
+------------------------------------+------------------------------+
In options market plumbing, a low Put/Call ratio indicates that institutional desks are positioned for upside momentum rather than purchasing downside put insurance.
The Max Pain strike sits at $125.00, representing the price level where the maximum value of option contracts would expire worthless. Heavy Call Walls at $135 and $140 act as near-term technical friction points, while primary Put Support at $130 provides an options dealer hedging bid floor.
The 30-day expected volatility envelope implies a range of +/-11.56% (or +$15.77), placing the upper statistical bound near $152.21 and the lower bound near $120.67.
If broader market volatility causes shares to pull back toward the $130 put wall, option market maker dynamic hedging creates a natural liquidity buffer for long-term buyers.
Skeptical bears argue that persistent spot freight rate softness and credit agreement ticking fees could weigh on net margins if volume recovery stalls. Additionally, if the stock breaks below its $130 put support floor, option dealer unwinds could pull shares down toward the $125 Max Pain strike.
However, C.H. Robinson’s asset-light model, 19.95% ROIC, expanding 5.27% operating margins, and strong 29.50% revenue growth create a durable fundamental thesis into the freight cycle recovery.
AllWallSt Investment Verdict: BUY
C.H. Robinson Worldwide, Inc. (CHRW)
Sources & References
- Official SEC Form 10-K Annual Report (Filed 2026-02-13)
- Official SEC Form 10-Q Quarterly Report (Filed 2026-10-30)
- SEC Form 8-K Primary Filing Body (2026-11-04)
-
C.H. Robinson SEC Filings: https://www.sec.gov/edgar/browse/?CIK=0001043277
- C.H. Robinson Investor Relations: https://www.chrobinson.com
- SEC Form 8-K Credit Disclosure (Nov 18, 2026): https://www.sec.gov/Archives/edgar/data/1043277/000104327726000051/chrw-20261118.htm
Disclaimer: AllWallSt publication contents are provided strictly for educational and informational purposes and do not constitute investment, legal, or tax advice. Market instruments and options structures carry risk of financial loss. Readers should conduct independent due diligence and consult certified financial advisors before executing capital decisions.