
The Mid-Cap Retailer Hiding in the Factor Screening Fog
If you run a multi-factor quantitative screen across 5,400 domestic equities, you quickly realize that the public market is heavily lopsided. A handful of mega-cap technology monopolies command massive valuation multiples, while steady mid-cap retailers quietly compound cash off to the side.
Urban Outfitters, Inc. (URBN) sits directly in that quantitative spotlight. Scoring a high-conviction 99 out of 99 on our multi-factor screener tier, the Philadelphia-based lifestyle retailer presents a curious fundamental setup. The stock trades at 12.5x forward earnings with an operating margin of 9.74%, yet its 4.01% Free Cash Flow yield sits slightly below the prevailing 4.94% 10-Year Treasury yield.
That negative equity risk premium spread of -0.93% is where the story gets interesting. In a market where investors pay 40x earnings for mega-cap retail giants, Urban Outfitters generates solid unit economics across its portfolio, which includes Anthropologie, Free People, FP Movement, and its fast-growing Nuuly clothing subscription service. Ahead of its upcoming Q3 earnings disclosure next week, management continues to expand its technology suite to secure raw material cost visibility and keep inventory lean.
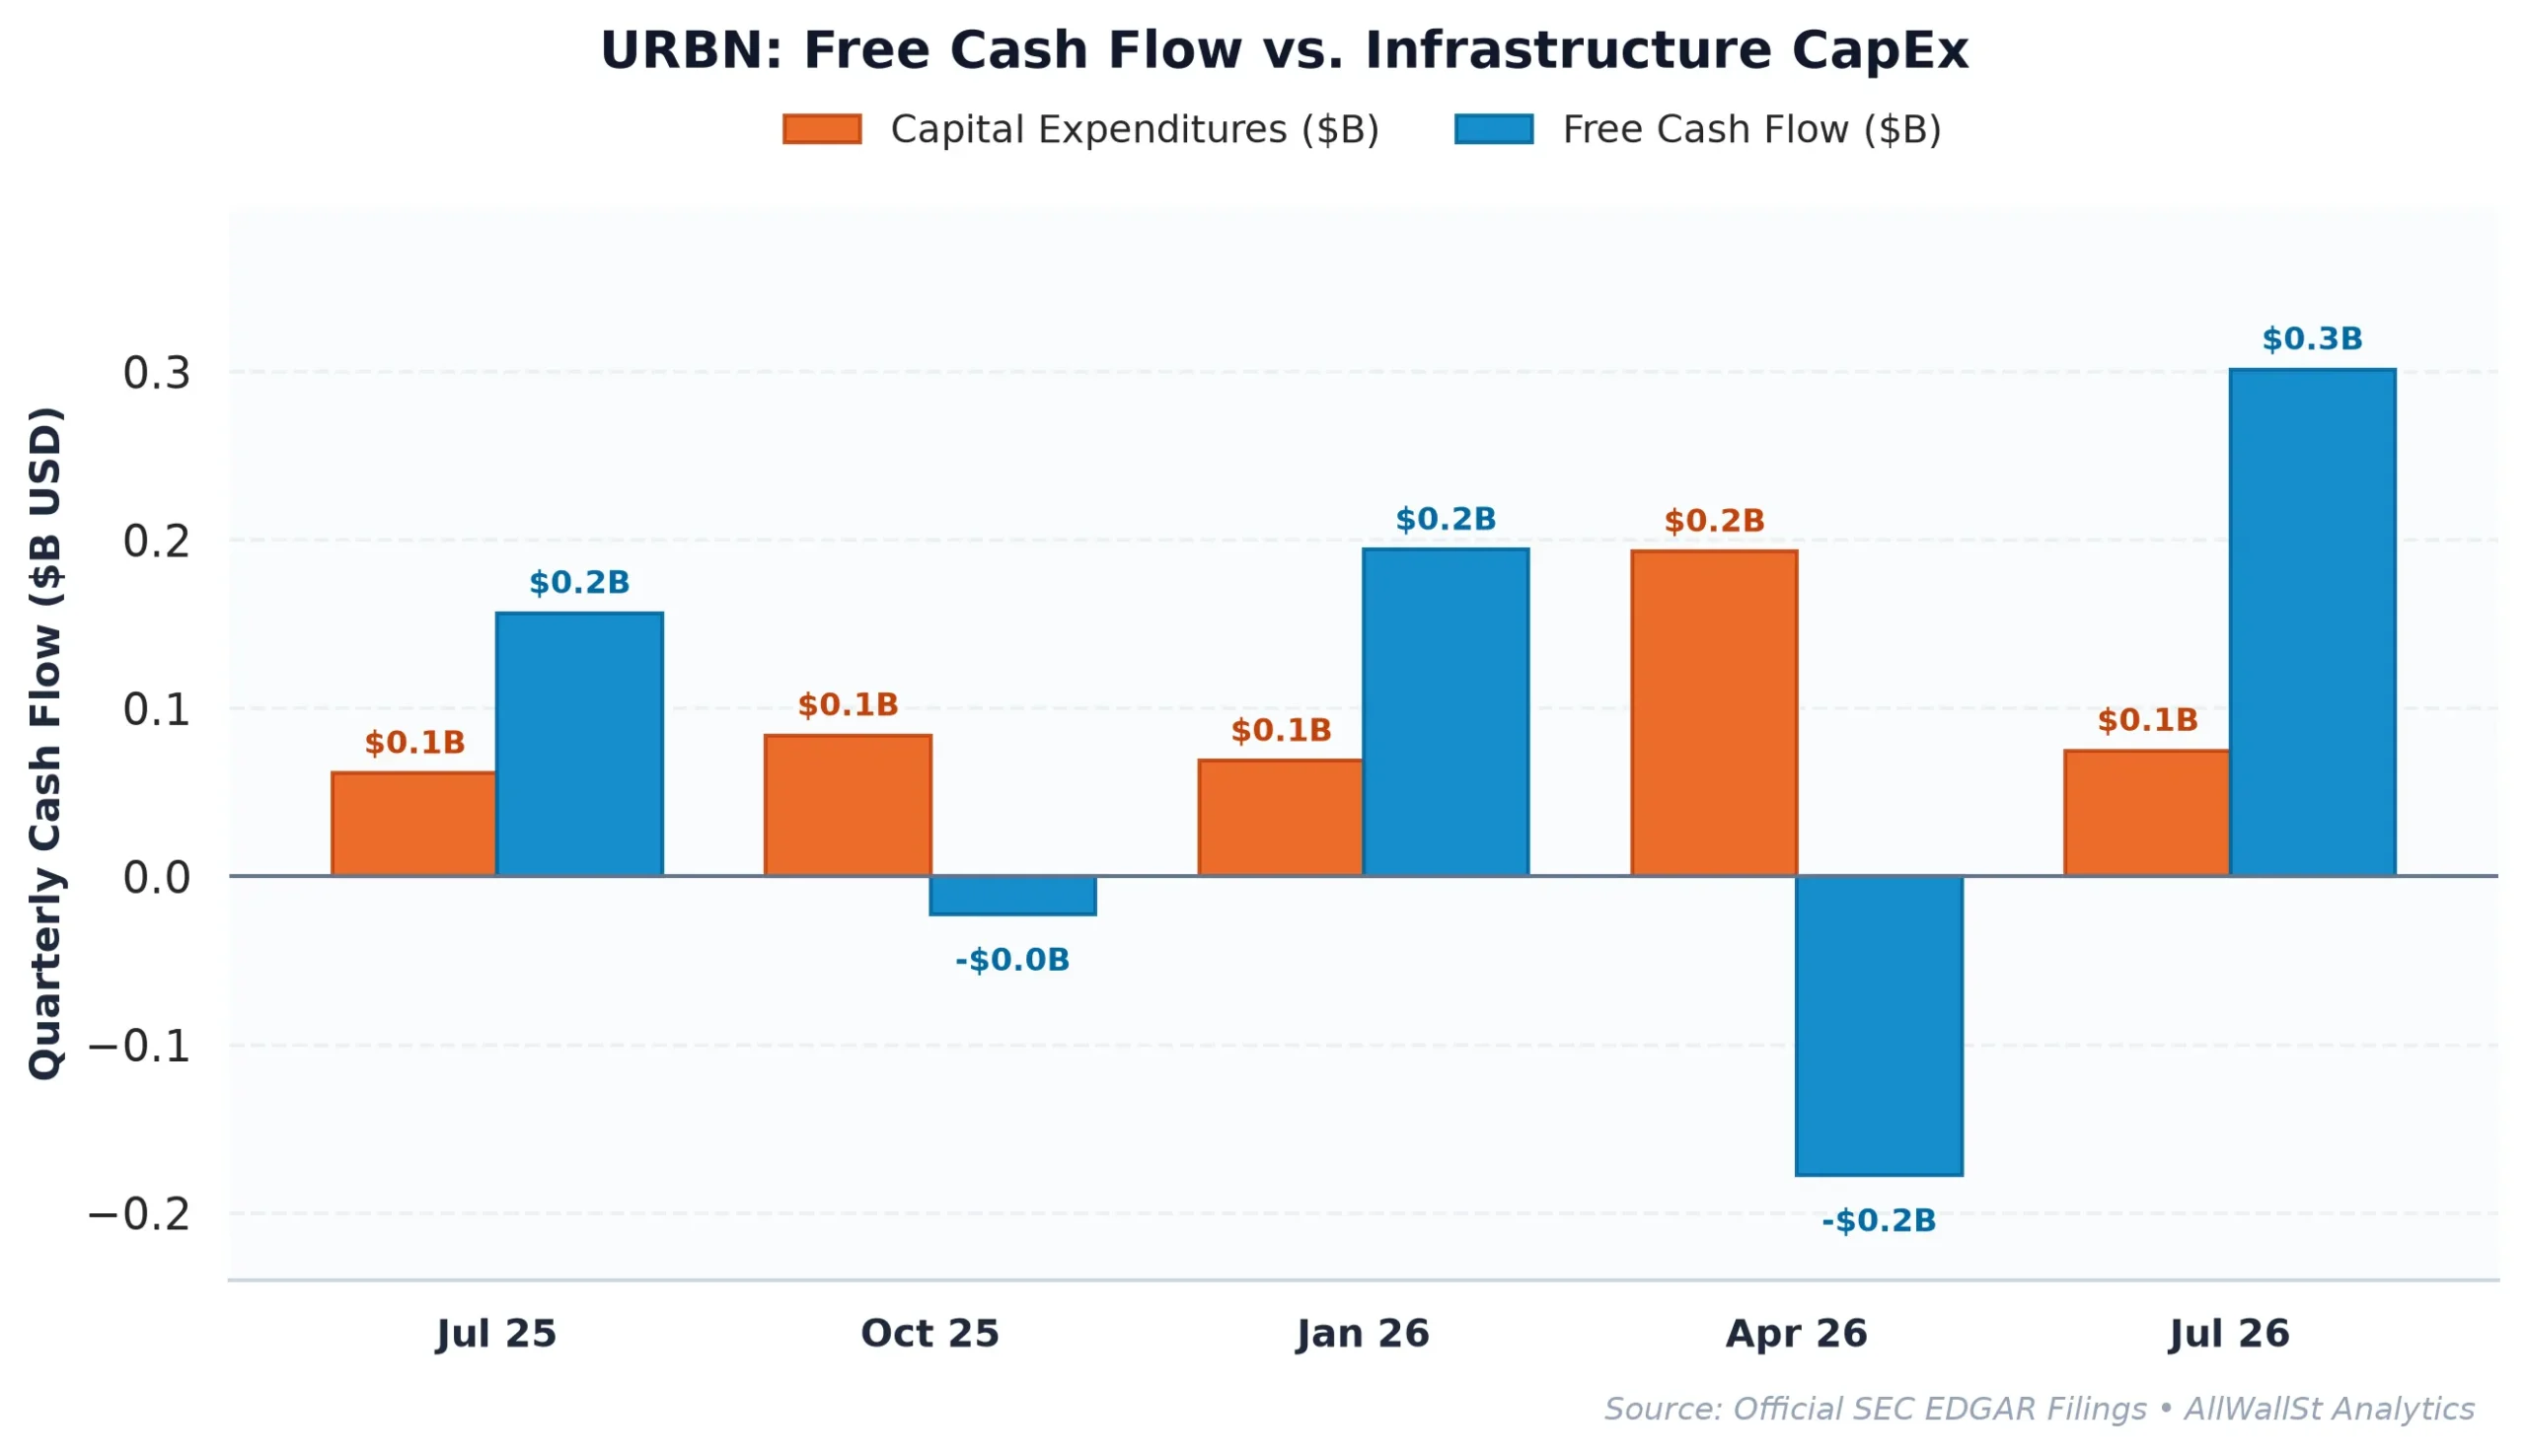
To see how Urban Outfitters stacks up against broader equity screens, investors can explore the live interactive dataset via the AllWallSt 5,400+ Equity Screener.
Margin Expansion and the SBC Reality Check
To understand why Urban Outfitters surfaces on quantitative screens, one must look closely at its operational cash flow conversion and return metrics. The company generates a 15.05% Return on Invested Capital (ROIC), comfortable headroom above its ~8.5% weighted average cost of capital (WACC). ROIC measures how effectively a business converts capital into operating profits, proving that store openings and digital infrastructure are creating genuine shareholder value.
Furthermore, forensic accounting metrics show exceptional cash flow quality. Urban Outfitters carries a -2.93% Sloan Accrual Ratio, a metric that compares reported accounting profits to actual cash entering corporate bank accounts. A negative accrual ratio confirms that reported net income of $569.1 million is backed by real operational cash rather than non-cash accounting trickery or uncollected receivables.
Stock-based compensation (SBC) also remains refreshingly modest. Management consumed just $30.4 million in SBC over the past year, representing a minor 4.2% of operating cash flow. That yields a real, un-diluted Free Cash Flow yield of 3.59%, while annual share repurchases of $150 million provide a steady 2.09% buyback yield to absorb executive share issuance.
| Period | Revenue | Operating Income | Operating Margin | Free Cash Flow | SBC Expense |
|---|---|---|---|---|---|
| FY2023 | $4.80B | $226.6M | 4.7% | $-56.8M | $29.4M |
| FY2024 | $5.15B | $376.2M | 7.3% | $309.8M | $30.5M |
| FY2025 | $5.55B | $473.8M | 8.5% | $320.3M | $31.0M |
| FY2026 | $6.17B | $605.6M | 9.8% | $315.0M | $30.4M |
Looking back across the multi-year trajectory, operating margins expanded from 4.7% in FY2023 to 9.8% in FY2026. This structural double-digit revenue growth trajectory, combined with low leverage (0.64x Net Debt to EBITDA), gives the balance sheet considerable resilience against high interest rate environments.
Retail Multiples and the Large-Cap Premium Gap
The valuation gap between mid-cap specialized apparel retailers and mega-cap retail behemoths has rarely been wider. While index benchmark capital flows overwhelmingly into mega-cap equities regardless of price, mid-cap operators like Urban Outfitters trade at deep relative discounts.
| Company (Ticker) | Market Cap | Forward P/E | EV/EBITDA | Rev Growth (YoY) | Operating Margin | FCF Yield |
|---|---|---|---|---|---|---|
| Urban Outfitters (URBN) | $7.4B | 12.5x | 10.1x | 10.40% | 9.74% | 4.01% |
| Walmart (WMT) | $1.03T | 40.1x | 24.5x | 5.9% | 3.9% | 0.69% |
| Costco Wholesale (COST) | $493.2B | 44.4x | 33.4x | 11.1% | 3.8% | 1.37% |
| Amazon.com (AMZN) | $2.70T | 22.9x | 16.2x | 12.1% | 13.1% | -1.28% |
Urban Outfitters trades at an EV/EBITDA of 10.1x, less than half the valuation multiple commanded by Walmart (24.5x) or Costco (33.4x). Yet Urban Outfitters delivers faster top-line sales growth at 10.40% YoY and generates significantly higher operating margins (9.74%) than traditional mass retailers.
This multiple disparity stems primarily from index mechanics. Mega-cap retailers absorb automated passive inflows, while Urban Outfitters operates with negligible benchmark weight, forcing sell-side price discovery to rely strictly on fundamental earnings execution. At 12.5x forward earnings, the stock is priced for modest growth, creating an attractive safety cushion for patient capital.
Options Plumbing, Volatility Bounds, and the Neutral Pin
Derivatives market structure reflects a balanced tug-of-war as traders position for next week’s earnings announcement. Options market liquidity shows a Put/Call Open Interest ratio of 0.79, signaling a neutral to slightly bullish bias among options market makers.
The options Max Pain strike sits at $80.00, approximately 6.98% below the current stock price of $86.00. Max Pain represents the exact strike price where the highest dollar volume of options contracts expires completely worthless, acting as a natural financial magnet into monthly options expiration.
Key options boundaries are well-defined. Strong institutional bid support forms a Put Wall at $85.00, backed by secondary put support at $70.00. Overhead supply creates a Call Wall at $90.00, marking tight near-term upside resistance. At the same time, front-month At-The-Money (ATM) implied volatility sits at 60.16%, reflecting an expected 30-day move of +$14.83 or -$14.83 (17.25%).
This implied volatility reading appears elevated relative to the stock’s 1.22 Beta, largely driven by off-hours option bid-ask spread widening ahead of earnings. With dealer gamma inventory evenly split between call resistance and put support, shares appear constrained within a tight trading corridor near term.
Investment Committee Steelman Dissent: Bulls can reasonably contend that Nuuly subscription growth and FP Movement expansion justify an immediate multiple re-rating toward 15x earnings, which would push shares above $100. Conversely, bears argue that a 4.01% Free Cash Flow yield fails to compensate investors when risk-free 10-Year Treasuries yield 4.94%, creating downside risk toward the $80 Max Pain level if Q3 store markdowns surprise to the upside.
AllWallSt Investment Verdict: HOLD (Initiation)
Urban Outfitters, Inc. (URBN)
Sources & References
- Official SEC Form 10-K Annual Report (Filed 2026-04-01)
- Official SEC Form 10-Q Quarterly Report (Filed 2026-09-09)
- SEC Form 8-K Primary Filing Body (2026-05-26)
- SEC Form 8-K Exhibit 99.1 (Press Release / Earnings) (2026-08-27)
- SEC SCHEDULE 13D Beneficial Ownership Disclosure (2026-02-18)
- SEC DEF 14A Proxy / M&A Filing (2026-04-01)
- Federal Register (2026-06-12): Hazardous Materials: Notice of Applications for New Special Permits
-
Federal Register (2026-07-14): Hazardous Materials: Notice of Actions on Special Permits
-
SEC EDGAR Corporate Filings: Urban Outfitters, Inc. CIK 0000912615
- Official Investor Relations Portal: Urban Outfitters, Inc. IR
- Form 8-K Regulatory Filing (Item 8.01 / 9.01 Press Release): SEC EDGAR Record
- Financial Market Screener Data: AllWallSt Confluence Desk
Regulatory Disclaimer: All research published by AllWallSt is provided strictly for educational and informational purposes and does not constitute financial advice, investment recommendations, or an offer to buy or sell securities. Fundamental metrics, options market structure parameters, and sovereign yields are derived from public disclosures and quantitative models. Past fundamental performance is no guarantee of future equity returns. Investors must conduct independent due diligence prior to making capital decisions.