
This week on Wall Street was not particularly kind to anyone who owned risk assets and hoped to enjoy their weekend. Tech equities suffered a sharp drawdown, with the Nasdaq falling over 5% and broader indices grinding lower under the relentless gravity of a 4.91% 10-Year Treasury yield.
Yet quietly, inside the unglamorous plumbing of the basic materials sector, Linde plc spent Friday afternoon doing what it does best: defying cyclical distress and pinning neatly to its options strike. Shares of Linde closed at $502.83, almost exactly on top of its deterministic $500 Max Pain strike, where option sellers collect maximum premium and market makers achieve delta-neutral bliss.
The calm price action capped a noisy few days. On Wednesday, State Street Materials Select Sector SPDR (XLB) disclosed passive rebalancing sales of Linde and Newmont, sparking a round of algorithmic trimming across systematic index strategies.
When passive exchange-traded funds mechanically sell shares to match weightings, human fundamental investors are given a rare opportunity: buying world-class monopolistic infrastructure at a liquidity discount. Linde does not sell speculative software or unproven consumer gadgets; it separates atmospheric air into oxygen, nitrogen, and argon, piping them directly into semiconductor fabrication plants, hospitals, and aerospace facilities under multi-decade take-or-pay contracts.
The Moat Built on Atmospheric Air and Pass-Through Clauses
To understand why Linde trades like an essential sovereign utility rather than a volatile chemical producer, one must look at the mechanics of the industrial gas industry. The basic business model consists of building an air separation unit directly next to an industrial customer, laying a pipeline across the property line, and signing a 15-to-20-year contract that mandates payment whether the customer turns on the gas tap or not.
Even better, these agreements feature contractual energy pass-through provisions. If wholesale power prices spike, Linde does not absorb the margin hit; it automatically bills the electricity cost back to the customer.
That structural pricing power was on display in Linde’s recent third-quarter 2026 financial report. The company posted record quarterly sales of $9.4 billion, representing 9% top-line expansion, while adjusted operating margins widened to 29.4%.
For the full year 2026, management lifted its adjusted earnings guidance to between $17.82 and $17.92 per share, demonstrating an annualized growth trajectory of 8% to 9% in an industrial climate where many cyclical peers are slashing guidance.
| Period | Revenue | Operating Income | Operating Margin | Free Cash Flow | SBC Expense |
|---|---|---|---|---|---|
| FY2022 | $33.36B | $6.46B | 19.4% | $5.69B | $107.0M |
| FY2023 | $32.85B | $8.11B | 24.7% | $5.52B | $141.0M |
| FY2024 | $33.01B | $8.60B | 26.0% | $4.93B | $160.0M |
| FY2025 | $33.99B | $9.25B | 27.2% | $5.09B | $164.0M |
Looking across the multi-year trajectory, Linde’s operating margin has steadily expanded from 19.4% in fiscal 2022 to 27.2% in fiscal 2025, reaching 27.57% on a trailing basis.
The quality of its reported free cash flow is exceptionally clean. Out of $4.19 billion in trailing twelve-month free cash flow, stock-based compensation accounted for a modest $160 million, or roughly 1.5% of operating cash flow.
Unlike Silicon Valley platforms that report phantom cash flows while printing shares to enrich executives, Linde directed $4.60 billion into cash share repurchases over the past twelve months. That buyback program drove a 1.99% net share retirement rate, which, paired with its 1.27% cash dividend, provides equity investors with an attractive 3.26% total shareholder yield.
The balance sheet reflects similar discipline. Net debt sits at $22.76 billion, representing a conservative 1.65x leverage ratio against annual cash earnings, while Return on Invested Capital (ROIC) stands at 12.94%. Against an estimated 8.5% weighted average cost of capital, Linde comfortably beats its economic hurdle rate.
The Specialty Chemical Pricing Chasm
Linde’s commanding financial profile becomes even more obvious when set against its primary peers in specialty chemicals, coatings, and water treatment.
| Company (Ticker) | Market Cap | Forward P/E | EV/EBITDA | Rev Growth (YoY) | Operating Margin | FCF Yield |
|---|---|---|---|---|---|---|
| Linde plc (LIN) | $230.8B | 25.7x | 18.7x | 9.20% | 27.57% | 1.82% |
| Air Products and Chemicals (APD) | $66.2B | 19.1x | 18.7x | 12.3% | 24.3% | -0.28% |
| Sherwin-Williams (SHW) | $82.1B | 25.8x | 20.1x | 7.9% | 16.2% | 3.02% |
| Ecolab (ECL) | $82.7B | 31.1x | 22.6x | 12.7% | 18.5% | 1.74% |
At first glance, value-focused screeners might look at Air Products and Chemicals trading at 19.1x forward earnings and wonder why Linde commands 25.7x. The answer lies in capital allocation and execution reliability.
While Air Products has committed billions of dollars of unhedged capital to ambitious, speculative green hydrogen megaprojects in distant jurisdictions, dragging its trailing free cash flow yield into negative territory (-0.28%), Linde has stayed disciplined. Linde anchors its capital expenditures strictly against signed customer off-take agreements, building an active project backlog of $11 billion, including a record $8.1 billion in long-term sale of gas contracts.
Its specialized pipeline extends deeply into high-margin sovereign and technology sectors. A recent notice in the Federal Register detailed proposed production activity for Linde Gas & Equipment Inc. inside Foreign-Trade Zone 93 in Research Triangle Park, North Carolina, expanding high-purity gas capacity for domestic semiconductor manufacturing.
Meanwhile, federal procurement records show Linde holding prime contract vehicles across key agencies, including a $24.48 million active ceiling with NASA for helium liquefiers and equipment packages, alongside liquid oxygen and nitrogen supply agreements at Kennedy Space Center. When governments and chip foundries build critical infrastructure, Linde is the default supplier.
Gamma Plumbing, Hedging Skew, and the Verdict
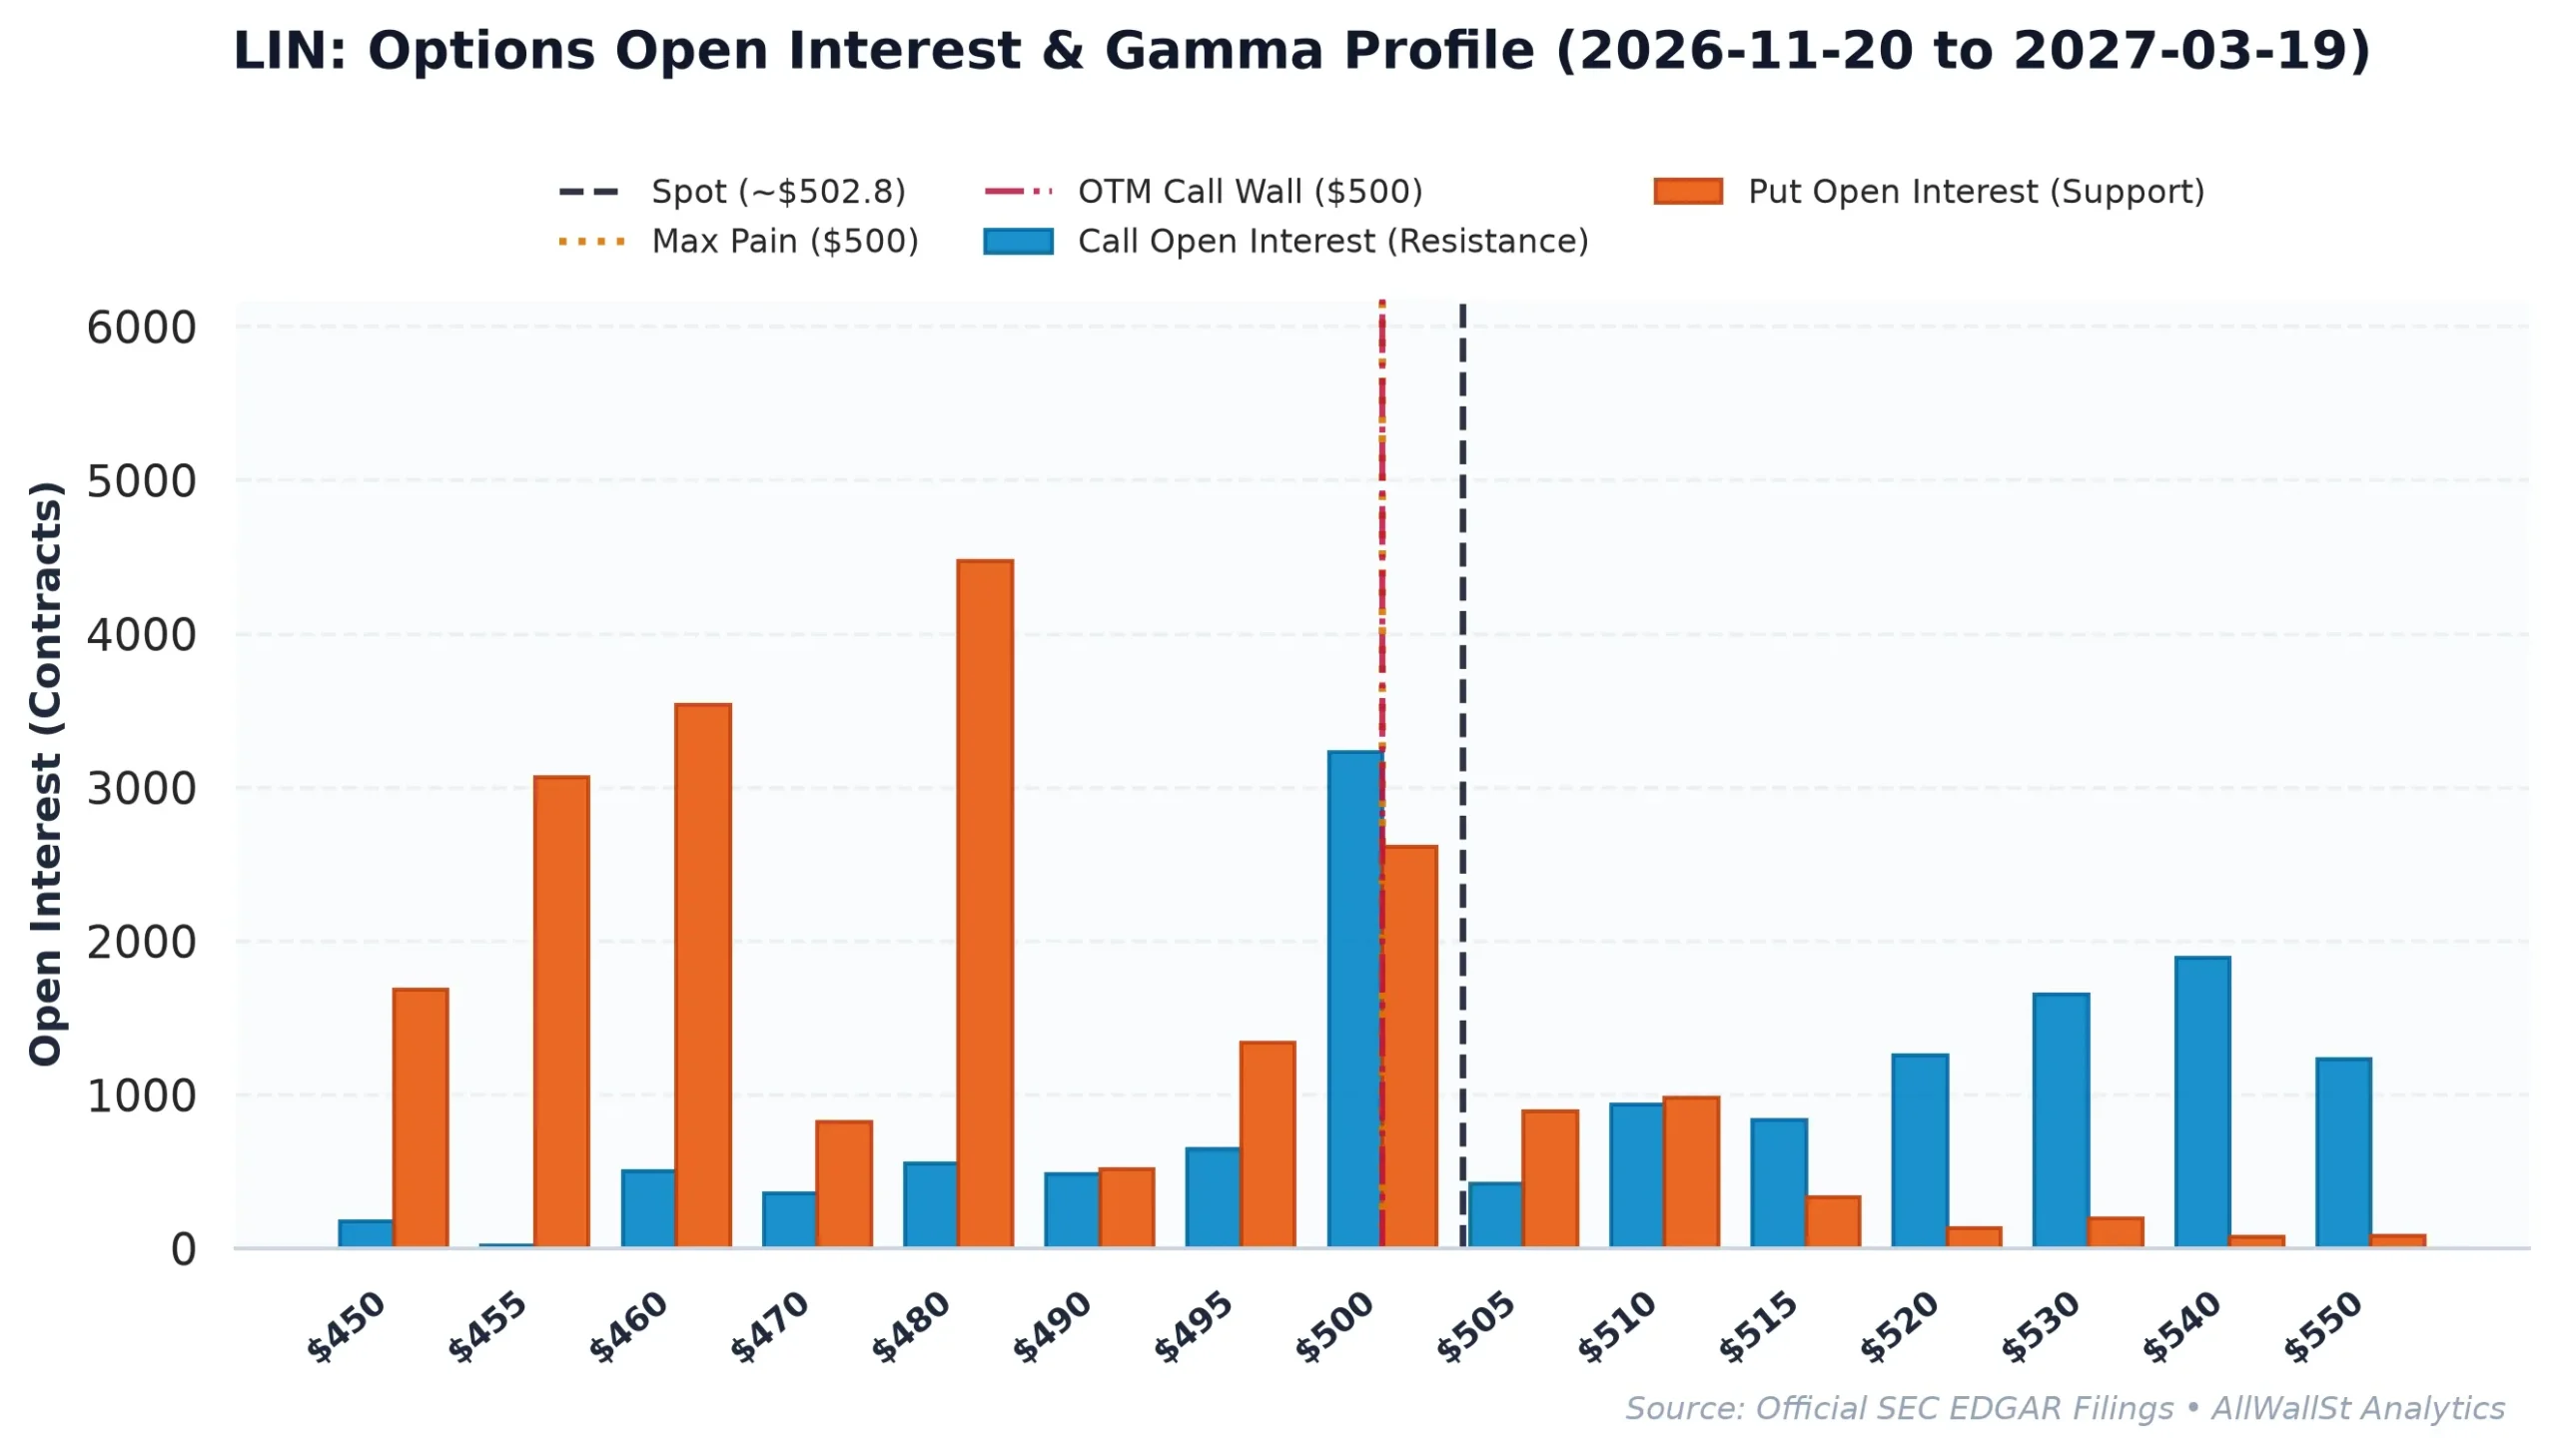
From an equity derivatives perspective, this week’s trading provided a textbook case of options market making. Heading into Friday’s triple-expiration sequence, Linde’s options chain exhibited a heavy defensive put skew, carrying an elevated Put/Call open interest ratio of 1.58.
When market participants purchase downside puts as portfolio insurance, options dealers take the opposite side by selling puts and shorting underlying shares to remain delta neutral. If the stock refuses to break down, the steady passage of time decays those put options toward zero value. To maintain balance, dealers are forced to buy back their underlying short stock hedges, creating a mechanical floor under spot prices.
Linde sat between a heavy Call Wall at the $500 strike (3,019 contracts) and deep structural Put Support at the $480 strike (4,264 contracts) and $460 strike (3,225 contracts).
With spot price closing at $502.83, the stock settled within 0.6% of its exact $500.00 Max Pain strike. The 30-day implied volatility of 27.70% establishes an expected move envelope of approximately plus or minus $39.92, framing a well-defined consolidation channel between $462 and $542.
Because the passive selling from State Street’s sector rebalancing failed to break the $500 dealer magnet, the heavy concentration of open put contracts now leaves the stock vulnerable to a sharp upward squeeze as short hedges unwind into December trading.
Investment Committee Steelman Dissent: The principal risk to this bullish thesis centers on valuation multiples: at 25.7x forward earnings and a 1.82% trailing free cash flow yield, any unexpected delay in high-margin semiconductor fab completions could cause the stock to re-rate downward toward peer multiples near 20x. Furthermore, should sovereign bond yields push past 5.25%, equity duration risk could trigger broad multiple compression across low-yielding defensive compounders regardless of contract quality.
Nevertheless, Linde represents the gold standard of real-economy compounders. With 27.6% operating margins, contractually secured energy pass-through protections, negative working capital cycles, and a pristine balance sheet, the stock offers institutional stability in an increasingly volatile market environment.
AllWallSt Investment Verdict: BUY
Linde plc (LIN)
Sources & References
- Official SEC Form 10-K Annual Report (Filed 2026-02-25)
- SEC Form 8-K Exhibit 99.1 (Press Release / Earnings) (2026-10-29)
- SEC Form 8-K Exhibit 99.1 (Press Release / Earnings) (2026-07-31)
- SEC DEF 14A Proxy / M&A Filing (2026-04-29)
-
SEC EDGAR CIK: 0001707925 Corporate Reporting Registry: https://www.sec.gov/edgar/browse/?CIK=0001707925
- Linde plc Form 10-Q Quarterly Report for the Period Ended September 30, 2026: https://www.sec.gov/Archives/edgar/data/1707925/000162828026068079/lin-20260930.htm
- Linde plc Form 8-K Material Event Disclosure (Q3 Earnings Release): https://www.sec.gov/Archives/edgar/data/1707925/000165495426009199/lin_8k.htm
- Official Corporate Portal & Investor Relations: https://www.linde.com
- Federal Register Notice (FTZ 93 High Purity Semiconductor Gases): https://www.federalregister.gov/documents/2026/07/20/2026-14580/foreign-trade-zone-ftz-93-notification-of-proposed-production-activity-linde-gas-and-equipment-inc
- USASpending.gov Federal Prime Contract Award Vehicle (NASA Helium Liquefiers): https://www.usaspending.gov/award/CONT_AWD_80GRC025C0004_8000_-NONE-_-NONE-
Regulatory Disclaimer: This publication is produced for institutional research and informational purposes only and does not constitute individual investment advice, financial endorsement, or an offer to buy or sell any security. Past operational performance is no guarantee of future returns. Investors should conduct independent due diligence and evaluate their risk tolerance before committing capital.