
If you run a multi-billion dollar tech growth mandate, your primary job is to find monopolies before the antitrust authorities notice them, or right after everyone agrees they are indispensable. For the past two years, the undisputed consensus darling of institutional equity portfolios has been Arm Holdings plc (NASDAQ: ARM).
The narrative pitch is elegant, seductive, and easily repeated in investment committee decks. Arm does not manufacture chips, so it takes zero foundry risk. It does not fund multibillion dollar extreme ultraviolet lithography scanners, so it takes zero depreciation charges. Instead, it licenses the fundamental instruction set architecture that powers 99 percent of premium smartphones, and it collects royalties on custom silicon deployed across cloud datacenters. Every time an engineer at Nvidia, Amazon, Alphabet, or Apple designs an energy efficient CPU, Arm takes a toll.
It sounds like the perfect tollbooth business. But when you examine the financial mechanics under the hood, a strange math problem emerges.
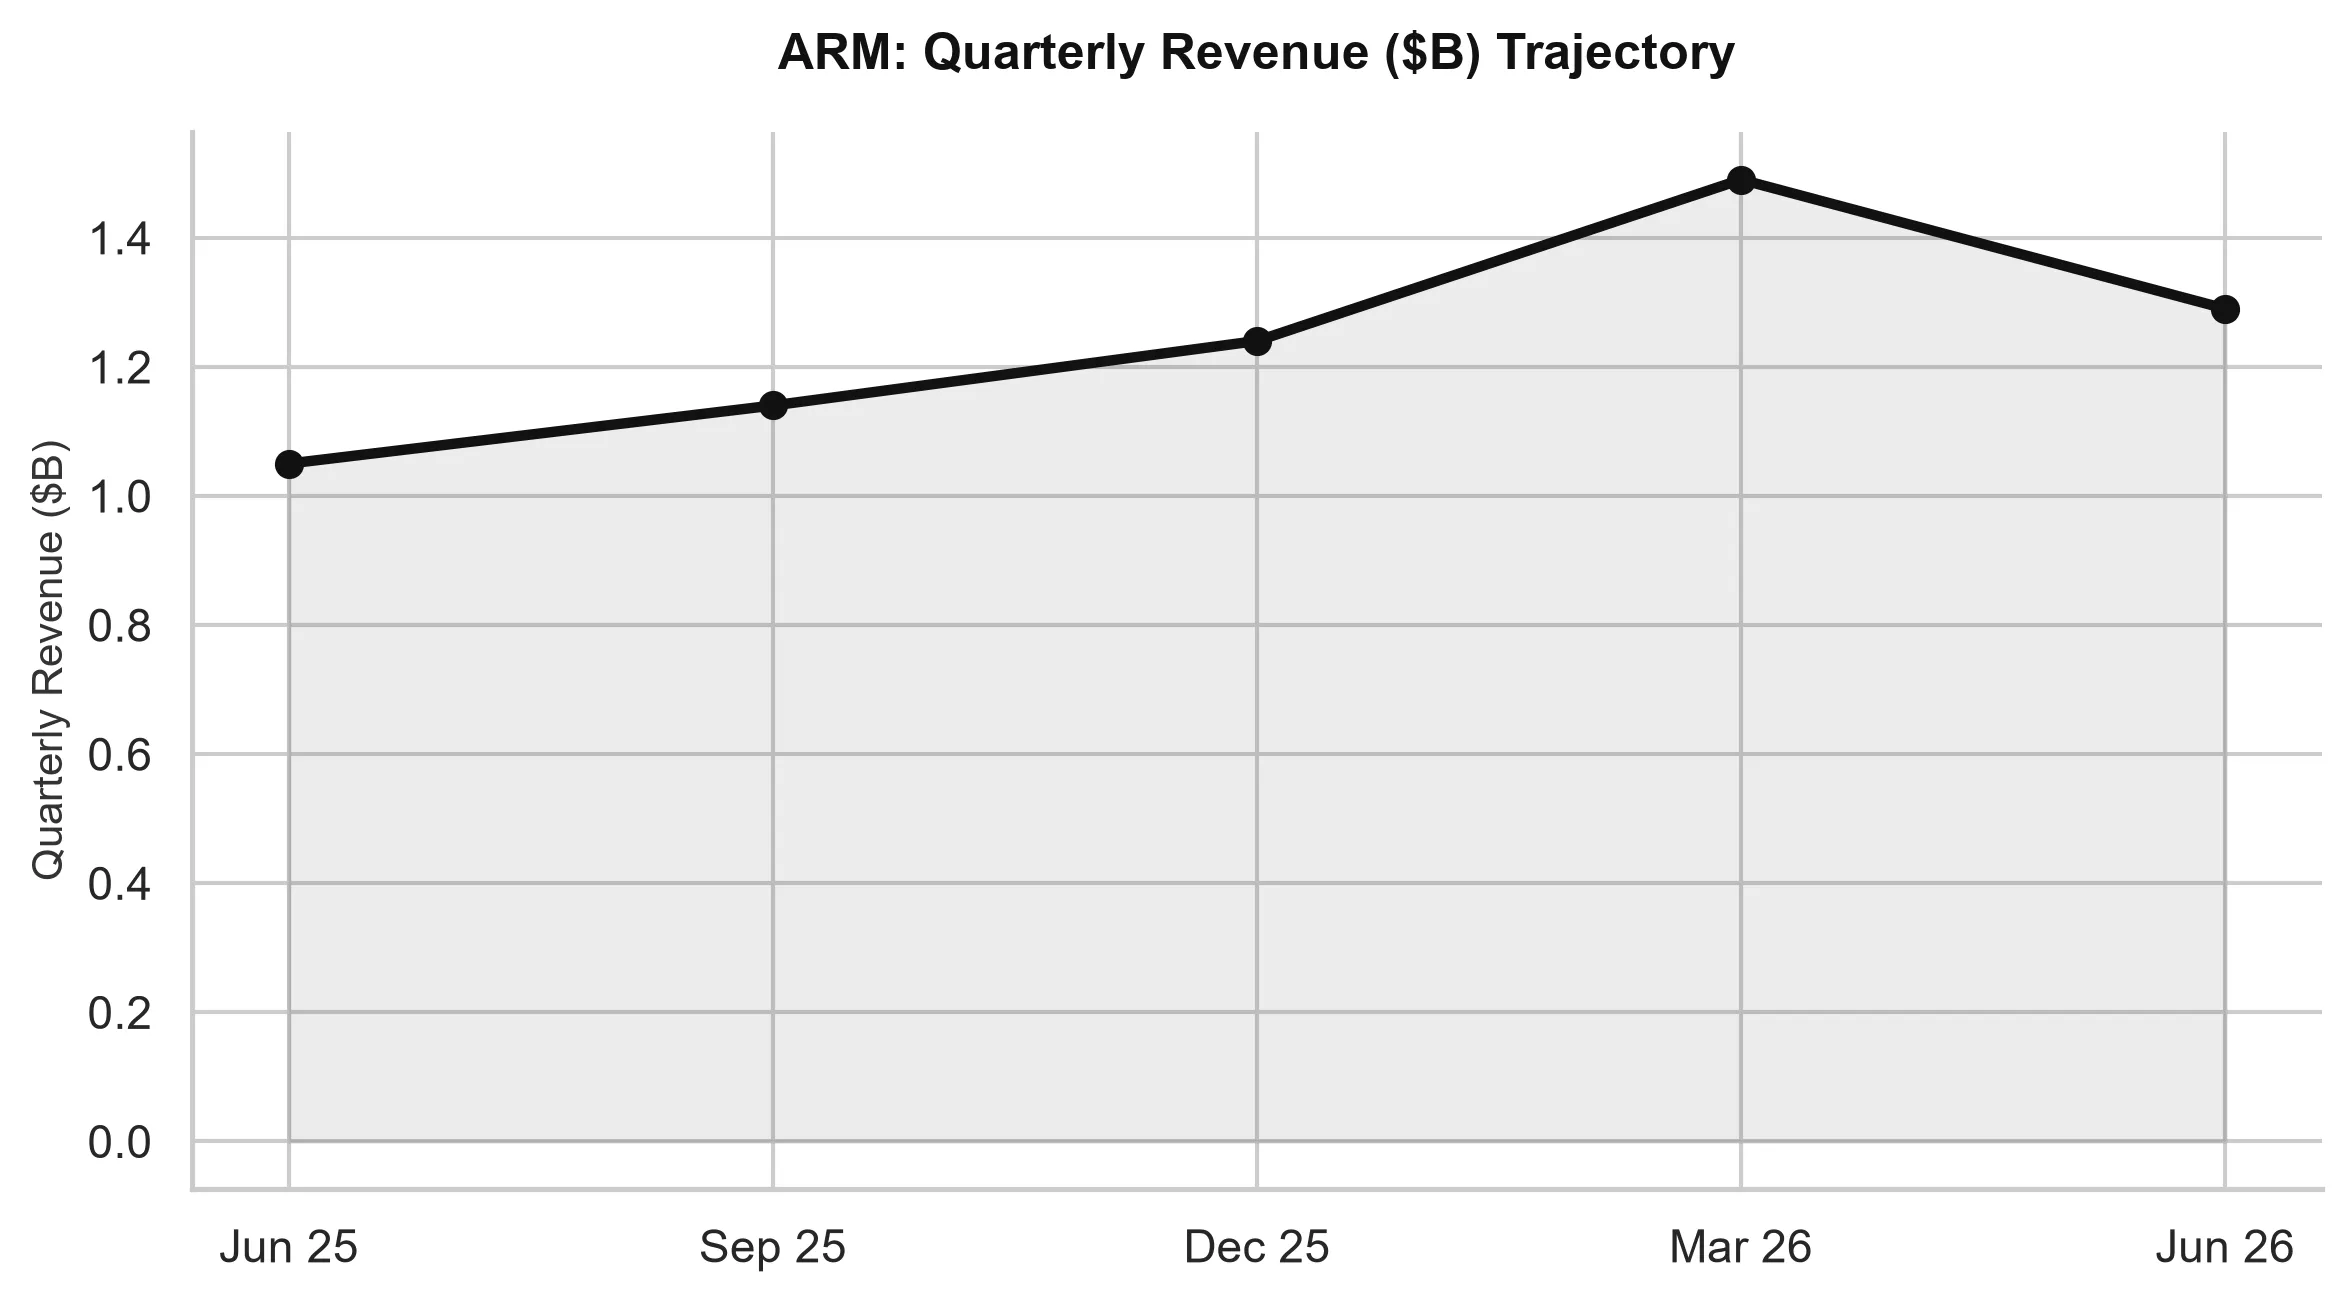
The Multiple That Swallowed the Room
Consider the numbers reported in official filings. At recent trading levels of $297.51 per share, Arm commands an equity market capitalization of $317.74 billion and an enterprise value of $319.73 billion.
Against that capital base, Arm generated total revenue of $5.16 billion over the trailing twelve months. Net income stood at $1.04 billion, while free cash flow totaled $1.33 billion.
Here is what that arithmetic produces in standard Wall Street metrics:
- Enterprise Value to Revenue: 62.01x
- Trailing Price to Earnings: 306.71x
- Forward Price to Earnings: 97.14x
- EV to EBITDA: 300.58x
- Free Cash Flow Yield: 0.42%
- Year-over-Year Revenue Growth: 22.40%
(Metrics calculated from official SEC filings via quantitative models).
To understand how unusual this is, you have to remember how semiconductor intellectual property has traded throughout financial history. When Arm was previously public before SoftBank acquired it in 2016, it was widely considered one of the highest quality software and architecture assets in Europe. It traded between 25x and 40x earnings, and roughly 10x to 15x sales. Premier electronic design automation peers like Synopsys and Cadence Design Systems currently trade between 12x and 16x sales, and those businesses enjoy deeply entrenched enterprise lock-in.
Arm is currently trading at 62 times sales.
When a stock trades at 62 times revenue, the market is not simply pricing in operational excellence. The market is pricing in an economic miracle where revenues compound at hypergrowth rates indefinitely, profit margins expand dramatically, and customers submit quietly to endless price increases.
The Growth Trap: Reverse Engineering the Math
Let us stress-test what Arm must achieve to justify its current valuation under historical institutional multiples.
Suppose you believe that Arm is an exceptional asset entitled to a terminal valuation multiple of 25x revenue. Even in the semiconductor industry, 25x sales is a generous valuation, reserved for the absolute upper decile of high-margin software franchises.
To support its current enterprise value of $319.73 billion at a 25x sales multiple, Arm would need annual revenue of $12.79 billion.
Arm currently earns $5.16 billion. To bridge that gap, revenue must expand by 148 percent.
At its current year-over-year revenue growth rate of 22.4 percent, Arm would require nearly five consecutive years of uninterrupted compounding just to produce the revenue required for a 25x multiple. And if it achieves that monumental operational feat, an investor buying the shares today at $297.51 would experience zero percent capital appreciation over five years, because the multiple contraction would completely absorb every dollar of operational growth.
What if the multiple re-rates toward the semiconductor peer median of 15x sales? Under that scenario, Arm would need $21.3 billion in annual top-line revenue, which represents more than four times its current business size. If revenue growth instead decelerates to 15 percent, the compression in valuation multiples would trigger severe capital losses for passive indexers and crowded momentum funds.
The Margin Illusion
One reason growth funds pay premium multiples for Arm is gross margin. At 97.54 percent, Arm’s gross margin looks like a pure software business. Arm sells intellectual blueprints and architectural licenses, which carry negligible cost of goods sold.
However, the operating reality is far more expensive. Arm’s operating margin sits at just 7.60 percent.
Where does the money go? It goes into engineering talent and specialized research and development. Architectural design for cutting-edge nodes requires immense technical overhead. Furthermore, stock-based compensation remains a significant structural expense. When operating margins are single digits and free cash flow yield is 0.42 percent, an investor is paying 300 dollars per share for approximately one dollar and twenty-five cents of actual annual cash generation.
In an interest rate regime where ten-year United States Treasuries yield over 4 percent risk-free, receiving a 0.42 percent cash flow yield on an equity security demands unquestionable certainty of future cash flow expansion.
The Hyperscaler Revolt
The central bullish pillar for Arm is that it can unilaterally raise royalty rates. Under its newer Armv9 architecture, Arm charges approximately double the royalty rate per chip compared to Armv8. In smartphones, Arm already commands over 99 percent penetration. Because global smartphone unit shipments have matured into low single-digit growth, Arm’s only avenue for smartphone revenue growth is extraction: collecting more basis points on each device sold.
In cloud computing, Arm architectures power Amazon Graviton, Google Axion, and Microsoft Cobalt processors. Bullish analysts project that cloud server market share will climb from 15 percent toward 40 percent.
Here is the strategic friction that the consensus model overlooks: Arm’s largest customers are the wealthiest corporate entities on Earth. Amazon, Alphabet, Microsoft, Apple, Qualcomm, and Nvidia do not like being captive to a single supplier’s licensing terms.
When Arm attempted to renegotiate licensing terms and explore charging royalties based on full device selling prices rather than chip value, it faced intense customer pushback and legal disputes.
Simultaneously, the industry is financing open-source architecture alternatives. Major semiconductor players, including Qualcomm, Google, and Western Digital, have poured substantial capital into the RISC-V ecosystem. RISC-V offers an open-standard instruction set that incurs zero royalty payments to Arm.
Every time Arm attempts to exploit its pricing power to justify a 62x sales multiple, it strengthens the economic incentive for its biggest clients to accelerate their migration to alternative architectures.
Institutional Crowding and Asymmetric Downside
Institutional ownership in Arm is exceptionally concentrated. SoftBank retains approximately 87 percent of the outstanding shares, leaving a remarkably narrow public float.
This tight float creates mechanical convexity on the way up. When passive funds, hedge funds, and tech-thematic ETFs all demand allocation to the same scarce pool of shares, prices disconnect from underlying cash flows.
The danger for institutional allocators is that float dynamics cut both ways. Any quarterly guidance print that signals a slowdown in licensing bookings or a delay in client adoption can trigger an abrupt de-rating.
When you own a company at 306x trailing earnings, you have no margin of safety. You are walking along a knife edge where even flawless operational execution only allows the stock to tread water against multiple contraction.
Institutional capital has piled into Arm under the assumption that an indispensable architecture guarantees an unbeatable investment. History suggests that when valuation completely divorces from cash generation mechanics, even the finest technology franchises can turn into painful capital traps.
Arm Holdings plc (ARM)
Trailing P/E
Marcus Wolfe Screen
Leverage Profile
30D Channel
Pristine cash flow conversion (1.69x) and healthy accrual ratio (-5.79%). Zero accounting anomalies detected (LOW ANOMALY RISK).
Fortress Balance Sheet (Net Cash Position; zero net refinancing distress).
Evaluated against 5.10% US 10-Yr Benchmark (FCF Spread: -4.55% (vs 10Y Yield of 5.10%)).
Max Pain: $260.00 (+14.14%) | P/C Ratio: 1.06 | 30D Channel: $211.47 – $244.13.
$209.58 – $218.69 (-4% to -8% Pullback Accumulation)
Sustained weekly close below $205.02 (-10.0% structural stop) or fundamental cash flow deterioration.