
The Morning Blast: Gamma Walls, Silicon Tollbooths, and Balance Sheet Gravity
If you spent the weekend hoping the macro backdrop would provide a gentle, forgiving glide path into mid-October, the bond market has other ideas. The benchmark 10-Year US Treasury yield is hovering at 5.24 percent, the US Dollar Index is pressing fresh 52-week highs at $29.08 on the UUP exchange-traded fund, and front-month crude oil has ripped past $151 a barrel. Under ordinary historical circumstances, an economy facing five-plus percent risk-free rates and hundred-fifty-dollar crude would prompt equity markets to take a polite pause.
Instead, the S&P 500 opened this morning at $779.07, sitting less than half a percent below its all-time high of $781.62.
To understand why the broader market looks completely untethered from the bond market, one cannot simply read quarterly earnings transcripts or listen to central bankers speak about data dependence. One has to look at the market plumbing: the mechanical interaction between options market maker hedging, dealer gamma books, and single-stock capital allocation.
Below is the institutional daily briefing covering cross-asset macro currents, quantitative order-book flows, a fundamental sector deep-dive into Broadcom (AVGO), and a forensic risk spotlight on Rivian Automotive (RIVN).
1. Macro Radar: The $151 Oil Spike Meets the 5.24 Percent Yield Anchor
The dominant macroeconomic tension this morning is a widening rift between nominal bond yields and equity valuation multiples.
The 10-Year Treasury yield (^TNX) sits at 5.24 percent, while the long bond (TLT) trades near its 52-week low at $77.87. High-yield corporate credit (HYG) has drifted to $77.20, pricing in negligible default risk despite borrowing rates remaining at multi-decade highs. Meanwhile, the CBOE Volatility Index (^VIX) nudged up 3.84 percent to 15.41, a level that signals mild caution but remains historically subdued given the macro cross-currents.
The real wildcard is commodities. Crude oil (USO) surged 2.34 percent to $151.74, trading near the top of its 52-week range ($65.99 to $163.35). In a late-cycle economy, sustained energy prices at this altitude operate as a regressive consumer tax and an input-cost shock for industrial supply chains.
Yet sector valuations reflect striking complacency:
* Technology (XLK) commands a trailing price-to-earnings multiple of 32.34x.
* Healthcare (XLV) trades at 30.54x earnings.
* Industrials (XLI) sit at 27.82x earnings.
* Energy (XLE), despite the crude rally, trades at just 18.86x earnings with a 2.48 percent dividend yield.
* Financials (XLF) remain the relative value anchor at 15.70x earnings.
The arithmetic of a 5.24 percent risk-free rate suggests that equity risk premiums should be demanding higher earnings yields. Instead, passive liquidity inflows and systematic options positioning continue to hold the index together.
2. Quantitative Flow & Market Structure: The $780 Gamma Pin
The stability of the S&P 500 at $779.07 is not an accident of corporate sentiment. It is a direct consequence of options market structure.
Options dealers and market makers are currently sitting in a deep positive gamma regime above the $775 strike. When market makers are net long gamma, their delta-hedging mandates require them to act counter-cyclically: when the index rises toward $780, they sell underlying futures to hedge their long calls; when the index dips toward $776, they buy futures to cover their deltas. This mechanical behavior effectively dampens realized volatility, compressing the VIX into the mid-15s and creating a synthetic magnet around strike clusters.
Right now, that magnet is the massive $780 Call Wall on SPY. Open interest on the $780 call strike represents the single largest concentration of dealer gamma on the board today. Unless an external macro catalyst delivers enough force to overcome dealer selling, the index is mechanically pinned.
However, the order book is asymmetric:
* The Upper Barrier: At $780 to $782, heavy call open interest creates a ceiling where dealer profit-taking and hedging supply cap immediate upside momentum.
* The Volatility Flip Line: The key structural pivot sits at $775. If selling pressure forces SPY below $775, dealer positioning flips from positive gamma to negative gamma. In negative gamma territory, dealers must hedge in the direction of the trend, selling into dips and buying into rallies.
* The Liquidity Void: A break below $775 would trigger rapid unpinning, opening an air pocket straight down to secondary put support at $770.
While headline volatility remains calm, out-of-the-money put skew is steepening quietly. Institutional desks are not selling their underlying equity positions; they are paying up for downside tail insurance while harvesting premium against the $780 pin.
3. Sector Deep-Dive: Broadcom (AVGO) and the Custom Silicon Tollbooth
While broader tech (QQQ) slipped 0.45 percent this morning to $747.87, Broadcom Inc. (AVGO) presents a compelling case study in structural market power.
Trading at $358.10 with a market capitalization of $1.71 trillion and an enterprise value of $1.76 trillion, Broadcom has evolved far beyond a traditional semiconductor cyclical. It has transformed into an institutional tollbooth on enterprise cloud architecture and hyperscaler artificial intelligence clusters.
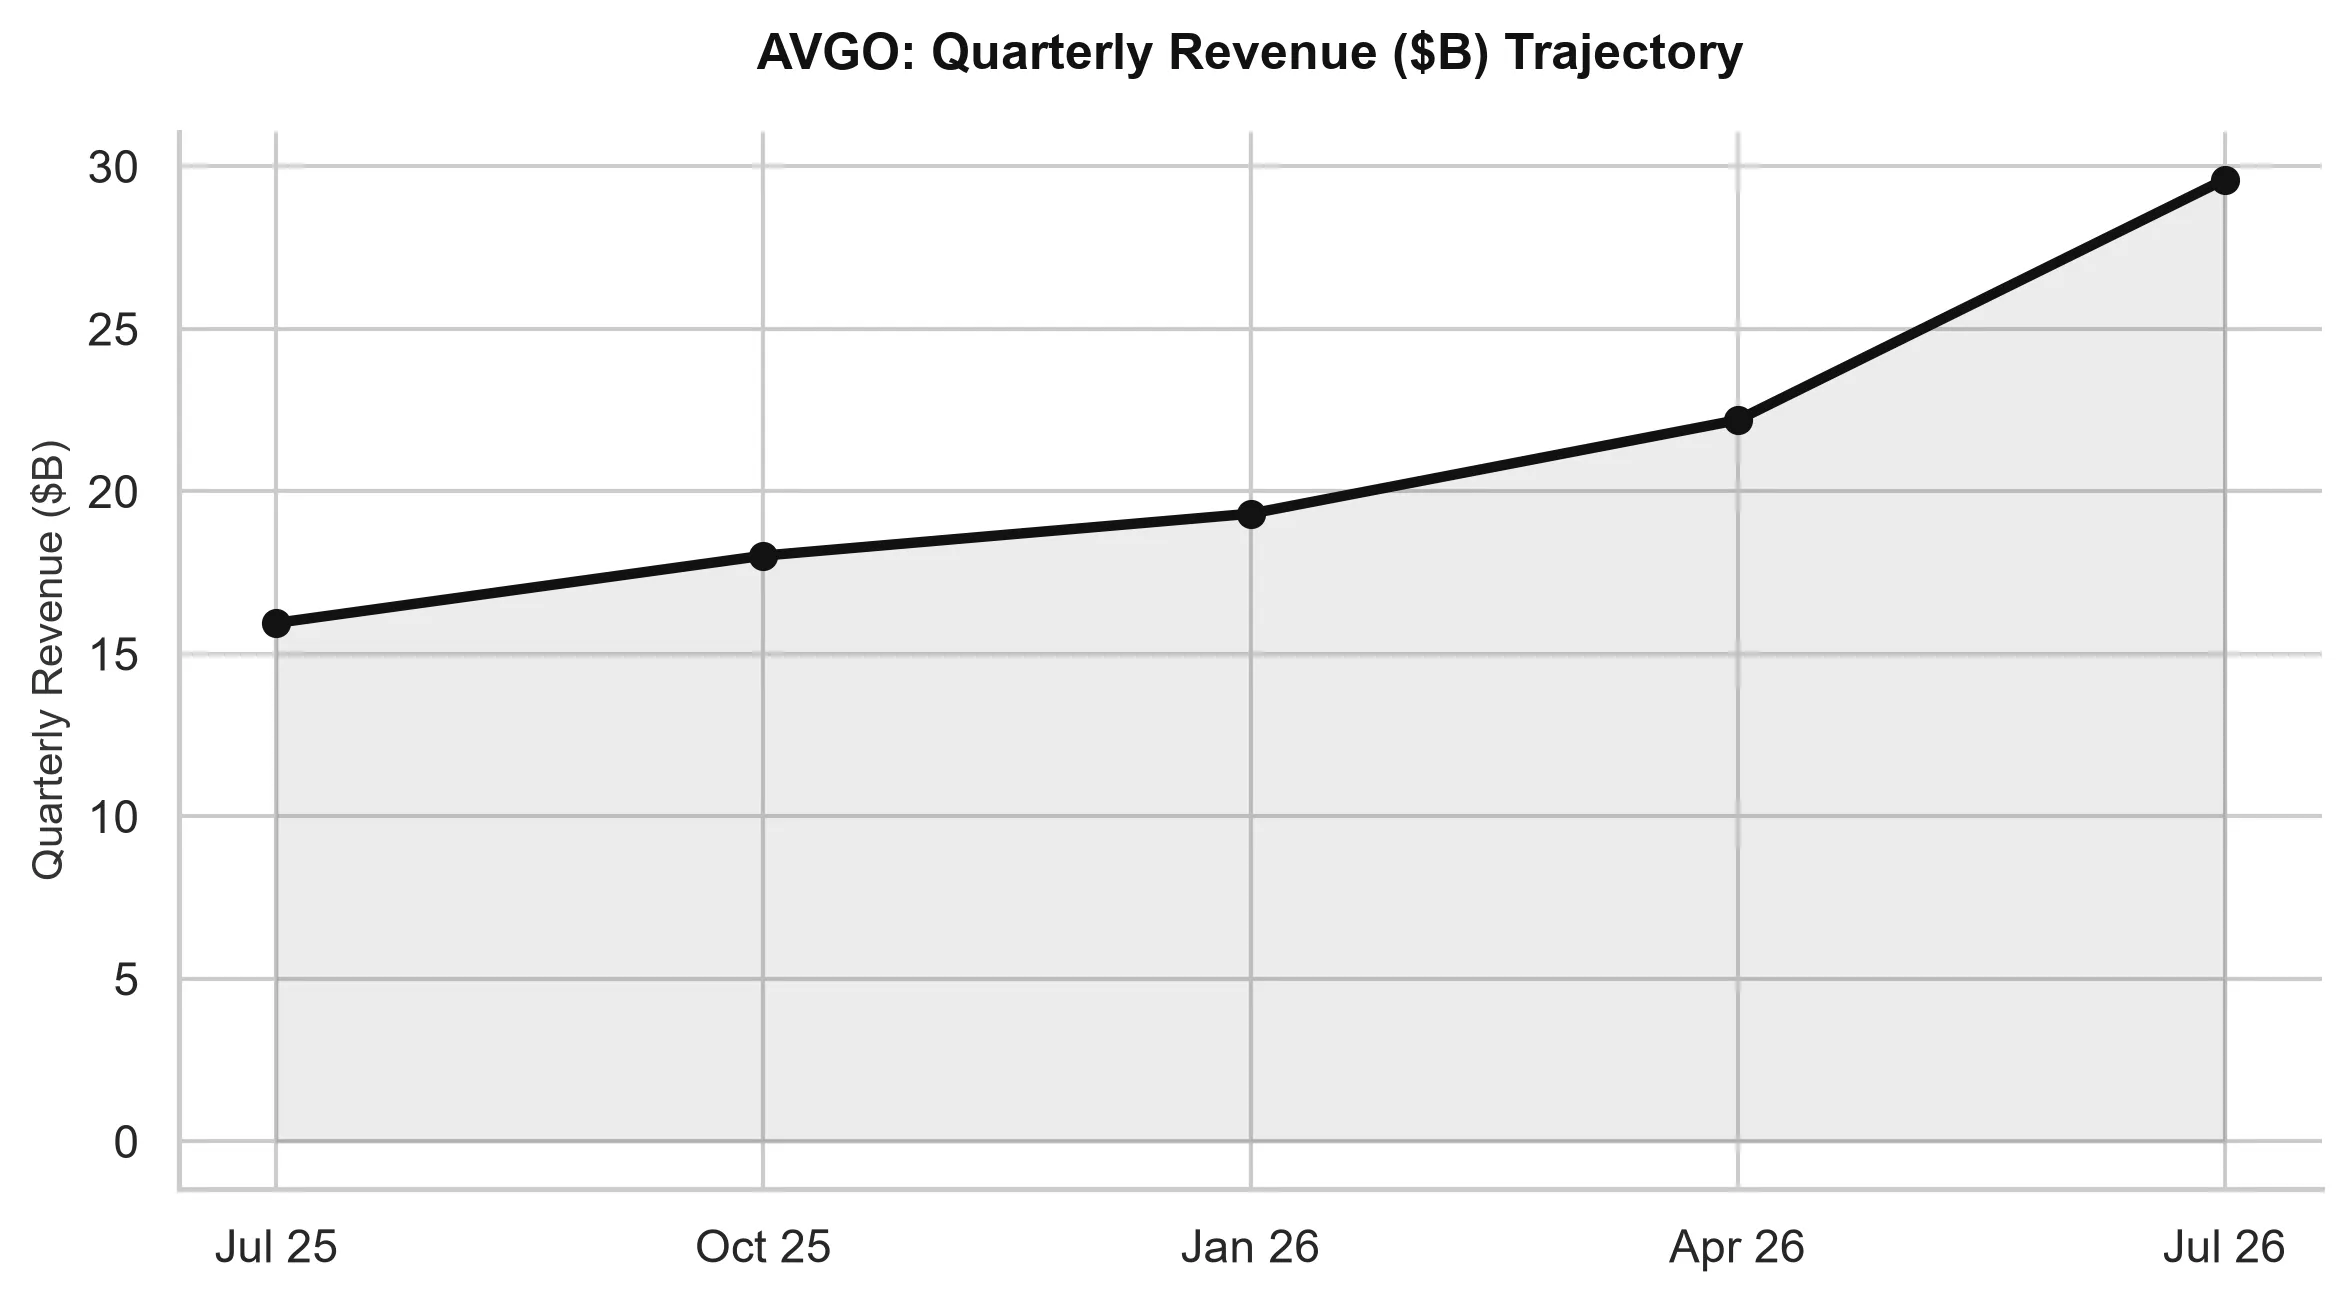
The Hard Financial Arithmetic
Deterministic financial metrics extracted from official filings illustrate the sheer operating leverage Broadcom commands:
* Valuation Multiple: Trailing P/E sits at 45.73x, but Forward P/E drops sharply to 18.46x. Its price-to-earnings-to-growth (PEG) ratio registers at an exceptionally low 0.36, driven by forward earnings expansion.
* Top-Line Expansion: Total revenue reached $89.10 billion, reflecting year-over-year revenue growth of 85.50 percent. This acceleration reflects both organic demand for AI networking silicon (Tomahawk 5 and Jericho3-AI switches) and the full integration of VMware into high-margin enterprise software licenses.
* Profitability Profile: Gross margins stand at 75.52 percent, operating margins at 54.31 percent, and net profit margins at 42.94 percent. Return on equity is 44.25 percent.
* Cash Flow Dominance: Net income of $38.26 billion converted into $30.60 billion in free cash flow, representing a cash conversion rate rarely seen among mega-cap hardware manufacturers.
* Balance Sheet Health: Broadcom holds $23.98 billion in cash against $59.42 billion in total debt. While debt appears elevated on an absolute basis following the VMware acquisition, its annual free cash flow generation of $30.60 billion means net debt could be extinguished in roughly 14 months if management halted capital returns.
In an environment where borrowing costs remain north of 5 percent, companies that finance their own growth from internal free cash flow trade at a structural premium. Broadcom is not waiting for capital markets to subsidize its product roadmap; it is funding hyperscaler data center buildouts out of existing operating profits.
4. Forensic Risk Spotlight: Rivian Automotive (RIVN) and the 5.24 Percent Capital Wall
On the opposite end of the capital spectrum sits Rivian Automotive, Inc. (RIVN).
Our Layer 3 forensic screening tool flagged Rivian with an Elevated Concern rating. While the consumer narrative celebrates its electric adventure vehicles and technological partnerships, the forensic mechanics tell a far more austere story.
The Forensic Anomaly Breakdown
- Persistent Cash Flow Divergence: Over its latest annual period, Rivian generated a GAAP net loss of $3.23 billion (with trailing reported annual net income at negative $3.65 billion). Operating cash flow was negative $779 million, and free cash flow sat at negative $1.54 billion.
- Accrual Distortions: Total accruals reached negative $2.87 billion, producing an accrual-to-assets ratio of negative 19.29 percent. When net income and cash flow remain deeply negative over multi-year horizons, the quality of balance sheet carrying values comes under intense scrutiny.
- Working Capital Warning: The screening engine triggered a formal red flag on working capital dynamics. Accounts receivable growth exceeded revenue growth by more than 15 percentage points. In capital-intensive manufacturing, a situation where receivables outgrow top-line sales suggests extended customer payment terms or channel friction.
- Operating Margins Under Severe Water: Rivian’s gross margin is a modest 7.51 percent, while operating margins sit at negative 50.42 percent and net margins at negative 54.95 percent.
- The Cash Runaway Math: Rivian holds $5.31 billion in total cash against $5.35 billion in total debt (and $6.65 billion in total balance sheet obligations). In net terms, its cash cushion has evaporated to roughly zero.
When risk-free capital yielded zero percent, an unprofitable electric vehicle manufacturer burning $1.5 billion in annual free cash could easily tap convertible debt markets or issue secondary equity without severe friction. In a 5.24 percent Treasury world, interest expense becomes a punitive drain, and equity dilution directly impairs common shareholders. Unless the Volkswagen joint venture delivers non-dilutive liquidity ahead of schedule, Rivian faces a rigorous cost-of-capital reckoning over the next 12 to 18 months.
5. Synthesis & Portfolio Allocation Strategy
Today’s market presents a sharp bifurcation between companies that produce liquidity and companies that consume it.
- Macro Hedging: With crude oil trading above $151 and the 10-Year yield at 5.24 percent, cyclical inflation risks are not fully priced into tech multiples. Trimming consumer discretionary exposure with negative cash margins is prudent.
- Quant Flow Exploitation: Treat the $780 level on SPY as a mechanical ceiling for short-term long exposure. Look for range-bound trading between $776 and $780 until dealer gamma decays, with a stop placed below the $775 gamma flip point.
- Fundamental Quality: Allocate capital toward high-margin cash generators like Broadcom (AVGO), where custom silicon demand and VMware recurring cash flows insulate the business from debt refinancing headwinds.
- Forensic Caution: Avoid capital-bleeding growth equities like Rivian (RIVN) that face structural working capital divergence and near-zero net cash buffers in an elevated rate regime.
📊 AllWallSt Investment Verdict
| Company / Ticker | Rating | Word/Horizon |
|---|---|---|
| Broadcom Inc. (AVGO) | BUY | 12–18 Months |
| Rivian Automotive, Inc. (RIVN) | SELL | 12–18 Months |
Conviction rating derived deterministically from Layer 3 metrics, options flow, and fundamental review.
Sources & References
- Federal Reserve Economic Data (FRED): 10-Year Treasury Constant Maturity Yield
- CBOE Global Markets: CBOE Volatility Index and SPY Options Structure
- Broadcom Inc. Investor Relations: Quarterly Earnings and SEC EDGAR Filings
- Rivian Automotive, Inc. Investor Relations: Financial Results and SEC EDGAR Filings
- U.S. Securities and Exchange Commission: SEC EDGAR System
Regulatory Disclaimer: This editorial packet is provided for institutional informational and educational purposes only and does not constitute financial, investment, legal, or tax advice. Market commentary and conviction ratings are derived from quantitative models, options market structure analytics, and publicly available regulatory filings. Investors must conduct independent due diligence before making capital allocation decisions.