
The $132 Billion CapEx Dislocation: Inside the Hyperscaler Cash Mirage
There is a polite fiction at the heart of the current equity market, and it goes something like this: large technology companies are cash-printing machines that can effortlessly fund the next industrial revolution without asking anyone for permission or a discount.
If you look at the headline income statements, the story appears airtight. Over the past twelve months, Amazon.com, Inc. generated $775.68 billion in top-line revenue and reported $135.28 billion in GAAP net income. Those are staggering sums. In a world of financial abstractions, $135 billion of accounting profit sounds like an impenetrable fortress.
Then you look at the cash flow statement, and the fortress starts to look surprisingly porous.
After accounting for capital expenditures, software capitalization, and the physical machinery required to build modern artificial intelligence clusters, Amazon delivered just $3.22 billion in free cash flow over the trailing period.
On a market capitalization of $2.81 trillion, that represents a free cash flow yield of roughly 0.11 percent.
Now, consider the macroeconomic backdrop. The benchmark 10-Year US Treasury yield is pinned at 5.24 percent. The US Dollar Index has broken out to fresh 52-week highs at $29.095 on the UUP exchange-traded fund. Front-month crude oil is trading at $151.61 a barrel, up another 2.30 percent this morning.
In a world where risk-free US sovereign debt pays 5.24 percent in cash, institutional investors are paying 2.8 trillion dollars for an equity asset yielding eleven basis points of distributable cash flow.
This is the great hyperscaler macro dislocation, and it is quietly reshaping the risk architecture of Wall Street.
1. The Macro Radar: The Cost of Capital Has Returned
For nearly fifteen years following the 2008 financial crisis, capital allocation had no hurdle rate. When the Federal Reserve held rates at zero and real yields were negative, the present value of distant cash flows was mathematically infinite. In that regime, spending $100 billion today to capture theoretical platform dominance twenty years from now was not just defensible; it was actively rewarded by equity analysts.
Today, nominal yields are telling a very different story:
* The 10-Year Treasury (^TNX) trades at 5.24 percent, while 20-plus year sovereign bonds (TLT) sit depressed at $78.03, within striking distance of their 52-week lows.
* Corporate credit spreads remain eerily compressed (HYG at $77.26), signaling that bond markets are pricing in zero refinancing friction despite the highest base rates since 2007.
* Equity sectors remain starkly divided. Technology (XLK) commands a trailing price-to-earnings multiple of 32.17x, and Healthcare (XLV) trades at 30.62x. Meanwhile, the Energy sector (XLE), enjoying $151 crude, trades at just 18.81x earnings, and Financials (XLF) sit at 15.68x.
When risk-free capital yields over 5 percent, every corporate dollar spent on infrastructure must clear a hurdle rate. You cannot merely promise that a data center will be very cool or that an artificial intelligence model will write poems about quarterly earnings. You have to generate enough excess economic return to beat a Treasury bill.
2. Anatomy of the $132 Billion Cash Drain
To see how $135 billion of GAAP net income shrinks into $3.2 billion of free cash flow, one must examine the physical reality of modern cloud computing.
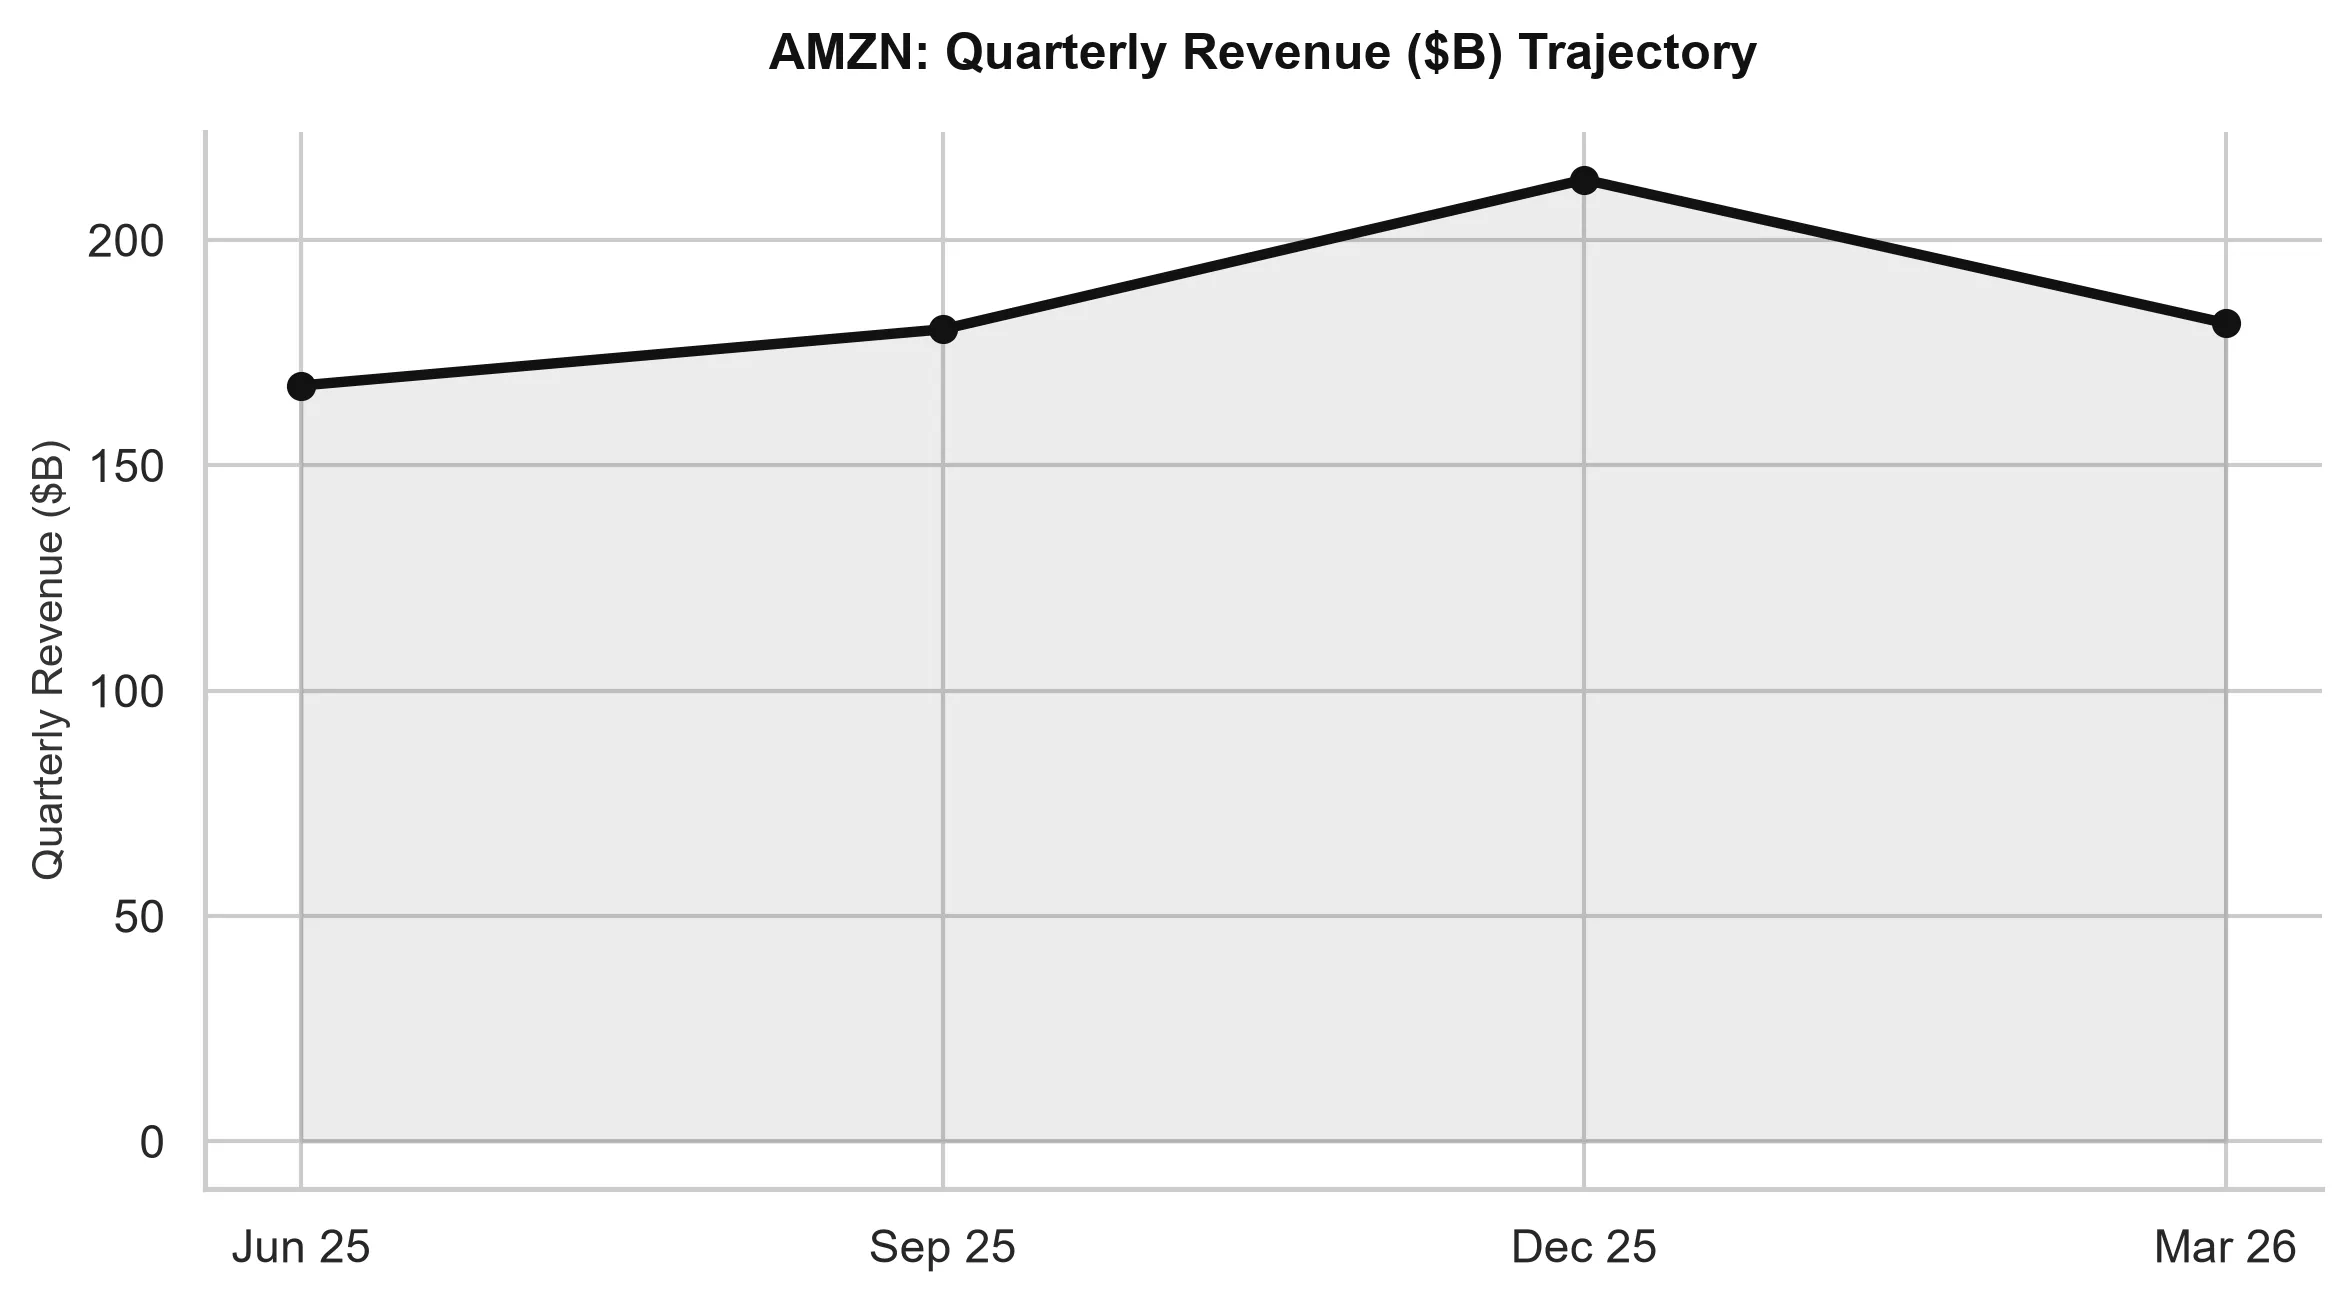
Amazon operates an extraordinary cash machine at the operational level. Trailing operating cash flow reached $139.51 billion. That is real cash generated from customers buying laundry detergent on Prime and enterprise CIOs renting compute cycles on Amazon Web Services (AWS).
However, the capital required to sustain that machine has reached industrial scale:
* Operating Cash Flow: $139.51 billion.
* Capital Expenditures & Asset Investments: Approximately $136.29 billion.
* Residual Free Cash Flow: $3.22 billion.
Where did $136 billion go? It went into high-voltage electrical substations, liquid-cooled server racks, custom Trainium2 silicon wafers, fiber-optic interconnects, robotic distribution fulfillment centers, and low-Earth-orbit satellites.
In accounting terms, this expenditure does not hit the income statement immediately. Instead, accountants capitalize the cost on the balance sheet and depreciate it smoothly over three to seven years. That is why GAAP net income looks glorious at $135.28 billion. But cash does not care about depreciation schedules. Cash leaves the corporate bank account the moment the concrete is poured and the Nvidia GPUs are plugged in.
3. The Balance Sheet Leverage Equation
Because free cash flow has compressed to nominal levels, Amazon cannot fund this infrastructure binge solely out of retained cash generation without touching its balance sheet.
audited balance sheet metrics reveal the underlying structure:
* Total Cash & Short-Term Equivalents: $122.99 billion.
* Total Balance Sheet Debt: $251.64 billion.
* Net Debt Position: Negative $128.65 billion.
* Enterprise Value: $2.96 trillion.
Amazon is not in financial distress. It is a dominant global enterprise with pristine credit market access. But it is carrying over $250 billion in total debt obligations in a macroeconomic regime where rolling over corporate paper costs 6 to 7 percent rather than 2 percent.
If Amazon were generating $80 billion in free cash flow, a $250 billion debt load would represent roughly three years of cash generation. But at $3.22 billion in free cash flow, the cash generation does not service the debt; it barely covers maintenance capital requirements.
4. The Valuation Asymmetry: The 5.24% Benchmark Test
Let us run a simple institutional thought experiment.
Suppose an institutional asset manager has $1 billion of capital to allocate today:
- Option A (US Sovereign Risk-Free): Purchase a 10-Year US Treasury bond yielding 5.24 percent. The investor receives $52.4 million in cash every year, guaranteed by the taxing power of the United States government. At maturity, the $1 billion principal is returned.
- Option B (Amazon Equity): Purchase $1 billion worth of Amazon stock at $260.62 per share. The underlying business delivers approximately $1.1 million in pro-rata free cash flow this year (a 0.11 percent cash yield).
To justify Option B, the investor must believe that Amazon’s cloud and artificial intelligence investments will generate such astronomical incremental cash flows in 2028 and 2030 that the compounded cash yield will far exceed 5.24 percent plus an equity risk premium.
That is entirely possible. But it requires ignoring three material macro risks:
* The Energy Constraint: With crude oil at $151.61 and regional electricity grids facing severe generation shortfalls, the cost per megawatt-hour for data centers is escalating rapidly. Power purchase agreements are becoming more expensive, compressing cloud margins.
* Depreciation Drag: All those server racks and custom chips being purchased today have useful economic lives of four to five years. When the depreciation expense finally catches up to the income statement over the next 24 to 36 months, reported GAAP margins will face severe mechanical downward pressure.
* Monetization Velocity: Enterprises are eagerly experimenting with generative artificial intelligence, but enterprise software budgets are not infinite. If software monetization lags hardware buildout, the return on invested capital will deteriorate.
5. Strategic Conclusion & Capital Allocation Verdict
The market is currently pricing hyperscalers as if cost-of-capital does not exist. It treats heavy capital expenditure as an unalloyed positive, celebrating every announcement of a multi-billion-dollar data center cluster as proof of visionary leadership.
In a 5.24 percent yield world, capital expenditure is not a trophy; it is a cost. When an enterprise trades at a 2.8 trillion dollar valuation while producing negligible distributable cash flow, the margin of safety for equity holders becomes razor-thin.
Institutional allocators should recognize that while Amazon remains an elite operational franchise, the current multiple leaves zero room for execution hiccups or cloud margin compression. A neutral stance, waiting for free cash flow generation to re-converge with GAAP net income, is the disciplined institutional path.
Amazon.com, Inc. (AMZN)
Trailing P/E
Marcus Wolfe Screen
Leverage Profile
30D Channel
Pristine cash flow conversion (1.80x) and healthy accrual ratio (-7.56%). Zero accounting anomalies detected (LOW ANOMALY RISK).
Manageable liability structure relative to institutional cash flow.
Evaluated against 5.10% US 10-Yr Benchmark (FCF Spread: -4.98% (vs 10Y Yield of 5.10%)).
Max Pain: $252.50 (+1.00%) | P/C Ratio: 0.45 | 30D Channel: $232.08 – $267.92.
$230.00 – $240.00 (-4% to -8% Pullback Accumulation)
Sustained weekly close below $225.00 (-10.0% structural stop) or fundamental cash flow deterioration.