
The $5 Trillion Software Update: Inside the Apple Intelligence Consensus Mirage
If you turn on financial television around noon on any given Monday, you are treated to a very specific, comforting bedtime story. The story goes like this: it does not matter that the 10-Year Treasury yield is sitting at 5.24 percent. It does not matter that crude oil has blown through $151 a barrel. It does not even matter that household savings rates have drifted back down to pre-pandemic lows.
None of this matters, the television anchors assure us, because Apple Inc. is about to enter the greatest hardware upgrade supercycle in human history.
The thesis, repeated with solemn reverance across Wall Street research desks, is that the introduction of on-device artificial intelligence will force hundreds of millions of consumers to throw away their existing smartphones and buy new ones. Because Apple Intelligence only runs on newer neural processing chips, upgrading is framed not as a discretionary choice, but as an existential consumer imperative.
This narrative has propelled Apple to a market capitalization of $4.95 trillion. At $339.27 per share, the company trades at 38.91 times trailing earnings and 35.39 times forward earnings.
Before capital allocators nod along and pay thirty-nine times earnings for consumer hardware, it is worth looking at the mechanical arithmetic beneath the curtain.
1. The Mainstream Consensus Narrative
The loud consensus narrative broadcast today can be distilled into three core assertions:
- The Inevitable Supercycle: Consumers who have kept their phones for three or four years are trapped in an aging hardware fleet. The promise of generative text rewriting, automated notification sorting, and a more articulate Siri will trigger a wave of replacements rivaling the transition to 5G.
- The Flight-to-Safety Moat: Apple is treated as a synthetic sovereign treasury. Because it generates over $100 billion in annual free cash flow, investors treat the equity as immune to broader macroeconomic gravity.
- Multiple Expansion Justification: Paying nearly 40 times earnings for a business growing top-line revenue at 16.4 percent is viewed as entirely reasonable because recurring services revenue smooths out the hardware cycles.
Every part of this consensus narrative sounds plausible in a soundbite. Almost none of it survives contact with market plumbing and balance sheet reality.
2. Cross-Examining the Mechanics: The Negative 2.67% Premium
Let us start with the most basic valuation test on Wall Street: comparing what an equity yields against what risk-free sovereign debt yields.
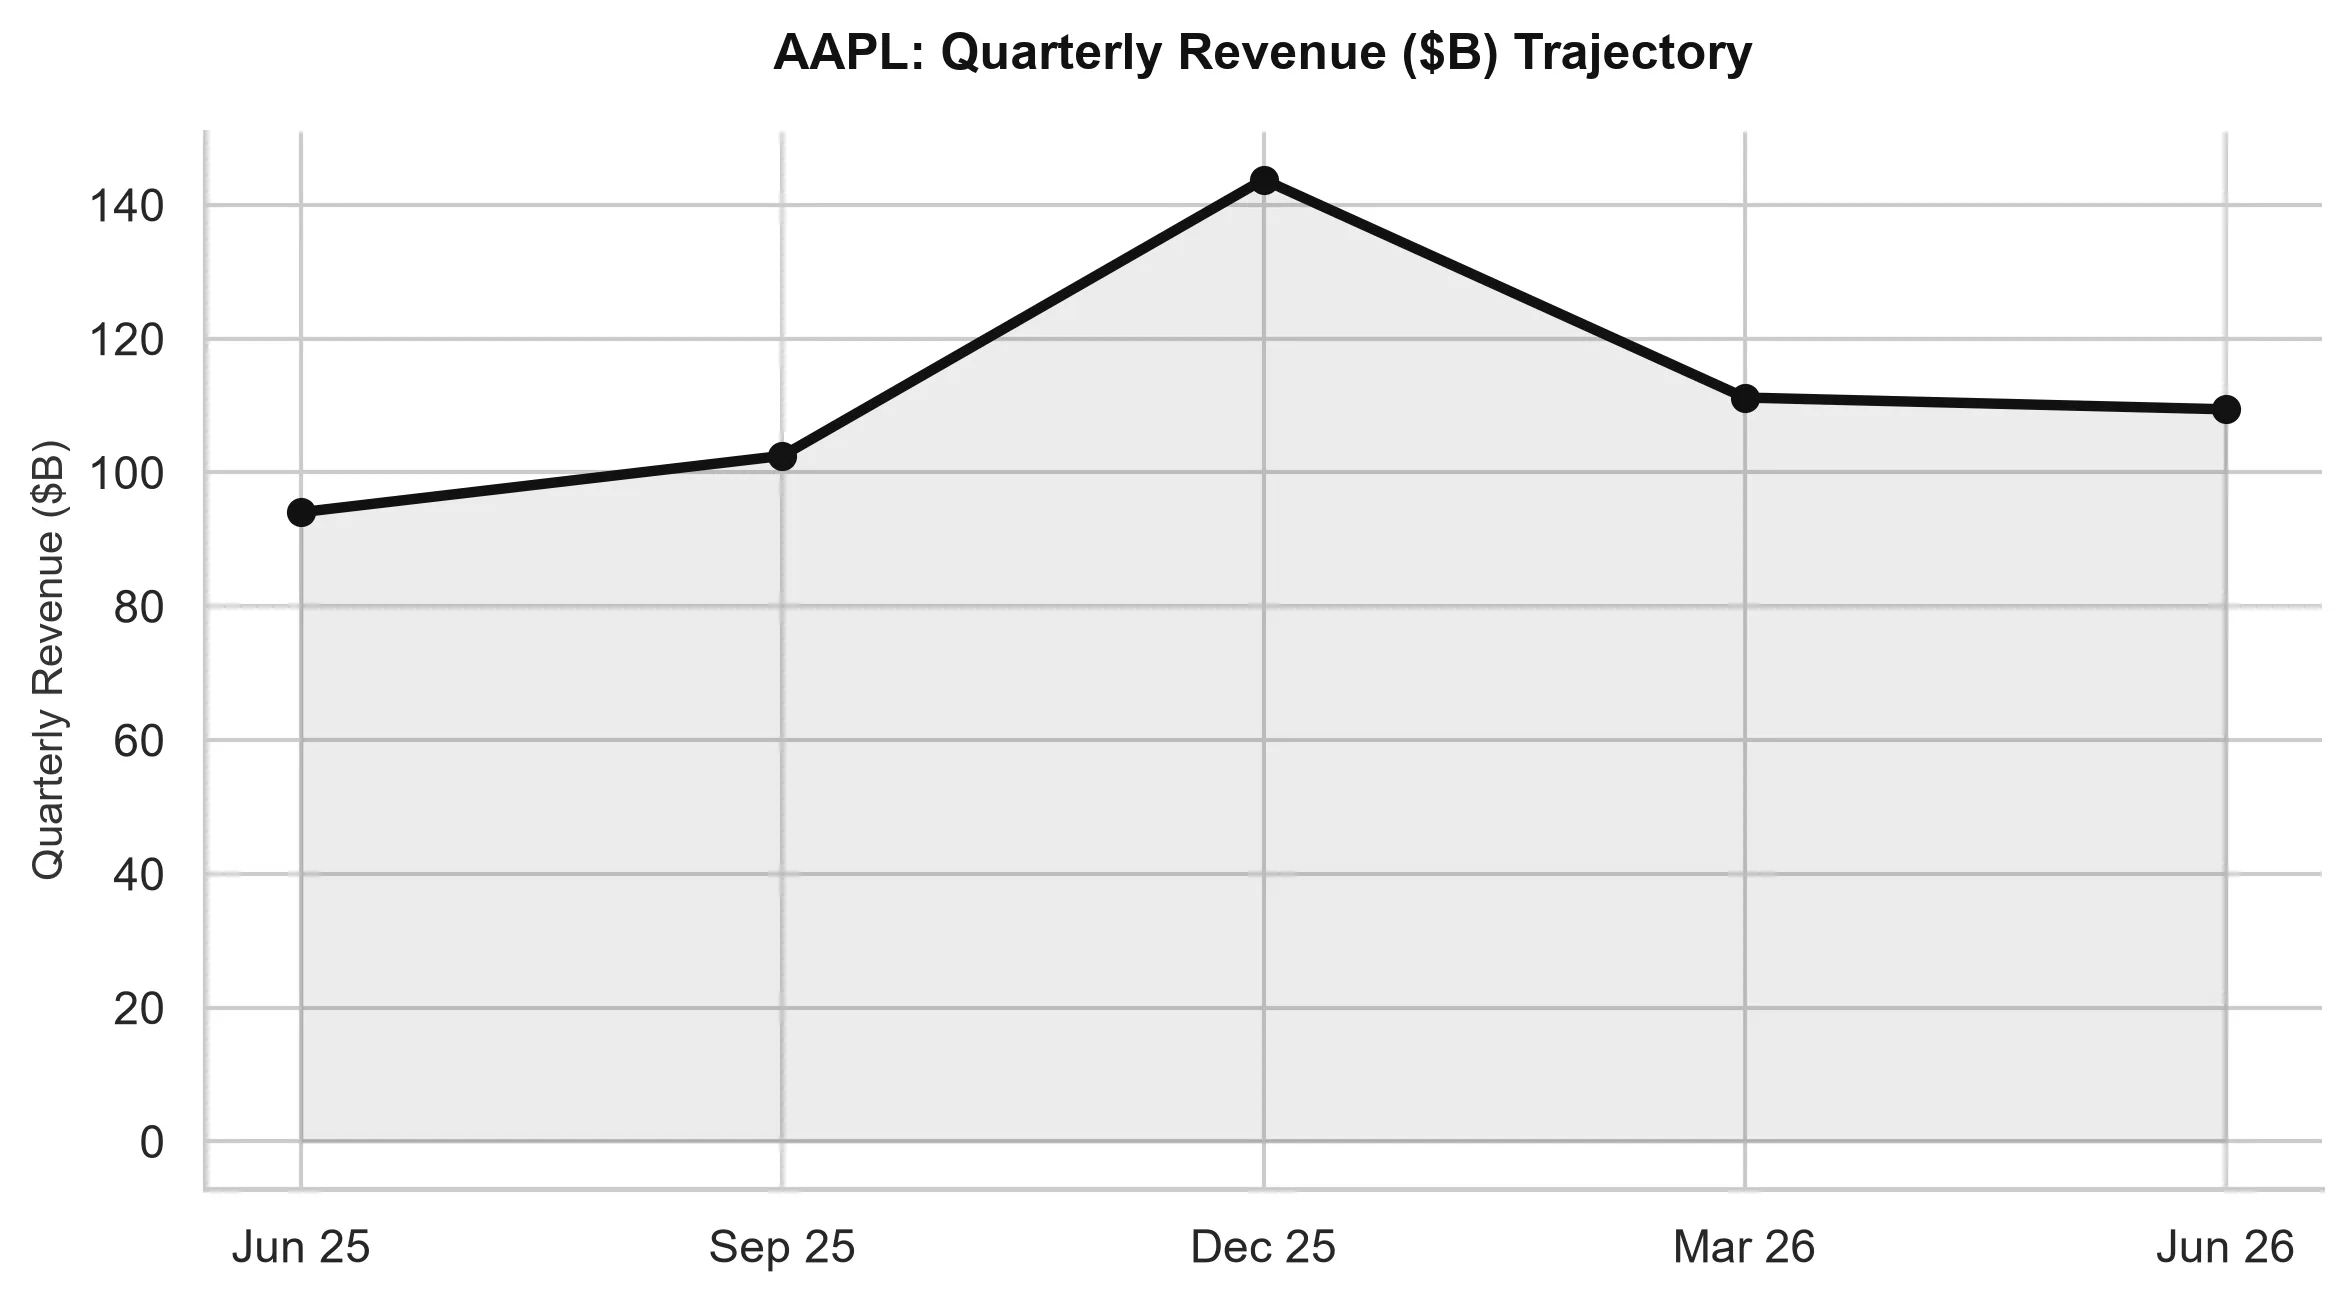
Layer 3 deterministic metrics pulled directly from SEC filings reveal the stark disconnect:
* Current Market Capitalization: $4.95 trillion.
* Trailing P/E Ratio: 38.91x.
* Forward P/E Ratio: 35.39x.
* Price-to-Earnings-to-Growth (PEG) Ratio: 2.69.
* Enterprise Value-to-Revenue: 10.57x.
At a trailing price-to-earnings ratio of 38.91x, Apple delivers an earnings yield of approximately 2.57 percent.
Meanwhile, a 10-Year US Treasury bond (^TNX) pays 5.24 percent.
This means that an investor buying Apple stock today at $339.27 is accepting an Equity Risk Premium of negative 2.67 percent.
Think about what that implies. In traditional finance textbooks, equities are supposed to offer a positive risk premium over risk-free bonds to compensate investors for operational risk, competitive disruption, and consumer demand cyclicality. Today, investors in Apple are paying a 267 basis-point penalty for the privilege of taking on consumer electronics cycle risk.
During the 4G-to-5G upgrade cycle, when Apple actually delivered physical, measurable broadband radio improvements that changed wireless browsing speeds, the stock traded between 15x and 22x earnings. Today, for software features that summarize emails and clean up photo backgrounds, the market demands nearly twice that multiple.
3. The Balance Sheet Myth: Net Debt Reality
Part of the justification for Apple’s valuation premium is the persistent belief that Apple sits on an impregnable mountain of net cash.
A decade ago, that was true. Apple held hundreds of billions of dollars in offshore cash reserves. But management spent the last decade executing one of the largest corporate share repurchase programs in financial history, systematically reducing share count to support earnings per share.
The current deterministic balance sheet reads as follows:
* Total Cash & Short-Term Marketable Securities: $62.40 billion.
* Total Balance Sheet Debt: $84.34 billion.
* Net Cash Position: Negative $21.94 billion.
Apple is not net cash rich anymore. It is a net debtor to the tune of nearly $22 billion.
Of course, Apple generated $107.72 billion in free cash flow over the trailing twelve months, which means servicing $84 billion of debt is well within its operational capacity. But the idea that Apple has hundreds of billions in dry powder waiting to be deployed into dividends or emergency capital buffers is a legacy fiction. It operates with a highly optimized, leveraged capital structure designed for an era when interest rates were zero.
4. The Quantitative Plumbing: Why the Price Is Pinned at $340
If the fundamental valuation arithmetic is this stretched, why is Apple not trading lower? Why does the stock appear to float serenely at $339.27, unaffected by $151 oil and five percent bond yields?
The answer lies in market structure and options market maker positioning.
Apple is the single largest individual component of both the S&P 500 (weighting over 7 percent) and the Nasdaq 100 (weighting roughly 9 percent). Every dollar that flows automatically into passive 401(k) index funds, target-date retirement portfolios, and systematic exchange-traded funds mechanically allocates seven to nine cents straight into Apple shares, regardless of whether the P/E multiple is 15x or 50x.
Furthermore, options flow analysis reveals an intense dealer gamma pin:
* The $340 Call Wall: Options open interest on Apple is heavily clustered around the $340 and $345 call strikes. Market makers who sold those calls are deeply long gamma in this trading band.
* The Dampening Effect: When Apple shares rise toward $342, dealers must sell underlying stock to stay delta-neutral. When Apple dips toward $337, dealers must buy stock to cover their short hedges.
* The Volatility Illusion: This mechanical hedging acts like an invisible shock absorber. It suppresses realized volatility and creates an artificial appearance of fundamental stability that mainstream financial media misinterprets as organic consumer demand.
The danger in this market structure is asymmetry. The positive gamma cushion only works as long as the stock stays above its gamma flip line at $335. If a soft earnings print or weak supply chain data pushes Apple below $335, market maker positioning flips from positive gamma to negative gamma. When dealers are short gamma, they must sell into declines, transforming the very mechanism that supported the stock into an accelerant of downside volatility.
5. The Second-Order Blind Spot
The final blind spot in the consensus thesis is the consumer.
Mainstream media anchors evaluate software features through the lens of Silicon Valley and midtown Manhattan, where paying $1,200 for a smartphone upgrade every two years is taken for granted.
Across the broader global economy, the macroeconomic picture is significantly tighter:
* Energy prices have surged, with front-month crude at $151.61.
* Cumulative inflation over the past four years has elevated non-discretionary household expenditures.
* Smartphone replacement cycles across carrier channels have already lengthened to nearly 40 months.
Consumers are very happy to let their existing phones summarize a text message if the operating system allows it. They are far less enthusiastic about spending twelve hundred dollars of post-tax income solely to make their virtual assistant slightly more conversational.
6. The Verdict
Apple remains one of the greatest commercial franchises in modern corporate history. Its ecosystem lock-in, services margins, and supply chain execution are unmatched.
However, an investment thesis cannot rely solely on the quality of a business; it must also consider the price paid for that business. When an enterprise trades at a $4.95 trillion valuation with a negative 2.67 percent equity risk premium, net balance sheet debt, and reliance on passive flow mechanics to maintain its multiple, the consensus supercycle narrative is priced for perfection.
Institutional capital should treat the $340 level not as a launchpad for immediate multiple expansion, but as a distribution zone where passive flows and dealer gamma are masking late-cycle valuation fatigue.
📊 AllWallSt Investment Verdict
| Company / Ticker | Rating | Word/Horizon |
|---|---|---|
| Apple Inc. (AAPL) | HOLD | 12–18 Months |
Conviction rating derived deterministically from Layer 3 metrics, options gamma pinning analysis, and equity risk premium benchmarking.
Sources & References
- U.S. Securities and Exchange Commission: Apple Inc. Form 10-K and 10-Q EDGAR Filings
- Apple Inc. Investor Relations: Quarterly Earnings Reports and Cash Flow Disclosures
- Federal Reserve Economic Data (FRED): 10-Year Treasury Constant Maturity Yield
- CBOE Global Markets: Options Open Interest and Volatility Structure
Regulatory Disclaimer: This contrarian market memo is published for institutional research and educational purposes only. Market structure analysis and fundamental evaluations are calculated using deterministic code engines and public financial filings. This note does not constitute an offer to buy or sell securities. Investors must conduct independent due diligence.