
There is something deeply comforting about a giant bank. You give them your money, they pay you an insulting fraction of a percent in interest, they lend it out to someone else at a much higher rate, and the spread pays for marble lobbies and executive jet leases. It is the oldest business model in capitalism, save for one or two others that we do not discuss in polite company.
Bank of America is the platonic ideal of this arrangement. It is massive, it is ubiquitous, and it sits at the intersection of traditional commercial lending and modern capital markets plumbing. Yet, if you look at the options board and the order books right now, you would think BAC is not a multi-trillion-dollar balance sheet juggernaut, but rather a digital token being aggressively discussed in a Discord channel at three in the morning.
Let us look at the structural plumbing. Markets do not move purely because some fundamental analyst wakes up, drinks three espressos, and decides that a 12.5 trailing P/E multiple is morally objectionable. They move because options market makers, passive ETF rebalancing engines, and dealer gamma exposures are trapped in a high-stakes game of financial physics.
The Mechanics of Dealer Hedging
To understand why BAC is hovering right where it is, you have to look at the options market. When retail and institutional investors pile into short-dated calls and puts, options dealers take the other side of the trade. To remain delta-neutral, these dealers must dynamically hedge by buying or selling the underlying stock.
When open interest is heavily concentrated around specific strike prices, a phenomenon known as a gamma pin occurs. If dealers are short gamma, meaning they sold options that force them to buy when the stock goes up and sell when it goes down, volatility is suppressed and price action gets sucked toward the strike like a satellite entering orbit.
With BAC trading around $54.18, the options surface reveals a massive concentration of open interest that is currently acting as a structural anchor. The market cap sits at a hefty $378.83 billion, backed by $113.93 billion in total revenue and a net income of $32.12 billion. These are not the numbers of a speculative growth darling. These are the numbers of a cash-generating leviathan. Yet, the intraday tick is being dictated less by the loan loss provision outlook and more by the fact that options desks are constantly rebalancing their delta hedges to avoid getting blown up by a sudden five percent move.
Balance Sheet Gymnastics and Valuation Realities
Let us look at the fundamental inputs while the options dealers are busy keeping the stock pinned. BAC is currently trading at a trailing P/E of 12.51 and a forward P/E of 10.34. Its PEG ratio stands at 0.86, which in normal times would make value investors salivate, or at least nod approvingly while adjusting their reading glasses.
Furthermore, the operating margin is a robust 38.30%, and the net profit margin sits comfortably at 29.52%. Total cash reported on the balance sheet is a staggering $868.14 billion, weighed against total debt of $788.98 billion. In banking, of course, debt and cash are the raw inventory of the trade, not necessarily signs of impending corporate insolvency. Deposits come in, loans go out, and the Fed sets the price of money.
When you plug these numbers into a traditional discounted cash flow model, you get a business that is aggressively cheap relative to the broader S&P 500, where the benchmark trades at elevated multiples. Yet, the stock refuses to break out decisively because the passive and derivatives overlay acts as a wet blanket on momentum.
The Institutional Takeaway
If you are a fundamental long-term investor, options gamma is just noise. It is market structure static that you can safely ignore while you collect the dividend and wait for the macro environment to sort out net interest margins.
If you are a short-term trader, however, ignoring the gamma pin is financial suicide. The options market is currently dictating the speed limit for BAC. Until open interest rolls over or a major macro catalyst blows through the current strike concentration, the stock is going to behave less like an equity and more like a pendulum anchored by dealer hedging flows.
Capital allocation here depends entirely on your time horizon. If you have a multi-year view, buying a cash-generative bank at 10x forward earnings with a sub-1.0 PEG ratio is the sort of boring trade that usually works out while everyone else is chasing high-beta artificial intelligence stories. Just do not expect the stock to care about your feelings until the options dealers finish their hedging for the week.
Bank of America Corporation (BAC)
Trailing P/E
Marcus Wolfe Screen
Leverage Profile
30D Channel
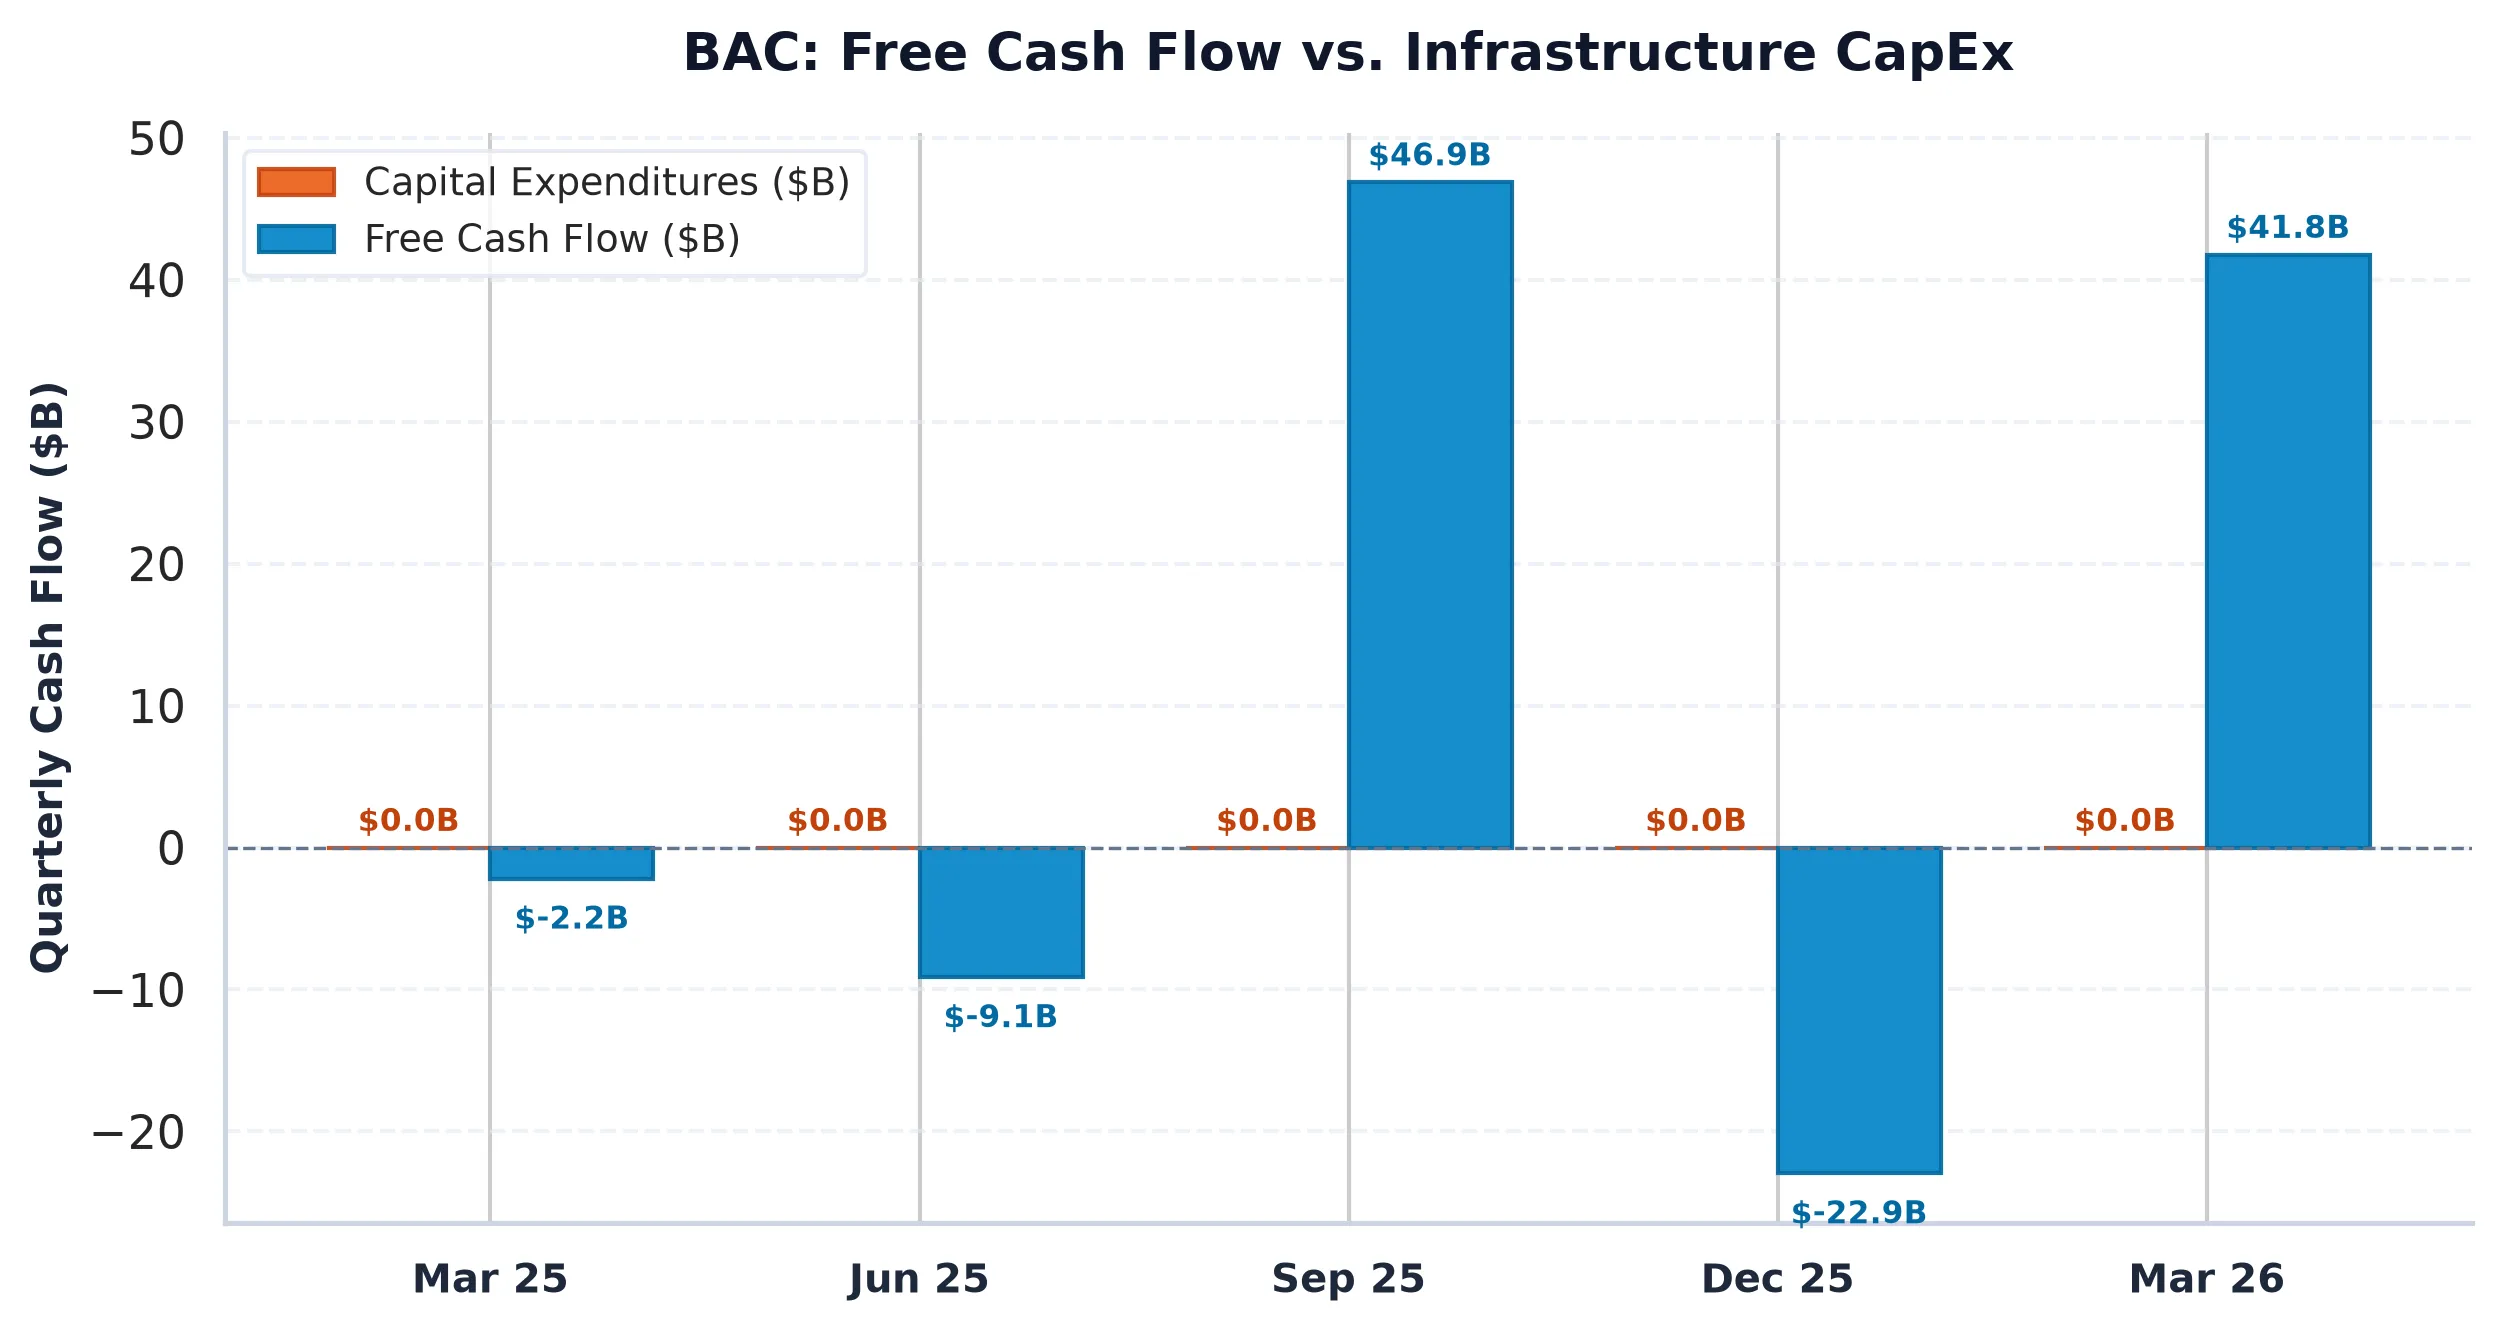
Pristine cash flow conversion (0.41x) and healthy accrual ratio (0.52%). Zero accounting anomalies detected (LOW ANOMALY RISK).
Tier 1 Regulatory Capital & Liquidity Coverage Ratio (LCR) compliant; balance sheet governed by Basel III capital buffers.
Evaluated against 5.10% US 10-Yr Benchmark; bank net interest margins sensitive to yield curve slope (2s10s spread) and deposit beta.
Max Pain: $52.00 (+1.50%) | P/C Ratio: 0.49 | 30D Channel: $47.56 – $54.90.
$47.13 – $49.18 (-4% to -8% Pullback Accumulation)
Sustained weekly close below $46.11 (-10.0% structural stop) or fundamental cash flow deterioration.