
The broad market opened in a state of suspended animation this morning, which is Wall Street shorthand for traders waiting to see whether sovereign yields or crude contracts will blink first. The S&P 500 ETF (SPY) hovered virtually unchanged at $778.01 (-0.01%), while the tech-heavy Nasdaq 100 (QQQ) gave back -0.33% to trade at $743.57. Small caps showed modest fatigue, with the Russell 2000 ETF (IWM) slipping -0.43% to $276.70.
Across fixed income, the long end experienced a gentle bid. The 20+ Year Treasury ETF (TLT) advanced +0.41% to $78.37, nudging the benchmark 10-Year US Treasury yield (^TNX) lower by four basis points to 5.217%. High-yield credit (HYG) dipped slightly to $77.09 (-0.26%), while the US Dollar Index (UUP) eased -0.38% to $29.02.
The defining divergence of the morning, however, came from physical commodities. While equity benchmarks idled, crude oil (USO) caught a firm bid, rallying +1.36% to $153.09. When headline stock indices refuse to move while oil ticks higher and long-term risk-free debt yields north of 5.2%, the market is quietly rotating out of multiple-expansion fantasies and into hard, cash-generative barrels.
Macro Note: Rate Reality and the Capital Scramble
For eighteen months, the consensus playbook assumed that elevated interest rates would eventually break corporate balance sheets, forcing the Federal Reserve into rapid-fire liquidity injections. Instead, the 10-year yield has anchored itself firmly above 5.2%, establishing a severe hurdle rate for every dollar of equity capital deployed across North America.
In a 5.2% world, corporate arithmetic is brutally unforgiving. If a sovereign Treasury note pays you a guaranteed 5.22% with zero operating friction, zero execution risk, and zero management stock options, an equity investment trading at 30 or 40 times earnings is an act of pure faith. To justify institutional ownership today, a company must produce tangible, distributable free cash flow at an attractive spread above the risk-free rate.
This macroeconomic backdrop explains the widening bifurcation across sectors. Technology (XLK), trading at an elevated trailing multiple of 32.14x with a minuscule 0.43% dividend yield, is vulnerable to any upward tremor in duration yields. By contrast, the Energy sector (XLE) trades at a disciplined 19.14x trailing earnings with a 2.48% dividend yield, backed by tangible assets that generate cash precisely when inflation and commodity pressures threaten broader corporate margins.
Quantitative Flow: Dealer Gamma and Energy Skew
From a market structure perspective, index price action remains locked inside a classic options volatility vice. With SPY hovering within striking distance of the round $780 level and QQQ pinned near $745, index options market makers are positioned in a positive gamma posture.
When options dealers are long gamma, their dynamic delta-hedging algorithms are forced to sell into intraday spikes and buy into intraday dips. This mechanical flow dampens realized volatility, compressing the CBOE Volatility Index (^VIX) to a muted 15.30 (+0.20%) and creating the illusion of tranquil stability across headline index cards.
Beneath that surface calm, single-stock derivatives tell a dramatically different story. Over the past three sessions, call-skew in energy equities has begun steepening relative to index puts. Rather than using options purely for downside portfolio hedging, institutional flow desks have been accumulating upside calls across integrated oil majors. Because dealer books in single-stock energy names are shorter gamma on the upside strikes, any sustained upward drift in crude prices forces options desks to aggressively purchase underlying cash shares to remain delta-neutral. What appears to fundamental observers as sudden buying enthusiasm is often the mechanical physics of dealer inventory management.
Sector Deep-Dive: ExxonMobil and the Permian Cash Spigot
Consider the primary beneficiary of this commodity and flow alignment: Exxon Mobil Corporation (XOM).
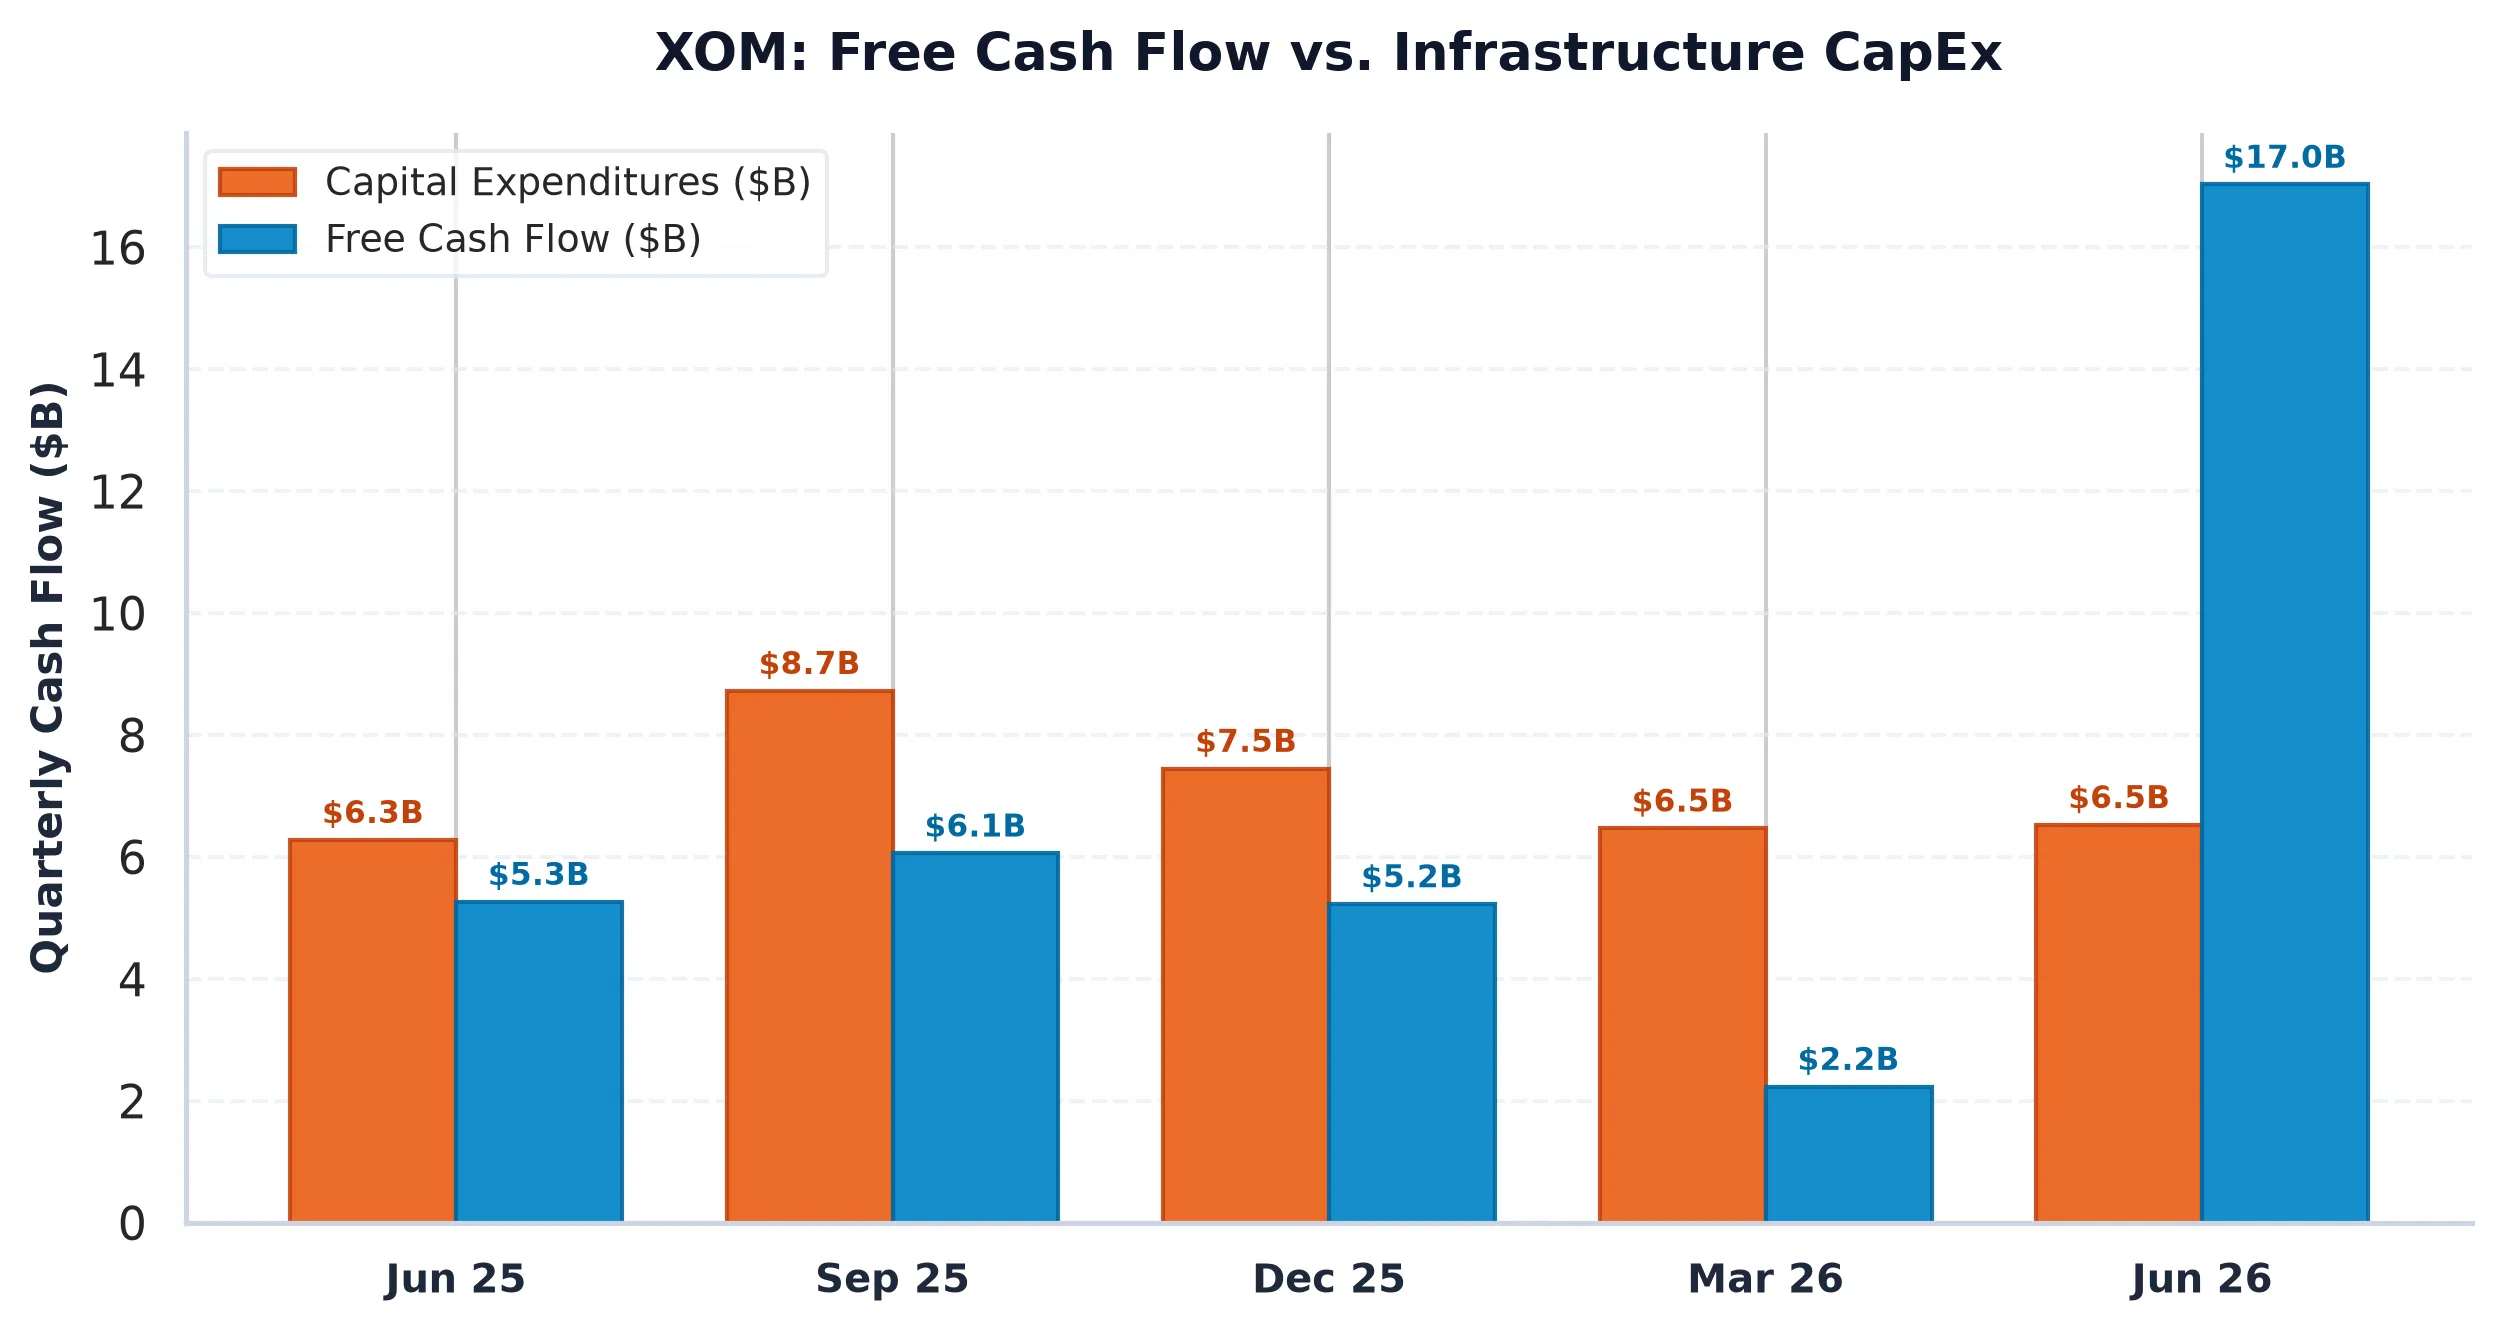
At $174.08 per share, Exxon carries a market capitalization of $715.80 billion and an enterprise value of $754.31 billion. In an equity market crowded with conceptual artificial intelligence plays that burn capital to build data centers, Exxon represents the opposite extreme: a business that extracts black liquid from the Earth, refines it into essential chemical and fuel compounds, and converts that throughput into massive rivers of distributable cash.
Over the trailing twelve months, Exxon produced $361.06 billion in total revenue, delivering $32.76 billion in GAAP net income. Year-over-year revenue surged 44.10%, reflecting the monumental closing and financial consolidation of Pioneer Natural Resources.
The Pioneer acquisition was not merely an expansion of acreage. It was a structural transformation of Exxon’s upstream cost curve. By securing Pioneer’s premier contiguous Tier-1 acreage in the Midland Basin, Exxon consolidated its stranglehold over the Permian, creating an integrated manufacturing machine capable of extracting barrels at an estimated breakeven cost below $35 per barrel.
More importantly, Exxon’s cash generation holds up under rigorous scrutiny. Trailing free cash flow sits at $20.67 billion, supported by $51.97 billion in operating cash flow. The company trades at a forward P/E multiple of 15.19x and an EV/EBITDA of 11.10x, with an operating margin of 15.86% and a return on equity of 12.58%.
When compared to the broader market, Exxon offers institutional capital an attractive combination: an inflation-hedged cash return, an investment-grade balance sheet with $10.59 billion in cash against $42.37 billion in total debt, and the capital discipline to return billions through dividends and share repurchases rather than speculative wildcatting.
Forensic Risk Spotlight: Pioneer Integration and Inventory Accruals
Even in an elite industrial operator, forensic screening demands a careful look at working capital plumbing.
Quantitative accounting screens on Exxon’s latest balance sheet trigger a single watch-item flag: inventory expansion. Inventories expanded notably over the past four quarters as Pioneer’s upstream assets, midstream storage, and unrefined hydrocarbons were consolidated onto the corporate ledger. In cyclical resource businesses, inventory bloat can occasionally signal sluggish product movement or softening downstream chemical demand.
However, a deeper forensic examination of cash conversion alleviates the primary concern. Total balance-sheet accruals stand at negative $23.13 billion, driven by massive non-cash depreciation, depletion, and amortization deductions on long-life reserves. Exxon’s cash flow conversion ratio (Operating Cash Flow divided by Net Income) stands at an exceptional 1.80x. The company is not inflating reported earnings with aggressive revenue accruals. If anything, its reported GAAP net income understated true operating cash flow by more than $19 billion.
The genuine risk for Exxon is not internal accounting gymnastics, but macroeconomic sensitivity. While Pioneer adds vast drilling inventory, it also permanently ties Exxon’s marginal return on capital to the global hydrocarbon price deck. If sovereign yields at 5.2% eventually trigger an industrial recession that pulls crude below $65 per barrel, Exxon’s operational leverage will work in reverse, compressing refining margins and forcing management to choose between capital reinvestment and share repurchase velocity.
At current commodity levels, however, the balance sheet operates as a fortress.
📊 AllWallSt Investment Verdict
| Company / Ticker | Rating | Word/Horizon |
|---|---|---|
| Exxon Mobil Corporation (XOM) | BUY | 12-18 Months |
Conviction rating derived from quantitative fundamental models, options open interest distribution, and primary SEC filing review.
Sources & References
- Exxon Mobil Corporation Investor Relations
- SEC EDGAR Filings: Exxon Mobil Corp (CIK 0000034088)
- U.S. Energy Information Administration (EIA) Petroleum Statistics
- Cboe Options Exchange Market Volatility and Skew Feeds
Disclaimer: This morning market intelligence brief is prepared strictly for institutional educational and analytical purposes and does not constitute personalized investment, legal, or tax advice. Market conditions, options gamma exposures, and commodity prices fluctuate continuously. Always perform independent due diligence before allocating capital.