
The Seven Trillion Dollar Hardware Treadmill
Wall Street loves a tollbooth business until the owner starts spending every single toll on concrete, customized silicon, and high-voltage electrical transformers. For two decades, Alphabet Inc. (GOOGL) operated the most lucrative tollbooth in human history, collecting near-monopoly rents on web searches. Today, it finds itself caught in an escalating infrastructure arms race where stopping the capital engine means surrendering the future.
Former Treasury Secretary Hank Paulson recently observed that he has never seen so much capital chasing a single technological opportunity. Meanwhile, hedge fund manager Daniel Loeb has framed the dilemma as a $7 trillion spending boom running headlong into a $3 trillion economic reality check. Alphabet is the poster child for this tension.
In its third-quarter 2026 results filed on Form 8-K, Alphabet reported consolidated revenue of $127.6 billion, up 25% year over year. Google Cloud accelerated while Search query growth hit its highest rate in five years. Yet behind these operational headlines lies a profound shift in capital allocation. Trailing twelve-month capital expenditures surged to $159.8 billion, representing 33.9% of total revenue. That massive hardware tax dragged headline Free Cash Flow Yield into negative territory at -0.04%.
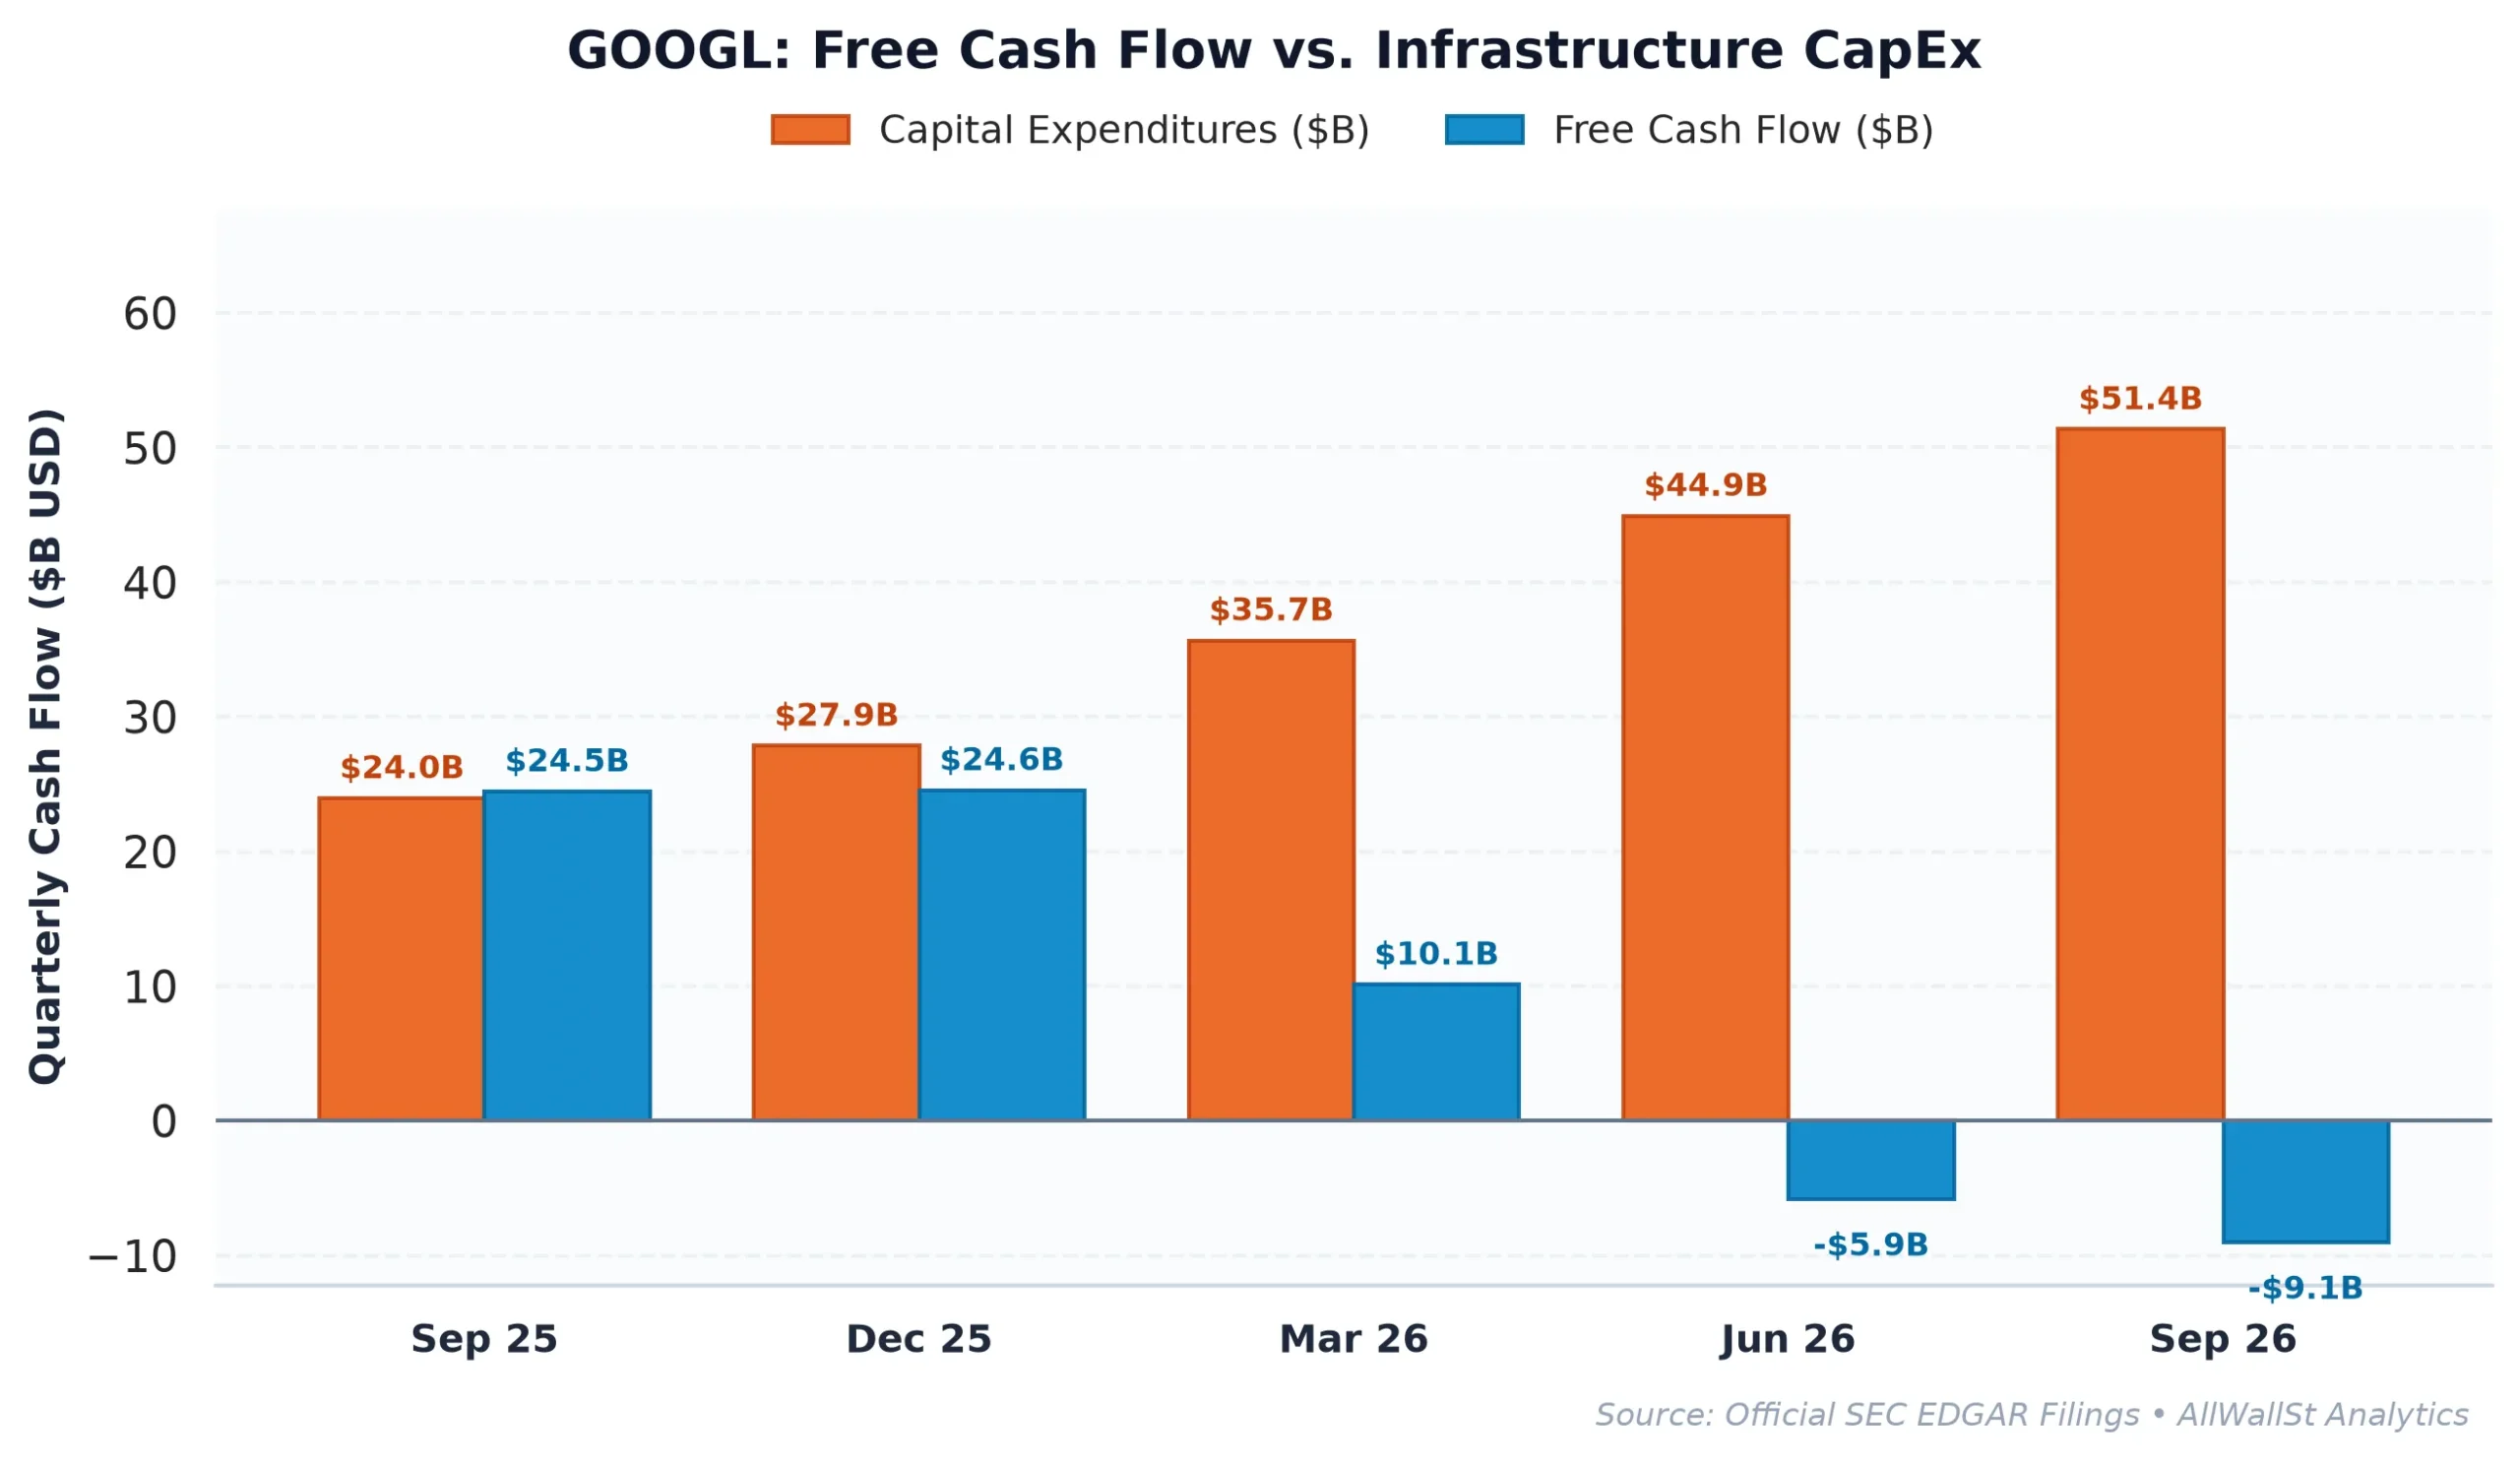
When we assigned a HOLD rating on October 28 at $324.15 in our previous capital allocation audit, we warned that hyperscaler depreciation and infrastructure expansion would compress cash yields. With shares now trading near $265.29, the equity market is actively repricing this capital intensity. Metrics calculated from primary SEC EDGAR filings show that while operating momentum is intact, equity holders are bearing the full burden of balance-sheet reinvestment.
Sterilizing Dilution at Forty-Five Billion Dollars a Year
From a pure balance-sheet safety perspective, Alphabet remains built like an impenetrable fortress. The business holds $265.1 billion in total cash against $150.3 billion in total debt, leaving a net cash surplus of $114.8 billion. Return on invested capital (ROIC) stands at an enviable 41.3%, easily outpacing its estimated 8.5% weighted average cost of capital (WACC). This means every dollar Alphabet invests in its core operation still generates substantial economic value.
The structural friction shows up inside cash flow statement mechanics and shareholder payout policy. Over the past year, management deployed $45.71 billion into share repurchases, advertising a gross buyback yield of 1.40%.
| Period | Revenue | Operating Income | Operating Margin | Free Cash Flow | SBC Expense |
|---|---|---|---|---|---|
| FY2022 | $282.84B | $74.84B | 26.5% | $60.01B | $19.36B |
| FY2023 | $307.39B | $84.29B | 27.4% | $69.50B | $22.46B |
| FY2024 | $350.02B | $112.39B | 32.1% | $72.76B | $22.79B |
| FY2025 | $402.84B | $129.04B | 32.0% | $73.27B | $24.95B |
A close audit of SEC filings reveals that stock-based compensation reached $24.95 billion, consuming 13.9% of cash from operations. Stock compensation is a real economic expense where the company pays executives with fresh equity instead of cash. When you subtract that dilution from reported cash flows, Alphabet’s real free cash flow drops to $-26.12 billion, yielding -0.80% net of SBC.
More than half of the cash spent on share repurchases does not shrink the diluted share count. Instead, it functions as an expensive corporate recycling program, spending cash to buy back shares on the open market simply to sterilize executive equity grants. Buying back shares at elevated multiples merely to offset stock compensation is a poor substitute for returning unencumbered cash to shareholders.
Dissecting the Hyperscaler Valuation Gap
Alphabet trades at a forward Price-to-Earnings (P/E) multiple of 17.3x and an Enterprise Value to EBITDA (EV/EBITDA) multiple of 17.1x. On paper, this looks notably cheaper than peer software and cloud platforms.
| Company (Ticker) | Market Cap | Forward P/E | EV/EBITDA | Rev Growth (YoY) | Operating Margin | FCF Yield |
|---|---|---|---|---|---|---|
| Alphabet (GOOGL) | $3.26T | 17.3x | 17.1x | 24.70% | 33.32% | -0.04% |
| Meta Platforms (META) | $1.43T | 15.7x | 12.6x | 26.1% | 37.8% | 1.18% |
| Microsoft (MSFT) | $3.60T | 20.0x | 17.8x | 18.8% | 47.1% | 0.08% |
| Amazon.com (AMZN) | $2.67T | 22.6x | 15.6x | 12.1% | 13.1% | -1.30% |
The valuation discount reflects market skepticism regarding cash flow conversion. While Microsoft maintains a 47.1% operating margin and positive free cash flow, both Alphabet and Amazon have seen cash flow turn negative under the weight of massive server buildouts. Meta Platforms commands higher operating margins at 37.8% while preserving a positive 1.18% FCF yield, allowing it to trade at a lower forward multiple of 15.7x without sacrificing cash returns.
Alphabet also carries unique governance and regulatory drag. Federal dockets show ongoing antitrust litigation, including recent privacy filings such as M.W. v. Google LLC in California federal court. The company is simultaneously weighing a potential $3 billion legal settlement while negotiating debt raises to finance its infrastructure goals. These liabilities prevent the market from awarding Alphabet the premium multiple enjoyed by pure-play enterprise software providers.
Options Plumbing, Risk Bounds, and Final Rationale
Options market structure into upcoming expirations reveals a defensive posture among institutional market makers. Total call open interest sits at 81,541 contracts against 40,610 puts, yielding a Put/Call ratio of 0.50. Recent order flow shows that 64% of total option premium has traded on the put side, indicating aggressive downside hedging by institutional asset managers.
The options market’s Max Pain strike stands at $285, representing the exact price level where the largest number of option contracts expire worthless. This acts as an upward magnetic pull for market makers hedging their exposure. On the downside, heavy Put Walls sit at $270 and $250, establishing logical support floors. Primary Call Walls at $290 and $300 create formidable overhead resistance where option sellers will sell underlying stock to stay delta neutral.
The 30-day implied volatility of 48.94% implies a price envelope of plus or minus $37.22 (a 14.0% move in either direction). However, off-hours and weekend option bid-ask spreads frequently inflate implied volatility calculations relative to Alphabet’s historical beta of 1.23, so near-term volatility bounds should be interpreted with minor structural nuance.
Against the 4.91% US 10-Year Treasury yield, holding an equity that delivers a negative real free cash flow yield requires full confidence that data center investments will quickly translate into high-margin revenues. Until Alphabet proves that its $160 billion annual CapEx cycle can generate sustainable cash returns beyond Search, the equity remains fairly valued.
Investment Committee Steelman Dissent: If Alphabet successfully monetizes its custom Google Cloud AI infrastructure across enterprise clients while Search query growth accelerates, the current 17.3x forward multiple will prove to be a generational buying opportunity. Conversely, if hyperscaler CapEx continues to outpace enterprise software spending while regulatory pressures erode ad margins, free cash flow will remain depressed and trigger further multiple contraction.
AllWallSt Investment Verdict: HOLD (Reaffirming rating)
Alphabet Inc. (GOOGL)
Sources & References
- Official SEC Form 10-K Annual Report (Filed 2026-02-05)
- Official SEC Form 10-Q Quarterly Report (Filed 2026-10-29)
- SEC Form 8-K Exhibit 99.1 (Press Release / Earnings) (2026-07-22)
- SEC DEF 14A Proxy / M&A Filing (2026-04-24)
- Federal Register (2026-11-02): Certain Dynamic Random Access Memory (DRAM) Devices, Products Containing the Same and…
- Federal Register (2026-07-22): Notice Pursuant to the National Cooperative Research and Production Act of 1993-Naval…
-
USASpending Federal Contract Award ($17.1M, Department of Agriculture)
-
SEC EDGAR Main Filing Archive & Corporate Records: https://www.sec.gov/edgar/browse/?CIK=0001652044
- Alphabet Inc. Form 8-K Earnings Release (Filed October 28, 2026): https://www.sec.gov/Archives/edgar/data/1652044/000165204426000080/googexhibit991q32026.htm
- Alphabet Inc. Investor Relations & Corporate Governance: https://abc.xyz
- USASpending.gov Active Federal Contract Awards: Department of Agriculture Stratus Pool 1 (Contract AWD 12314424F0420)
- Federal District Court Records: M.W. v. Google LLC (N.D. Cal. Docket 4:26-cv-14224)
Regulatory & Fiduciary Disclaimer
This deep-dive analytical report is published strictly for information and educational purposes by AllWallSt. None of the contents herein constitute investment advice, financial promotion, or a recommendation to purchase or sell securities. Financial metrics, balance-sheet calculations, options positioning, and regulatory filings reflect public data as of November 21, 2026. Investors should conduct independent analysis and consult a certified fiduciary before executing transactions in volatile financial markets.