
The normal business model of a hyperscale cloud provider is straightforward. You spend billions of dollars building massive concrete data centers, you fill them with specialized silicon, and then you rent those chips out to other companies at healthy operating margins. If you do this well, corporate customers happily pay you a monthly fee to run their enterprise workloads, host their web applications, and protect their data from the horrors of the public internet.
Sundar Pichai, the chief executive officer of Alphabet Inc. (GOOGL), recently acknowledged that Google is doing something rather unusual with this model. Specifically, he admitted that Google Cloud has been intentionally passing up near-term paying client revenue because the company needs that server capacity to train and run its internal artificial intelligence models.
To traditional financial analysts who view cloud infrastructure as a high-margin recurring rental business, this sounds almost perverse. Cloud computing has historically been celebrated as an asset-light transformation for enterprise customers and an asset-rich toll road for the operators. Turning away cash-paying corporate tenants so your own internal research teams can run compute-hungry experiments is the digital equivalent of an apartment landlord kicking out rent-paying families to store their own vintage furniture collection.
Yet inside the tech bubble, this maneuver is presented as strategic necessity. If the generative AI race is an existential contest of raw compute, then selling that compute to third parties for mere dollars per hour might be penny-wise and pound-foolish. The market, however, is beginning to run the balance sheet arithmetic on what happens when capital expenditure reaches sovereign proportions while near-term free cash flow yield collapses into a rounding error.
The PHP Mandate and the Enterprise Flight to Safety
While Google is rationing cloud capacity internally, the rest of the corporate web is desperately trying to find reliable cloud shelter. Security researchers from Google, OpenAI, and cloud defense firm Wiz just unearthed critical, decades-old security vulnerabilities within PHP, the open-source scripting language that underpins more than 75% of the global web.
Mainstream coverage treated the discovery as a standard cyber panic, complete with warnings of imminent remote code execution across thousands of unpatched servers. But the real institutional takeaway is an operational migration mandate. For decades, thousands of mid-tier enterprises and legacy digital businesses operated on the comforting assumption that self-managed on-premises servers or cheap shared hosting were economically superior to hyperscale cloud providers.
When vulnerabilities dating back to the late nineties surface in core internet protocols, maintaining private server infrastructure becomes an existential liability. Autonomous vulnerability scanners and modern red-teaming tools weaponize these flaws in hours. The immediate beneficiary of this structural panic should naturally be Google Cloud, supported by its Mandiant cybersecurity division.
Every enterprise scrambling to patch twenty-year-old codebases represents prospective customer lifetime value for managed cloud defenses. The paradox is that just as enterprise demand for secure hyperscale infrastructure surges, Google is telling the market that its capacity is constrained by internal AI consumption.
The Arithmetic of $163 Billion in CapEx
The financial consequences of this strategy appear clearly in Alphabet’s regulatory filings. Over the trailing twelve months, Alphabet generated $445.87 billion in total revenue and reported a staggering $244.12 billion in net income, delivering an operating margin of 34.03%. On a pure accounting basis, the enterprise appears as profitable as ever.
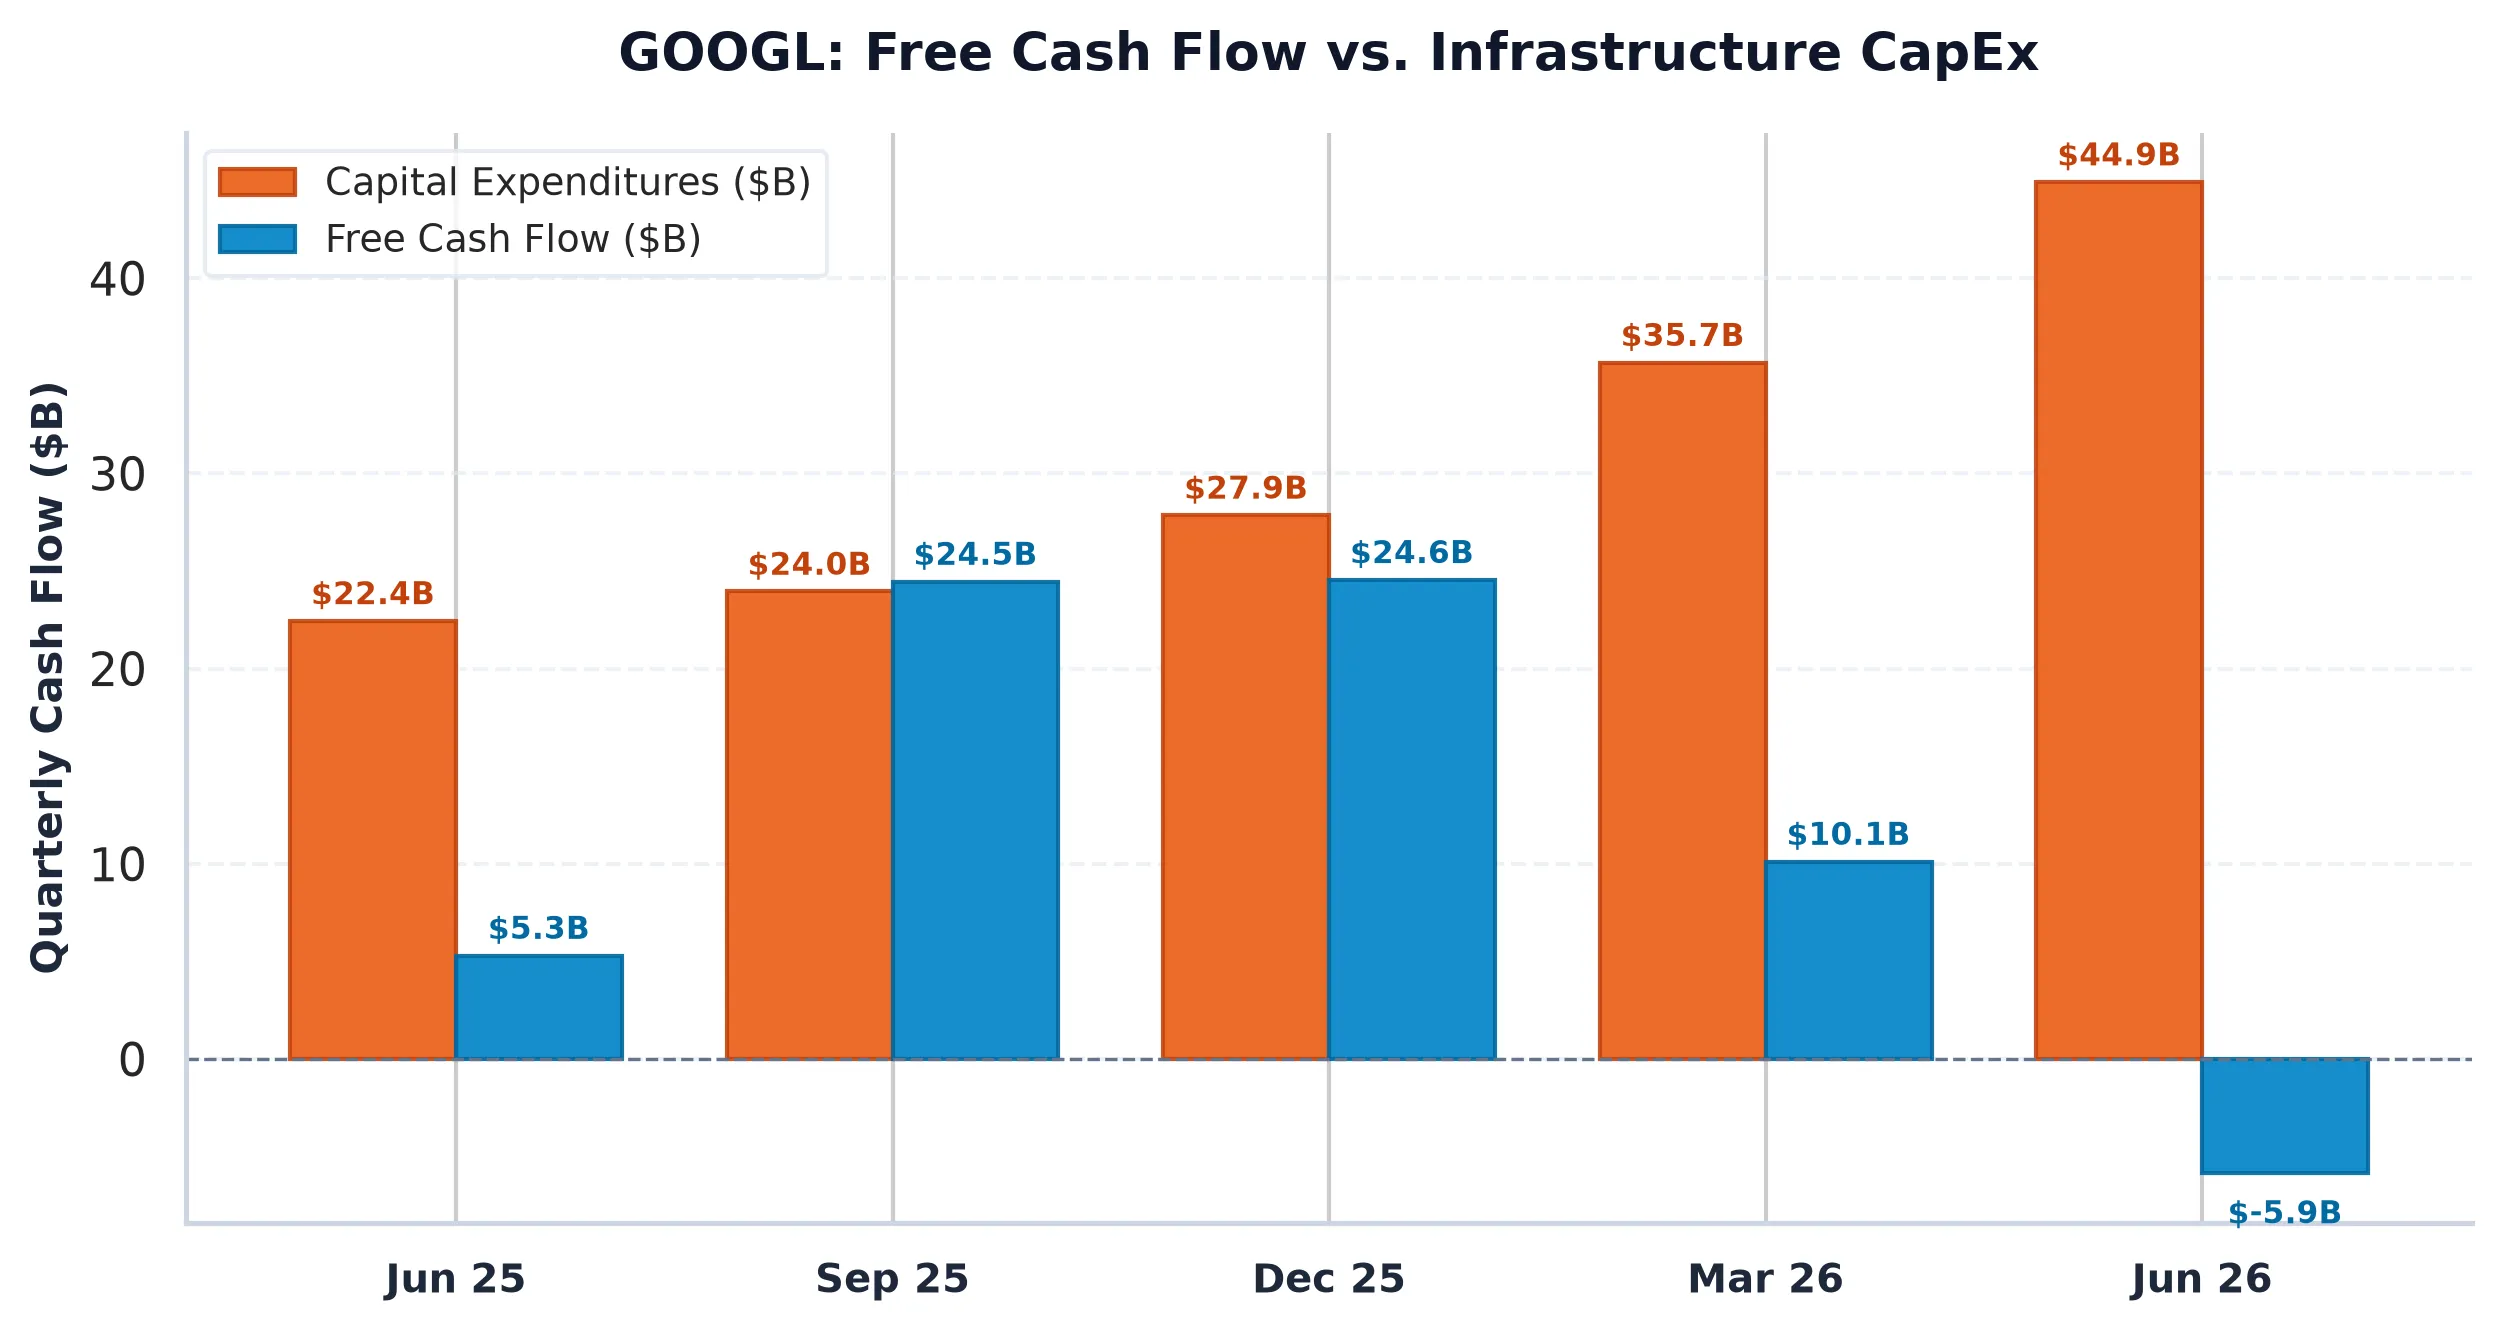
The cash flow statement tells a very different story. Trailing capital expenditures have surged to $163.01 billion, representing a CapEx intensity of 36.56% of total revenue. For a company that once operated as an asset-light advertising monopoly, dedicating more than a third of gross receipts to property, plant, and equipment is a dramatic structural shift.
Alphabet Inc. (GOOGL) Cash Flow Divergence:
--------------------------------------------
Total Revenue (TTM):          $445.87B
Reported Net Income:          $244.12B
Capital Expenditures (TTM):   $163.01B
True Free Cash Flow:           $22.67B
CapEx / Revenue Intensity:      36.56%
FCF Yield (at $334.76):          0.55%
US 10-Year Treasury Yield:       5.15%
Equity Risk Spread:             -4.59%
Because cash CapEx leaves the building immediately while depreciation charges hit the income statement gradually over several years, reported GAAP earnings look pristine while physical cash generation narrows. Alphabet’s true Free Cash Flow for the trailing twelve months settled at $22.67 billion.
Against a market capitalization of $4.09 trillion, Alphabet now trades at a Free Cash Flow yield of just 0.55%. In a macroeconomic regime where the benchmark US 10-Year Treasury yields 5.15%, Alphabet’s cash yield offers a negative spread of 4.59%. Equity investors are effectively paying Uncle Sam a four-and-a-half-point premium for the privilege of holding Google equity duration risk, betting that internal AI models will eventually generate monetization that dwarfs today’s forgone cloud sales.
Alphabet can afford this financial strain longer than almost anyone else on the planet. Its balance sheet carries $242.47 billion in cash and marketable securities against $120.79 billion in total debt, leaving a net cash cushion of $121.68 billion. The company is not in financial danger; it is simply choosing to deploy its immense liquidity into physical infrastructure at a rate that compresses current equity cash returns.
Options Plumbing: The $350 Ceiling and Dealer Gamma
The derivatives market reflects this strange equilibrium between strategic dominance and capital drag. Derivatives data shows total call open interest standing at 143,947 contracts against 81,228 put contracts, establishing a Put/Call open interest ratio of 0.56.
This low ratio indicates speculative call crowding. Retail and institutional accounts have repeatedly bought upside calls, anticipating that any positive announcement regarding search monetization or enterprise AI breakthroughs will trigger an explosive rally. But the structure of dealer inventory suggests that runaway momentum will face heavy mechanical friction.
Options Market Structure Snapshot:
--------------------------------------------
Spot Price:                    $334.76
Max Pain Strike:               $342.50 (+2.31%)
Put/Call OI Ratio:                0.56
Primary Call Walls:            $350.00 / $352.50
Primary Put Wall:              $330.00
At-The-Money Implied Vol:        16.24%
30-Day Dispersion Envelope:   +/-$15.60 (+/-4.66%)
The options market has erected a formidable Call Wall at the $350 and $352.50 strikes, backed by nearly 38,000 contracts of open interest. When option dealers are net short these upside calls, they must sell underlying stock into rallies to maintain delta neutrality as the strikes are approached. This mechanical dynamic tends to cap sharp upside moves unless accompanied by massive institutional spot volume.
Conversely, structural put support forms a solid floor at the $330 strike, reinforced by secondary open interest at $325. The deterministic Max Pain strike sits at $342.50, roughly 2.3% above the current spot price of $334.76. Implied volatility remains relatively subdued at 16.24%, pricing in an expected 30-day move of approximately $15.60 in either direction. The options market is essentially pricing Alphabet to remain range-bound between the $330 Put Wall and the $350 Call Wall as expiration approaches.
Sacrificing the Golden Goose for an Unhatched Swan
The central tension for Alphabet equity holders is not whether Google Cloud is technologically capable or whether its cybersecurity footprint is expanding. The PHP revelations prove that enterprise reliance on modern hyperscale security has never been higher. The question is whether sacrificing paying enterprise customers to feed internal AI models is a rational capital allocation strategy when risk-free debt yields over 5%.
If Google Cloud turns away paying corporate workloads, those enterprise customers do not wait indefinitely. They migrate to Amazon Web Services or Microsoft Azure, signing multi-year enterprise agreements that are notoriously difficult to dislodge later. Sacrificing immediate, high-margin, recurring subscription cash flow to direct internal GPUs toward AI training is a high-stakes bet that foundational models will yield monopolistic pricing power down the road.
If that bet pays off, Alphabet will own both the foundational platform and the underlying infrastructure of the next computing era. But if foundational AI models ultimately commoditize, Alphabet will have traded hundreds of billions of dollars in CapEx and real enterprise cloud market share for software capabilities that could have been rented elsewhere. For now, with free cash flow yields sitting below 1%, the market has little margin for error if those internal compute clusters fail to turn an immediate economic profit.
Alphabet Inc. (GOOGL)
Trailing P/E
Marcus Wolfe Screen
Leverage Profile
30D Channel
Pristine cash flow conversion (1.25x) and healthy accrual ratio (-5.47%). Zero accounting anomalies detected (LOW ANOMALY RISK).
Fortress Balance Sheet (Net Cash Position; zero net refinancing distress).
Evaluated against 5.10% US 10-Yr Benchmark (FCF Spread: -4.59% (vs 10Y Yield of 5.15%)).
Max Pain: $342.50 (+2.31%) | P/C Ratio: 0.56 | 30D Channel: $310.77 – $358.75.
$307.98 – $321.37 (-4% to -8% Pullback Accumulation)
Sustained weekly close below $301.28 (-10.0% structural stop) or fundamental cash flow deterioration.