
Arm Holdings plc (ARM) occupies perhaps the most enviable position in the global technology stack. It does not manufacture chips, it does not manage messy supply chains, and it does not worry about the price of neon gas. Instead, it sells the blueprints. It is a pure intellectual property tollbooth that collects a small fee every time someone, somewhere, wants a processor to do something smart. In a world obsessed with generative AI, this sounds like the ultimate business model: high margins, recurring royalties, and a dominant market share in mobile that is now aggressively colonizing the data center.
The problem, as is often the case in 2026, is that the market has priced this tollbooth as if it owns the entire highway, the cars, and the destination itself. Following a recent 6.72% slide triggered by rumors that CEO Rene Haas might be on the shortlist for the top job at Nvidia, the stock sits at a crossroads. While the bulls see a compounding machine that is just beginning to flex its pricing power through the v9 architecture, the math suggests a different story. When you are trading at a triple-digit multiple of cash flow while paying out your entire earnings to employees in stock, you aren’t just an investment: you are a leap of faith.
The IP Tollbooth and the Engineering of an Infinite Multiple
The bull case for Arm Holdings plc is intellectually seductive. Historically, the company made its money on the v8 architecture, taking a modest 1% to 2% royalty on the price of a chip. With the transition to v9, management has effectively doubled that royalty rate. Because the research and development costs for these architectures are largely sunk or fixed, every incremental dollar of royalty revenue flows almost directly to the bottom line. This is the definition of operating leverage: the ability to grow profits significantly faster than revenue.
In the AI era, this leverage is supposed to go into overdrive. Data centers are shifting from general-purpose CPUs to specialized AI accelerators, and many of those accelerators are being built on the Arm architecture. When a hyperscaler like Microsoft or Alphabet designs a custom chip, they pay Arm Holdings plc for the privilege. This creates a high-visibility, high-margin revenue stream that is theoretically insulated from the cyclical boom and bust of the hardware world.
However, a look at the historical fundamental trajectory reveals a disconnect. In FY2023, the company generated $678.0 million in operating income on $2.68 billion in revenue. By FY2026, revenue had nearly doubled to $4.92 billion, but operating income only grew to $908.0 million. The operating margin, which bulls expected to balloon toward 40% or 50%, has actually compressed from 25.3% to 18.5% over that period. The engine is running hot, but the friction of scaling a global engineering workforce is eating the gains.
The Forensic Audit of a 0.58% Yield
To understand why the AllWallSt Quantitative Desk has assigned a SELL conviction, one must look past the GAAP net income and into the plumbing of the cash flow statement. Arm Holdings plc currently trades at a trailing price-to-earnings (P/E) ratio of 211.2x. For context, the US 10-Year Treasury yield is currently sitting at 5.06%. If you buy a government bond, you get a 5% yield with zero risk. If you buy Arm Holdings plc at these levels, your earnings yield is roughly 0.47%. You are essentially paying for 200 years of current earnings today.
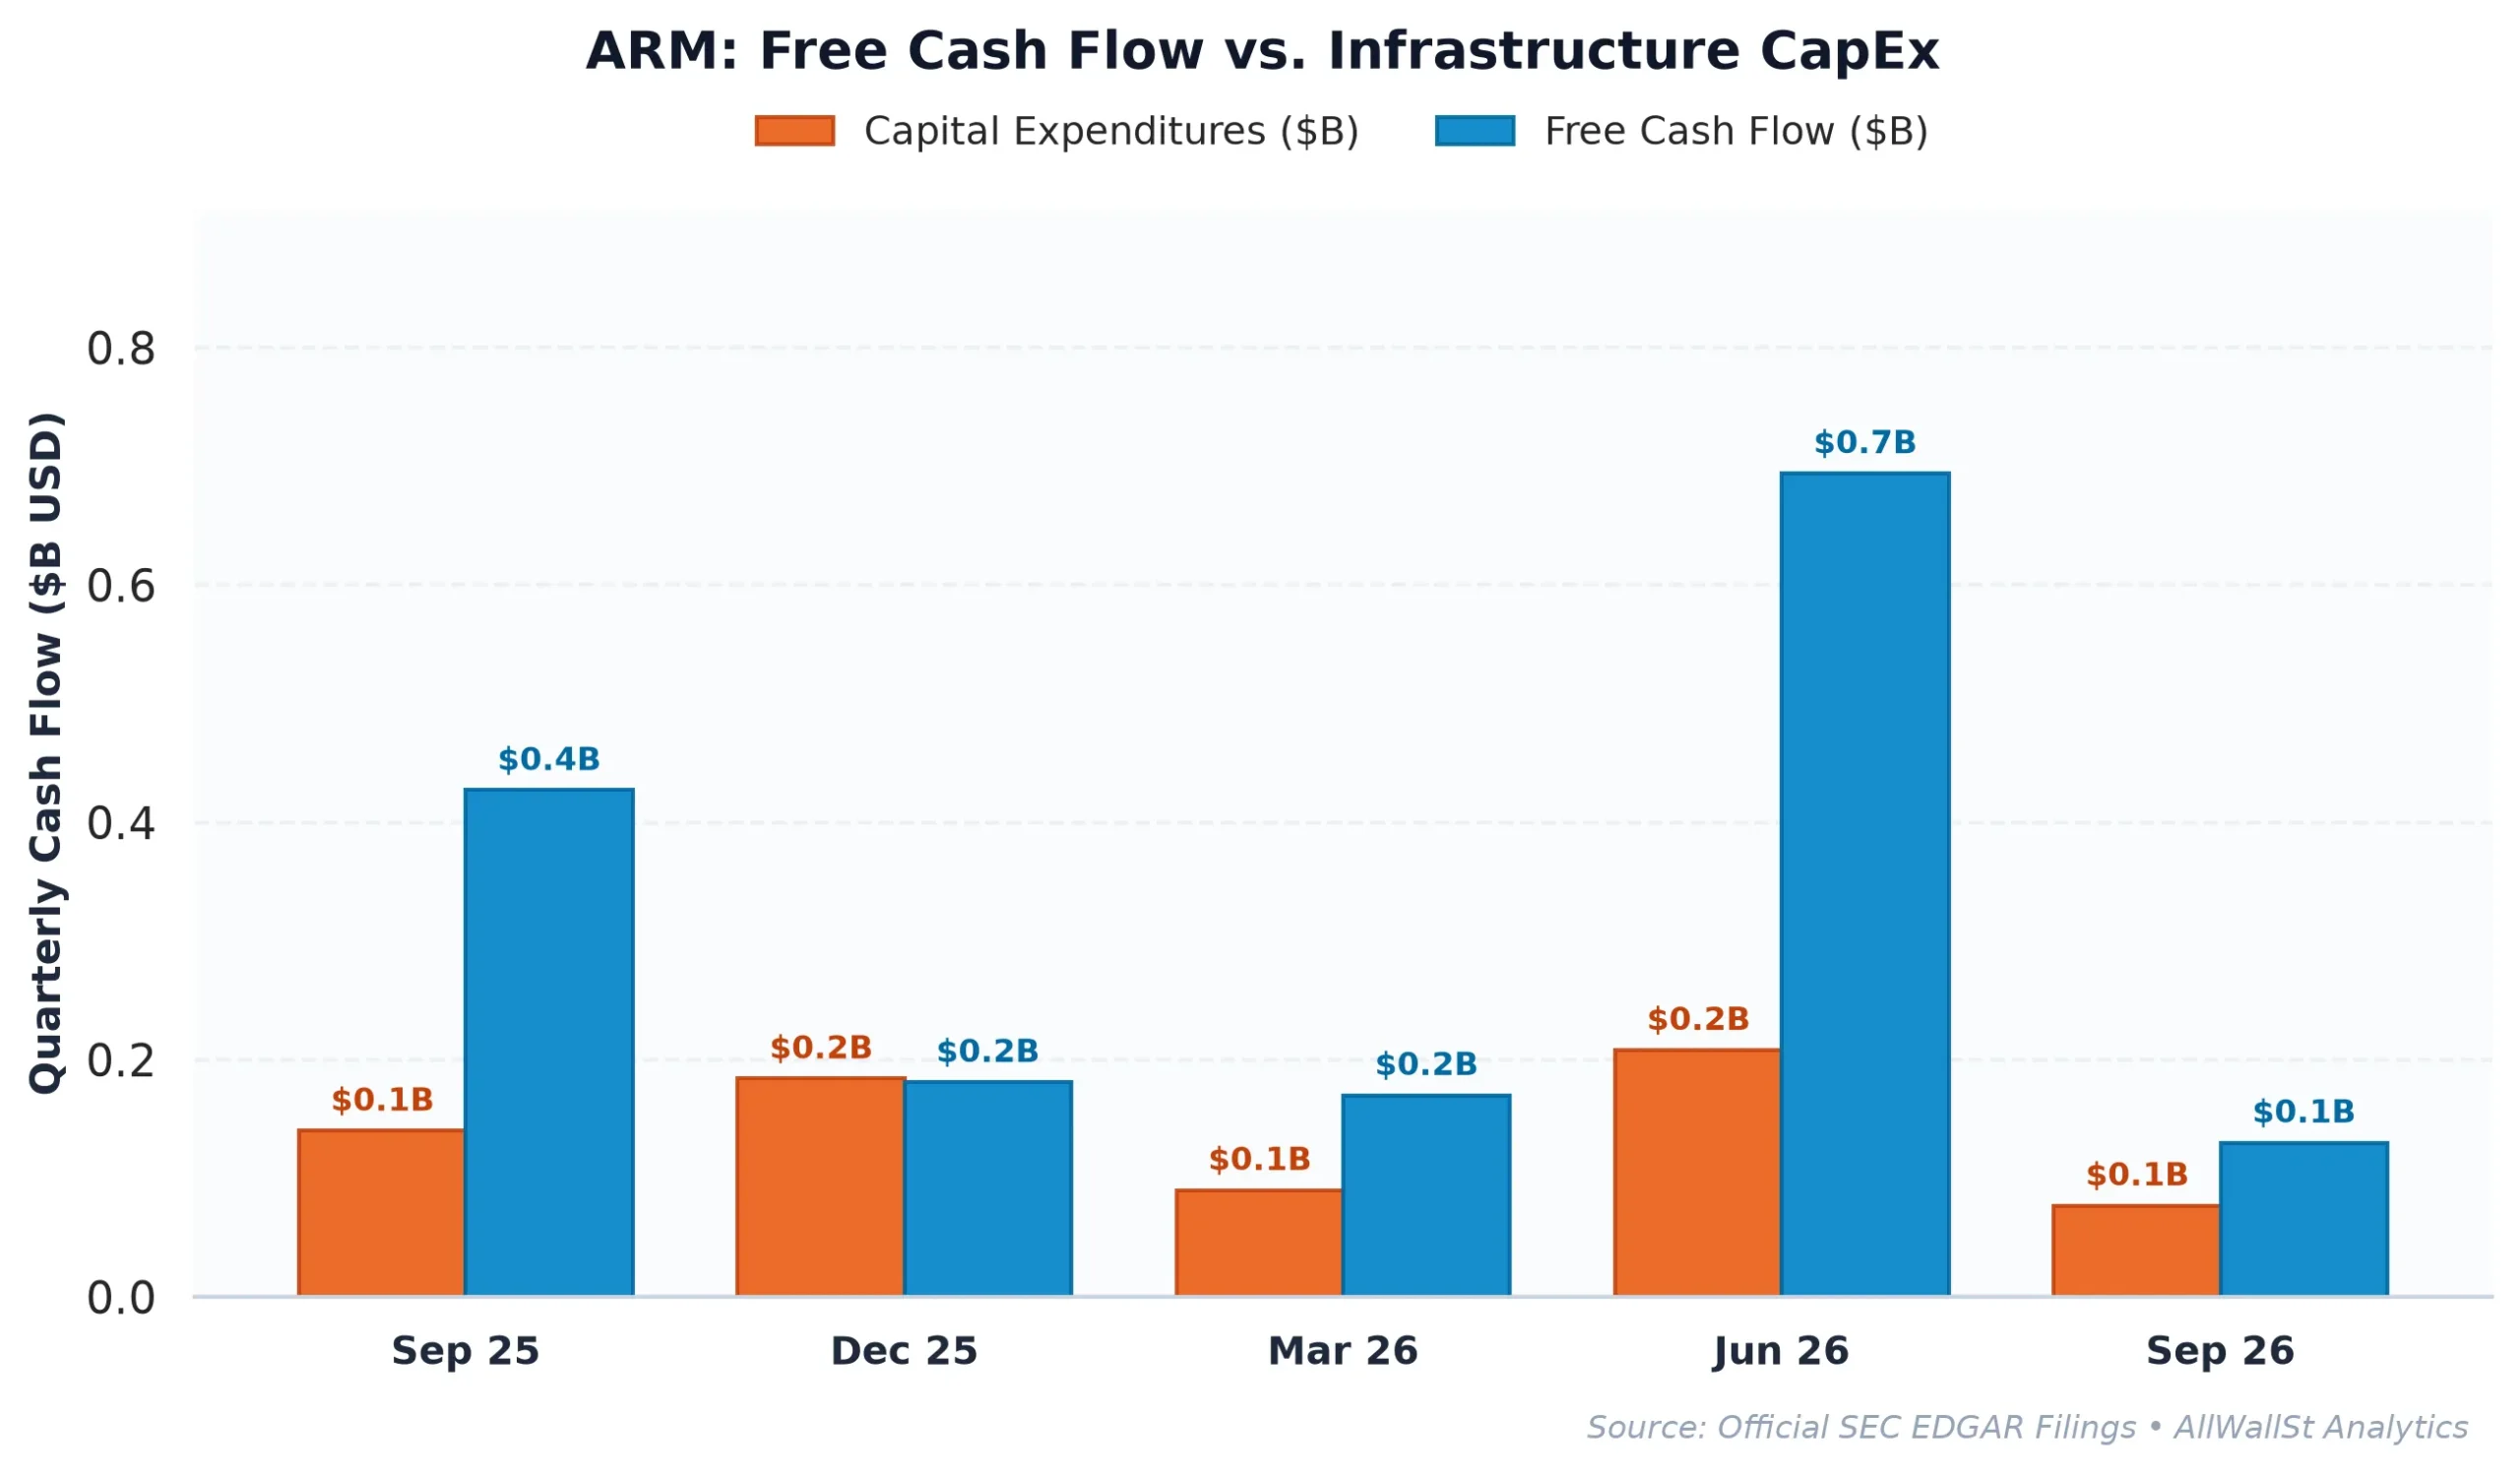
The situation becomes even more precarious when we examine Stock-Based Compensation (SBC). In FY2026, the company reported $1.05 billion in SBC, which represents a staggering 60.7% of its operating cash flow. In plain English, this means that for every dollar of cash the business generates from its operations, sixty cents are immediately handed back to employees in the form of new shares. This is not a “non-cash” expense in any economic sense: it is a real dilution of your ownership.
When we calculate Real Free Cash Flow (Net of SBC), the company generated a mere $0.09 billion last year. This results in a Real FCF Yield of 0.04%. To justify this, the company would need to grow its cash flow by 20% to 30% annually for the next two decades without any further dilution. While the company boasts an elite Rule of 40 score of 47.9%, the “40” is being carried by revenue growth while the cash flow margin remains under immense pressure from the cost of talent.
| Company (Ticker) | Market Cap | Forward P/E | EV/EBITDA | Rev Growth (YoY) | Operating Margin | FCF Yield |
|---|---|---|---|---|---|---|
| Arm Holdings plc (ARM) | $196.6B | 59.5x | 171.2x | 27.10% | 17.02% | 0.58% |
| Microsoft (MSFT) | $3.78T | 21.1x | 18.6x | 18.8% | 47.1% | 0.08% |
| Alphabet (GOOGL) | $3.49T | 18.7x | 18.0x | 24.7% | 33.3% | -0.03% |
| Oracle (ORCL) | $358.8B | 10.4x | 14.1x | 29.6% | 34.3% | -12.78% |
The peer comparison table highlights the absurdity of the current valuation. Microsoft (MSFT), a company with a 47.1% operating margin and its own massive AI tailwinds, trades at 21.1x forward earnings. Arm Holdings plc trades at 59.5x forward earnings and 171.2x EV/EBITDA. Even if you believe Arm is a superior business, it is difficult to argue it is three times as valuable per dollar of earnings as the world’s most successful software company.
Options Plumbing and the Risk of Gravity
The quantitative market structure for Arm Holdings plc reveals a market that is currently pinned by dealer positioning but vulnerable to a sharp unwind. The Max Pain strike is currently at $197.50, which is about 7.5% above the current price of $183.77. Max Pain is the price point where the largest number of options contracts expire worthless, often acting as a magnetic anchor during expiration weeks as market makers hedge their delta exposure.
The Put/Call Open Interest ratio stands at 0.73, indicating a relatively bullish skew. Retail and institutional speculators are heavily tilted toward upside calls, with primary resistance walls sitting at $200 and $225. However, the 30-day expected move is a massive +/- 23.14%. This high implied volatility suggests that the market is pricing in a binary outcome: either a massive breakout on AI data center news or a violent mean-reversion toward the put support at $155.
When a stock trades with this much “air” beneath its valuation, any slight disappointment in execution or a macro shift in the cost of capital can trigger a cascade. The negative 4.49% spread between the company’s FCF yield and the 10-Year Treasury yield means that investors are accepting a massive “negative carry” to own this stock. In a 5% interest rate world, that is a high price to pay for a story that has yet to show real, un-diluted cash flow compounding.
The Binding Verdict and Portfolio Suitability
We previously assigned a HOLD rating to Arm Holdings plc on October 7, 2026, when the stock was trading significantly higher at $294.37. While the price has corrected by over 37% since that thesis, the underlying fundamentals have not improved enough to bridge the valuation gap. In fact, the persistent rise in SBC and the stagnation of operating margins suggest that the “tollbooth” is becoming more expensive to maintain than previously modeled.
For institutional portfolios, the risk-reward profile is now skewed heavily to the downside. The company is a magnificent piece of engineering, but the stock is a speculative instrument trading on multiples that require perfection in perpetuity. We recommend a strict position sizing cap of 0.5% for high-conviction growth mandates and suggest that the current price levels offer an attractive exit point for those who have ridden the AI wave.
Investment Committee Steelman Dissent: If Arm Holdings plc successfully transitions its entire mobile base to v9 while simultaneously capturing 25% of the data center CPU market, the operating leverage could theoretically cause cash flow to triple in three years. In that scenario, the current 59x forward multiple would look cheap in retrospect as the company becomes the “Nvidia of IP.”
AllWallSt Investment Verdict: SELL (Downgrade from HOLD)
Arm Holdings plc (ARM)
Trailing P/E
Marcus Wolfe Screen
Leverage Profile
30D Channel
Dealer Gamma Pinning & Max Pain Alignment (ARM)
🎯 Max Pain: $197.50
Spot $183.76
Ceiling $200C Resistance ▲
Pristine cash flow conversion (1.69x) and healthy accrual ratio (-5.79%). Zero accounting anomalies detected (LOW ANOMALY RISK).
Fortress Balance Sheet (Net Cash Position; zero net refinancing distress).
Negative yield spread (-4.49% vs 5.06% Treasury); equity requires robust multiple expansion or growth.
Max Pain: $197.50 (+7.47%) | P/C Ratio: 0.73 | 30D Channel: $141.24 – $226.28. Dealer gamma bounded between $155 Put Wall and $200 Call Wall.
ARM carries standard index weighting (under 0.6% SPY footprint); sell-side consensus reflects standard earnings momentum rather than index-tracking mandates.
$196.00 – $204.00 (Call Wall Resistance Distribution Ceiling)
Sustained weekly close above $200.00 (Call Wall Resistance) or structural rebound in GAAP Free Cash Flow.
Bullish IC Dissent: Despite 211.2x trailing earnings and 0.58% FCF yield, Arm Holdings plc (ARM) could stage a sharp short-covering squeeze if management surprises with cost discipline, buyback acceleration, or stabilizing guidance above the $200 call wall. Consensus pessimism already prices in significant deterioration, creating asymmetric upside risk if credit spreads remain contained.
Sources & References
- SEC EDGAR Official Filings: https://www.sec.gov/edgar/browse/?CIK=0001973239
- Arm Holdings Investor Relations: https://www.arm.com
- SEC Form 6-K (November 4, 2026): https://www.sec.gov/Archives/edgar/data/1973239/000197323926000142/arm-20260930.htm
- SEC Form 20-F (Annual Report): https://www.sec.gov/Archives/edgar/data/1973239/000197323926000097/arm-20260331.htm
Disclaimer: This report is for informational purposes only and does not constitute investment advice. AllWallSt and its analysts are not registered investment advisors. Financial markets involve significant risk, and past performance is not indicative of future results. Always consult with a qualified financial professional before making investment decisions.