
Two Lawsuits, One Quiet Board Shuffle, and $30.76 Billion of Cushion
Running a mega-bank means you can turn in a clean quarterly report card and still spend your weekend reading federal class-action headlines.
On November 14, 2026, reports flagged a new investor class action tied to Bank of America Corporation’s (BAC) prior $1.2 billion Treasury-market penalty, followed on November 15 by news that the bank agreed to settle claims alleging unauthorized account openings. Set beside an October 21 Form 8-K showing management added industrial and audit veterans Jim Fitterling and Bill Thomas to the board, the news cycle reads like classic Wall Street stagecraft: look at our shiny new governance committee, please, not the legal clean-up aisle behind the curtain.
Here is the math investors actually care about. Even taken at its full headline sticker price, a $1.2 billion legal bill equals less than 4% of Bank of America’s $30.76 billion in trailing twelve-month net income, and roughly 5% of the cash management spent buying back shares last year. For an empire printing more than $30 billion a year, isolated legacy settlements act more like an annoying parking ticket than a threat to your dividend.
At $51.02 a share, Wall Street is offering that earnings machine at less than ten times expected next-year profits.
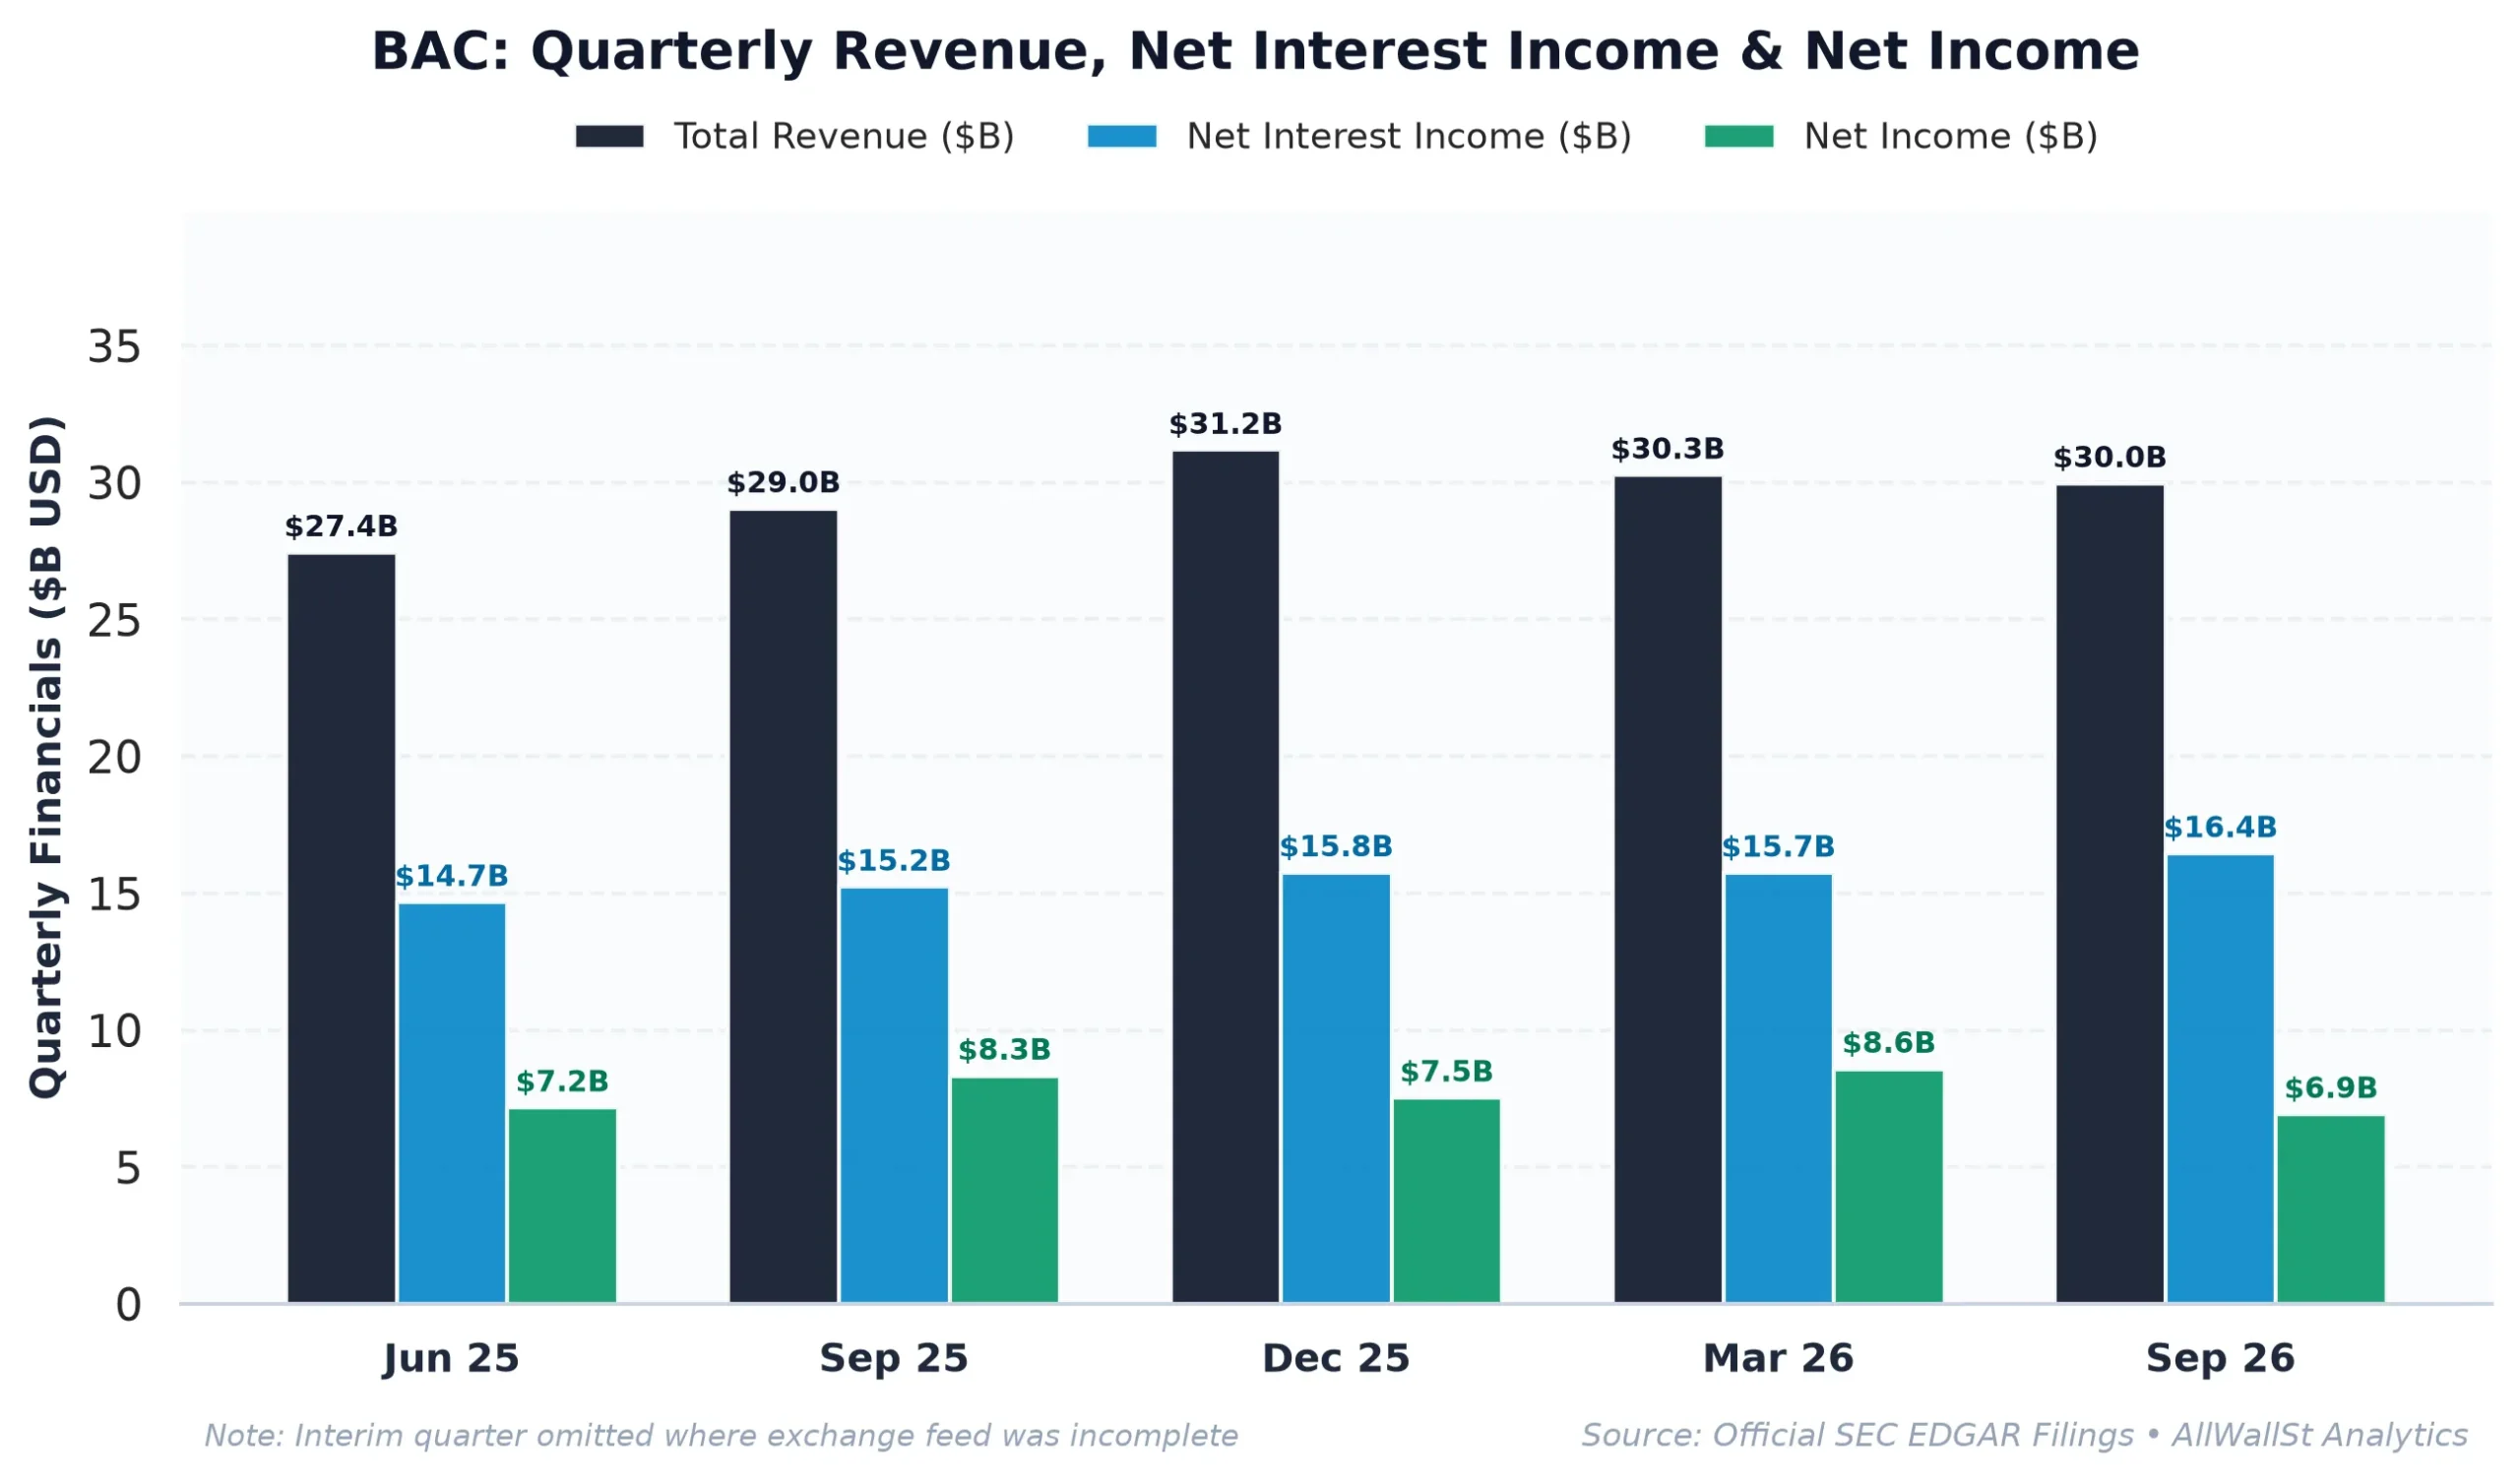
How a Mega-Bank Prints Money (Without “Free Cash Flow”)
Trying to judge Bank of America with standard “Free Cash Flow” math is a rookie trap. When millions of customers shift checking and corporate deposits around on a Friday afternoon, those swings make a bank’s operating cash statement look booming or busted on paper, even though the bank simply owes that money right back to depositors on Monday.
What actually pays shareholders is much simpler. Strip away the plumbing, and a commercial bank is a giant spread business: it collects deposits, lends or invests them out, and pockets the difference (Net Interest Income, or NII).
| Period | Revenue | Net Interest Income | Pretax Income | Net Income | Net Margin | SBC Expense |
|---|---|---|---|---|---|---|
| FY2022 | $94.95B | $52.46B | $30.97B | $26.02B | 27.4% | $2.86B |
| FY2023 | $102.77B | $56.93B | $32.53B | $24.66B | 24.0% | $2.94B |
| FY2024 | $105.86B | $56.06B | $33.22B | $25.34B | 23.9% | $3.43B |
| FY2025 | $113.10B | $60.10B | $37.70B | $29.05B | 25.7% | $4.00B |
The table above tells the real story far better than noisy quarterly headlines. Since FY2022, annual Net Interest Income climbed steadily from $52.46 billion to $60.10 billion in FY2025, lifting trailing net profit margin to 28.06% as confirmed in the October 30, 2026 Form 10-Q.
New bank investors often spot $820.67 billion of cash sitting against $759.20 billion of debt on the balance sheet and assume it works like Apple’s net cash hoard. It doesn’t, because a bank’s cash mostly backs customer deposits and Basel III capital cushions. What is genuinely yours as a shareholder is the 9.36% combined cash yield from dividends and buybacks over the past year ($24.10 billion in repurchases alone), easily soaking up $4.00 billion in annual employee stock compensation more than six times over.
Why Paying 1.30x Book Looks Like a Fair Bargain
Bank stocks rarely trade on hype; they trade on Price-to-Book (P/B) and Return on Equity (ROE). Think of Price-to-Book as what you pay for every dollar of net assets sitting on the balance sheet, while ROE measures how efficiently management turns each dollar of shareholder equity into annual profit.
| Company (Ticker) | Market Cap | Forward P/E | P/B | ROE | Rev Growth (YoY) | Dividend Yield |
|---|---|---|---|---|---|---|
| Bank of America (BAC) | $352.0B | 9.8x | 1.30x | 10.73% | 3.40% | 2.51% |
| JPMorgan Chase & Co. (JPM) | $919.3B | 13.5x | 2.62x | 18.01% | 10.2% | 1.91% |
| Wells Fargo & Company (WFC) | $258.3B | 10.8x | 1.63x | 12.91% | 0.4% | 2.32% |
| Citigroup (C) | $205.3B | 9.5x | 1.07x | 9.35% | 8.0% | 2.16% |
Notice the clear pecking order in the table above. JPMorgan Chase & Co. earns the richest price tag (2.62x book) because its 18.01% ROE laps the field, while Citigroup sits near tangible equity while working through a multi-year overhaul.
Bank of America occupies the sweet spot in the middle. You are paying 1.30x book value and 9.8x forward earnings, roughly a 27% discount to JPMorgan, for a franchise generating a durable 10.73% ROE that easily clears the 5.15% risk-free US 10-Year Treasury yield. Closing even half of that valuation gap doesn’t require Silicon Valley growth heroics; it just requires steady rate spreads and fewer Saturday morning legal headlines.
What the Options Crowd Expects (and Why HOLD Moves to BUY)
Even the options market is calmer than the weekend lawsuits suggest. In plain English, large options dealers continuously hedge their books around heavy contract strikes, which tends to turn crowded Put Walls (clusters of downside protection contracts) into soft price floors and Call Walls into temporary ceilings.
Right now, those guardrails bracket Bank of America cleanly, with put support stacked at $50.00 (25,850 contracts) and call resistance overhead at $55.00 (21,429 contracts). Monthly Max Pain (the strike price where the largest dollar value of expiring options finishes worthless into expiration) sits right above spot at $52.00 (+1.92%), backed by a balanced 0.84 Put/Call open-interest ratio across 181,929 calls and 153,615 puts.
Because pre-market option quotes often carry wide placeholder spreads before the 9:30 AM opening bell, anchoring 30-day implied volatility to verified closing option prints gives a realistic 20.03% reading that closely tracks the 20.39 ^VIX fear gauge and BAC’s 1.19 beta. That implies a contained +/-$2.93 ($48.09 to $53.95) 30-day trading range tucked neatly inside those dealer walls.
Checking back on our call from 21 days ago (October 26, 2026 at $51.14), when we kept BAC at HOLD in “Bank of America and the Billion Dollar Rounding Error”, shares have held flat (-0.2%) while the earnings floor firmed up. With Q3 Form 10-Q filings confirming $30.76 billion in trailing net profit, a 9.36% capital return yield nearly double Treasury rates, and weekend legal settlements easily absorbed by operating cash generation, we are upgrading BAC from HOLD to BUY near the $50 support wall.
Investment Committee Steelman Dissent: A sustained rise in the 10-Year Treasury yield above 5.25% could accelerate retail deposit migration into higher-yielding money market funds, raising deposit costs and compressing net interest margins. In addition, expanded CFPB enforcement around consumer account practices or higher-than-modeled class-action reserves could weigh on non-interest fee growth and cap near-term multiple expansion above 1.30x book.
AllWallSt Investment Verdict: BUY (Upgrade from HOLD)
Bank of America Corporation (BAC)
Trailing P/E
Marcus Wolfe Screen
Leverage Profile
30D Channel
Dealer Gamma Pinning & Max Pain Alignment (BAC)
🎯 Max Pain: $52.00
Spot $51.02
Ceiling $55C Resistance ▲
Banking liquidity & regulatory capital compliant (Basel III / CET1 governed); deposit & trading settlement flows normalized.
Tier 1 Regulatory Capital & Liquidity Coverage Ratio (LCR) compliant; balance sheet governed by Basel III capital buffers.
Evaluated against 5.15% US 10-Yr Benchmark; bank net interest margins sensitive to yield curve slope (2s10s spread) and deposit beta.
Max Pain: $52.00 (+1.92%) | P/C Ratio: 0.84 | 30D Channel: $48.09 – $53.95. Dealer gamma bounded between $50 Put Wall and $55 Call Wall.
BAC represents a core ~0.6% index pillar. Institutional managers face persistent benchmark drag if under-allocated during sector rallies, biasing sell-side consensus toward institutional overweight.
$49.00 – $51.00 (Options Support Pinning)
Sustained weekly close below $50.00 (Put Wall) or compression in ROE and net interest margins.
Bearish IC Dissent: At 12.2x trailing earnings and 10.73% ROE (1.30x P/B) against a 5.15% 10-year risk-free hurdle, Bank of America Corporation (BAC) leaves limited cushion for top-line deceleration or net interest margin and credit quality compression. If institutional flows break below the $50 put wall, dealer de-hedging can accelerate multiple contraction before fundamental buyers step in.
Investigative Reporting & Public Record Sourcing: Dispatches published under Word on Wall St constitute financial news reporting, investigative journalism, and market commentary on matters of public and economic interest. Information is synthesized from publicly available regulatory filings (including SEC Form 8-K, Form 10-K, and Form 10-Q disclosures), official corporate press communications, verified news reports, and discussions with institutional market participants.
Presumption of Innocence & Unadjudicated Allegations: Any references to executive conduct, personal relationships, workplace misconduct, whistleblower claims, espionage inquiries, internal governance reviews, or government investigations represent reported allegations and active inquiries as of the publication date. They do not constitute formal judicial determinations, legal verdicts, or findings of guilt, civil liability, or statutory wrongdoing unless expressly identified as adjudicated final court judgments.
Protected Editorial Commentary & Non-Investment Counsel: All quantitative scenario analyses, key-person risk haircuts, forward valuation estimates, dealer gamma pinning levels, and investment conviction ratings reflect protected analytical opinion, editorial commentary, and financial modeling under the First Amendment. Nothing herein constitutes legal counsel, personal tax advice, or individualized investment advice. AllWallSt and its contributors assume no liability for trading, investment, or commercial decisions taken on the basis of this report.
Sources & References
- Official SEC Form 10-K Annual Report (Filed 2026-02-25)
- Official SEC Form 10-Q Quarterly Report (Filed 2026-10-30)
- SEC EDGAR: BANK OF AMERICA CORP /DE/ Complete Filing History
- Bank of America Form 8-K (Item 5.02 Board Disclosures, Oct 21, 2026)
- Bank of America Form 8-K (Oct 23, 2026)
- Yahoo Finance (Nov 15, 2026): Bank Of America Agrees To Settle Unauthorized Account Openings Class Action
- Yahoo Finance (Nov 14, 2026): Bank of America $1.2B Treasury Fine Sparks Investor Class-Action Suit
- Bank of America Investor Relations Portal: Bank of America Investor Relations
Financial Journalism Disclaimer: The information provided in this article is for educational and informational purposes only and does not constitute financial, investment, or legal advice. AllWallSt is an independent financial publishing group. Past performance is no guarantee of future results. Always perform independent research and consult a licensed financial advisor before making capital allocation decisions.