
Broadcom Inc. (AVGO) has spent the last year convincing the market that it is the indispensable plumbing of the generative AI era. If Nvidia is the engine, Broadcom is the transmission, the chassis, and the high-speed toll road all at once. The stock has enjoyed a massive run, yet some corners of the financial internet still insist it is a bargain. This is a bold claim for a company trading at 43 times trailing earnings, even if the forward multiples suggest a more digestible 16.5x.
The fundamental tension here is not about whether Broadcom makes good chips. It clearly does. The tension is about the price of admission. In a world where the US 10-Year Treasury yield sits at 4.99%, the hurdle for owning equity has shifted from “is this a good business?” to “does this business pay me more than Uncle Sam?”
The Cost of Being an AI Titan
When we look at the capital structure of Broadcom, the math becomes a bit uncomfortable for the valuation purist. The company currently generates a Free Cash Flow yield of 1.99%. When you compare that to the 4.99% yield on the 10-Year Treasury, you find an Equity Risk Premium spread of negative 3.00%.
In simpler terms, investors are paying a 300-basis-point “convenience fee” to own Broadcom equity instead of risk-free government debt. To justify this, you have to believe that Broadcom’s growth will not just continue, but accelerate to a degree that offsets the gravity of a 5% discount rate. While revenue growth of 85.5% year-over-year is staggering, much of that is the inorganic fruit of the VMware acquisition. The organic question remains: how much juice is left in the AI networking squeeze?
Friction in the Plumbing
Beyond the macro yield gap, there are subtle frictions appearing in the financial statements. A close read of the latest regulatory filings shows that receivables growth has outpaced revenue growth by more than 15%. Simultaneously, inventory growth is outrunning the cost of goods sold by a similar margin.
In the high-stakes world of custom AI silicon, these are often early warning signs. It suggests that while Broadcom is shipping product, the cash is taking a bit longer to arrive at the door, and finished goods are stacking up in the warehouse. If this is merely a result of the complex VMware integration, it is a footnote. If it represents a cooling in demand for bespoke AI accelerators, it is a structural problem for a company with $59.4 billion in total debt.
The Friday OpEx Pin
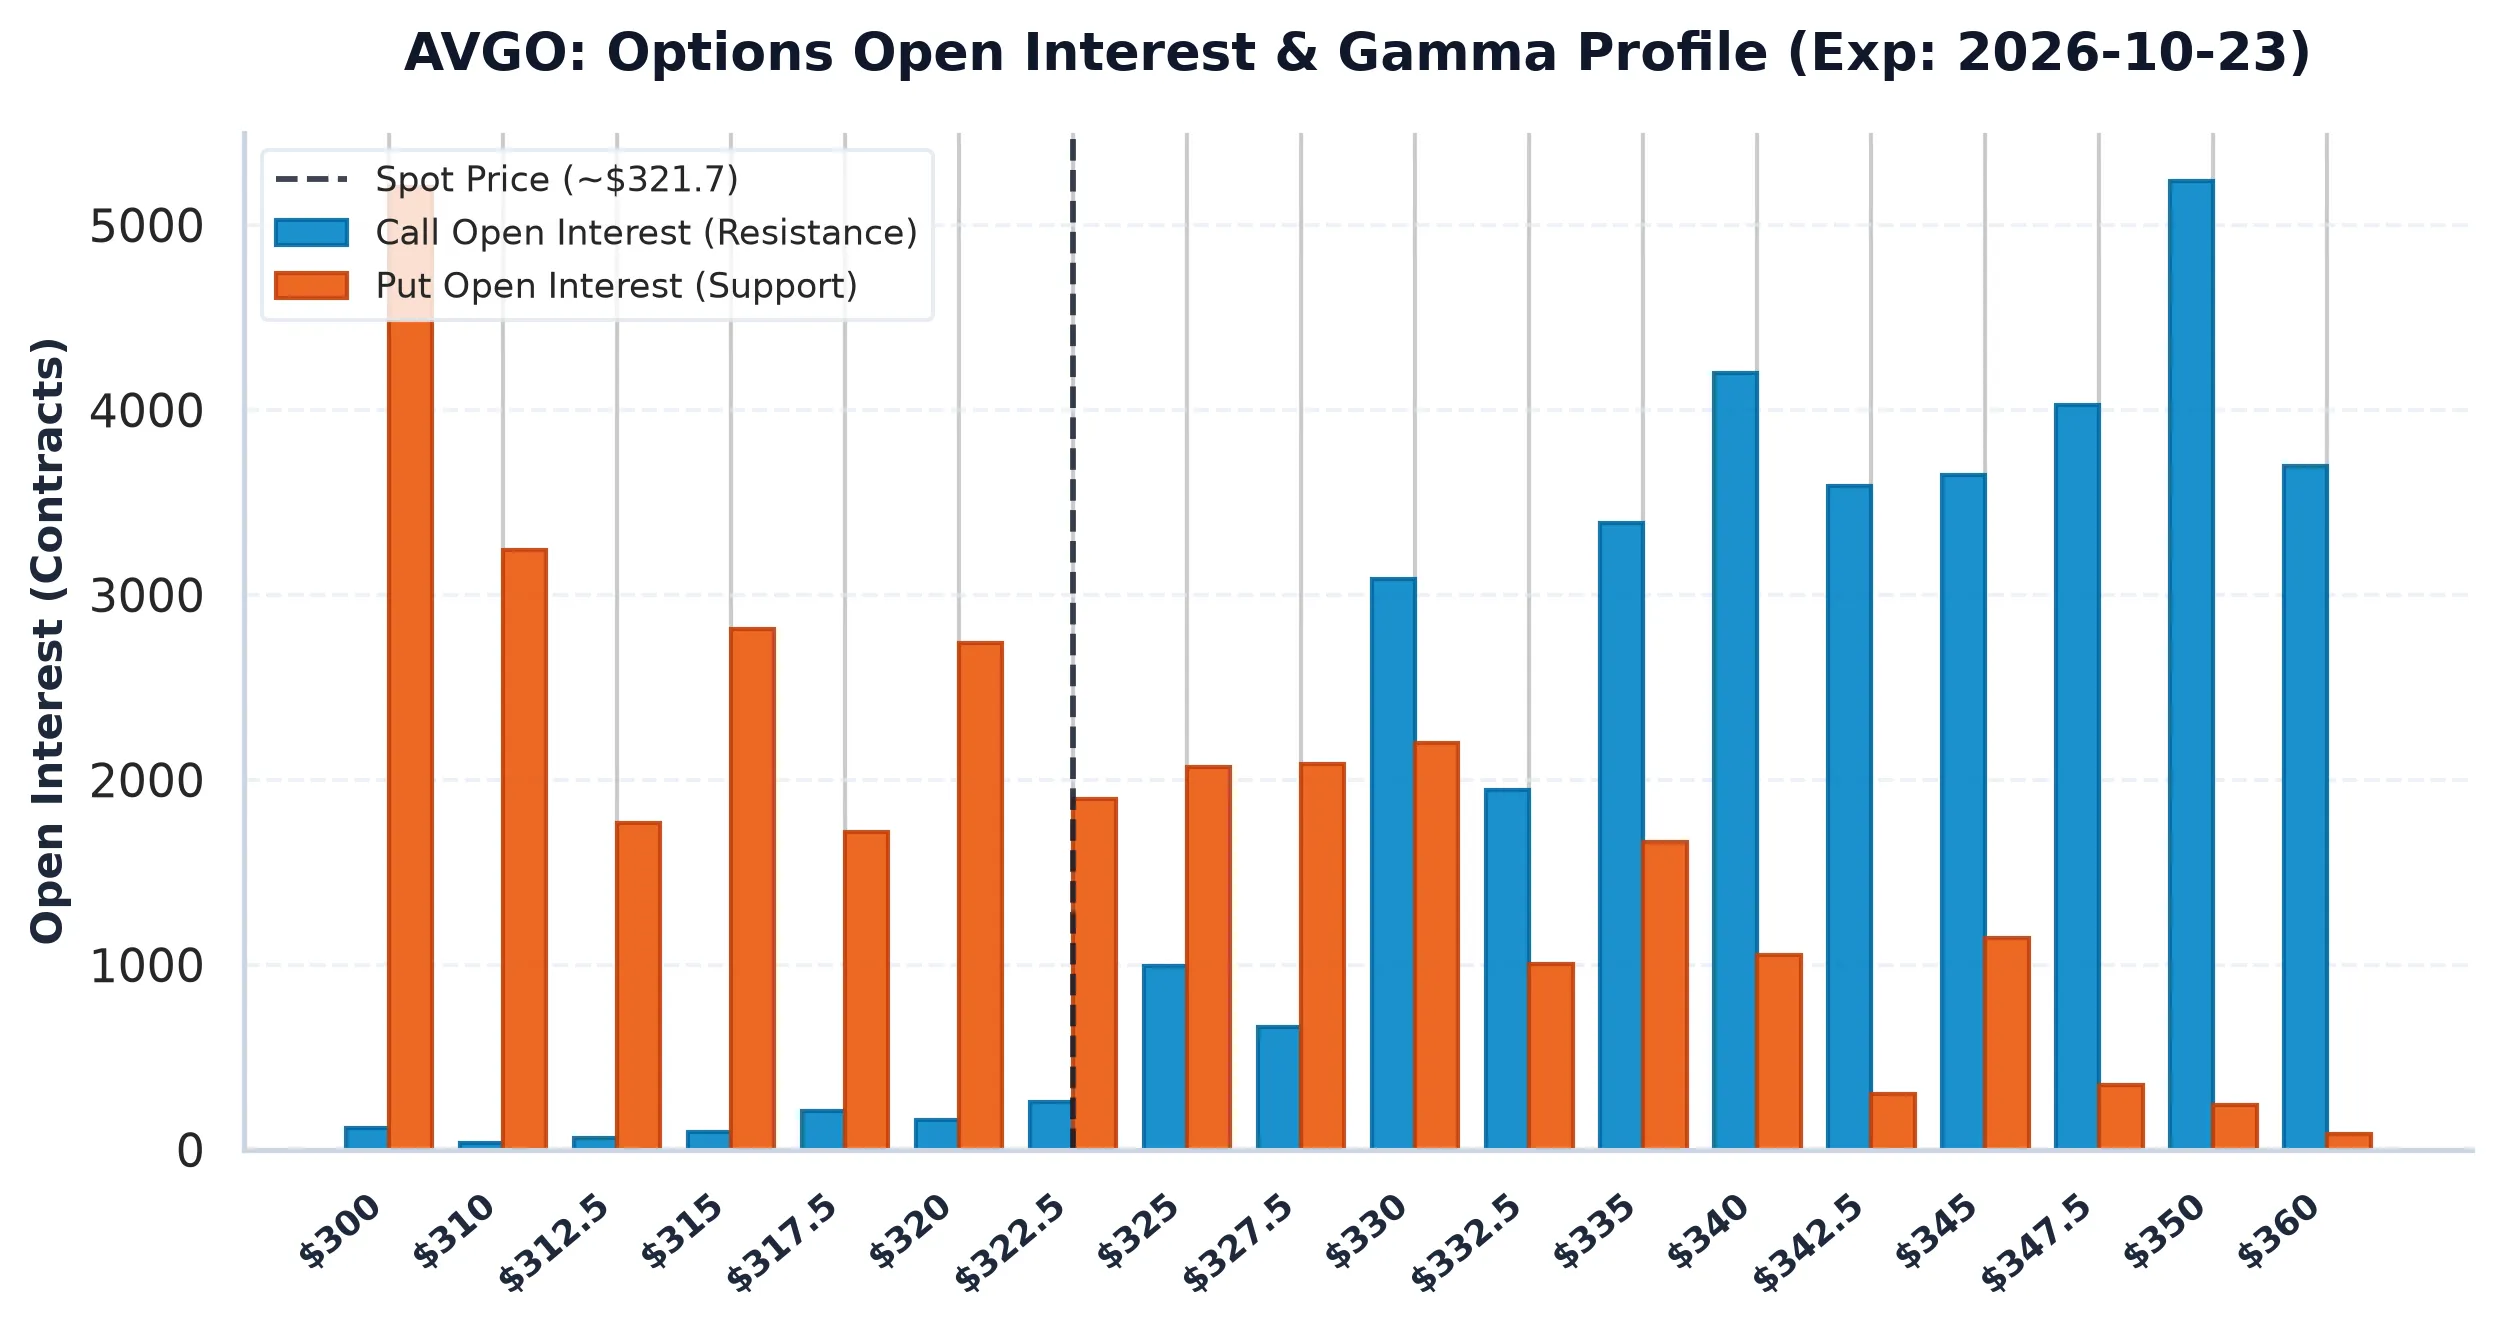
The market structure for Broadcom heading into the weekend tells a story of speculative exhaustion. The Put/Call Open Interest ratio is sitting at 0.62, which indicates a heavy lean into upside calls. Retail and institutional speculators alike have crowded into the long side of the boat.
This creates a specific mechanical problem for market makers. Dealers are currently short these calls and must hedge by holding the underlying stock. However, the stock is currently trading at $321.68, while the Max Pain strike sits at $332.50. This 3.36% gap suggests that the options market is pulling the price upward, but the heavy Call Walls at $340 and $350 act as a formidable ceiling.
If the price fails to break through those walls, the time decay of those speculative calls will force dealers to unwind their long hedges. This is the “long liquidation” risk: the stock does not fall because of bad news, but because the options market simply ran out of time.
Institutional Verdict
Broadcom remains a premier operator with a dominant position in the high-end networking and custom ASIC markets. However, the combination of a negative 300-basis-point yield spread against Treasuries and growing working capital friction suggests that the “bargain” narrative is premature. We are watching the $310 Put Wall as the primary structural floor. A breach there would signal that the speculative call overhang has finally collapsed.
| Metric | Institutional Value |
|---|---|
| AllWallSt Investment Verdict | HOLD |
| Current Price | $321.68 |
| Max Pain Strike | $332.50 |
| FCF Yield Spread | -3.00% |
| Risk Profile | Speculative Call Overhang |
Broadcom Inc. (AVGO)
Trailing P/E
Marcus Wolfe Screen
Leverage Profile
30D Channel
ELEVATED CONCERN (2 flags): Receivables growth outstripped revenue growth by >15%, pointing to potential revenue recognition or collection friction. Inventory growth outpaced COGS growth by >15%, signaling potential inventory bloat or pending margin compression.
Manageable liability structure relative to institutional cash flow.
Evaluated against 5.10% US 10-Yr Benchmark (FCF Spread: -3.00% (vs 10Y Yield of 4.99%)).
Max Pain: $332.50 (+3.36%) | P/C Ratio: 0.62 | 30D Channel: $298.62 – $344.74.
$295.95 – $308.81 (-4% to -8% Pullback Accumulation)
Sustained weekly close below $289.51 (-10.0% structural stop) or fundamental cash flow deterioration.