
Corporate finance, when stripped of its pitch decks and investor conferences, is mostly about establishing an inescapable tollbooth. If you own a bridge that everyone must cross, you do not need to invent the future; you simply need to raise the toll every October.
Few executives understand this better than Hock Tan. Over the past decade, Broadcom Inc. (AVGO) transformed from an aggressive roll-up of legacy semiconductor assets into the undisputed gatekeeper of enterprise infrastructure. With the acquisition of VMware fully digested and custom artificial intelligence application-specific integrated circuits (ASICs) driving record volumes, Broadcom has positioned itself as the tax collector for both legacy corporate data centers and futuristic hyperscale compute clusters.
Yet, as global trading desks prepare for the week ahead, the macro tape tells a more complicated story. With the S&P 500 easing 1.11% to $763.25 and the Nasdaq 100 dropping 2.50% to $709.80, equity risk appetite is meeting a formidable barrier: a benchmark 10-Year Treasury yield hovering at 5.10%. When sovereign paper pays over five percent with zero credit risk, owning high-multiple semiconductor titans demands intense operational perfection.
The Sovereign Hurdle: Negative Equity Spreads
At $328.75 per share, Broadcom commands an enterprise value of $1.60 trillion on trailing twelve-month revenue of $89.10 billion. The headline growth rate of 85.50% year-over-year is undeniably spectacular, reflecting the consolidation of VMware alongside booming demand for custom silicon from hyperscalers like Alphabet and Meta. Gross margins sit at an enviable 75.52%, with operating margins holding at 54.31%.
The fundamental friction lies in the cash discount rate. Broadcom generated $30.60 billion in free cash flow over the past twelve months, delivering a Free Cash Flow Yield of exactly 1.95%.
Compare that to the broader macroeconomic baseline. With the 10-Year Treasury yielding 5.10%, Broadcom trades at a negative equity risk spread of -3.15%. In plain English, an equity investor is accepting operational risk, execution risk, and supply-chain exposure while pocketing 315 basis points less in cash return than Uncle Sam offers on risk-free sovereign debt.
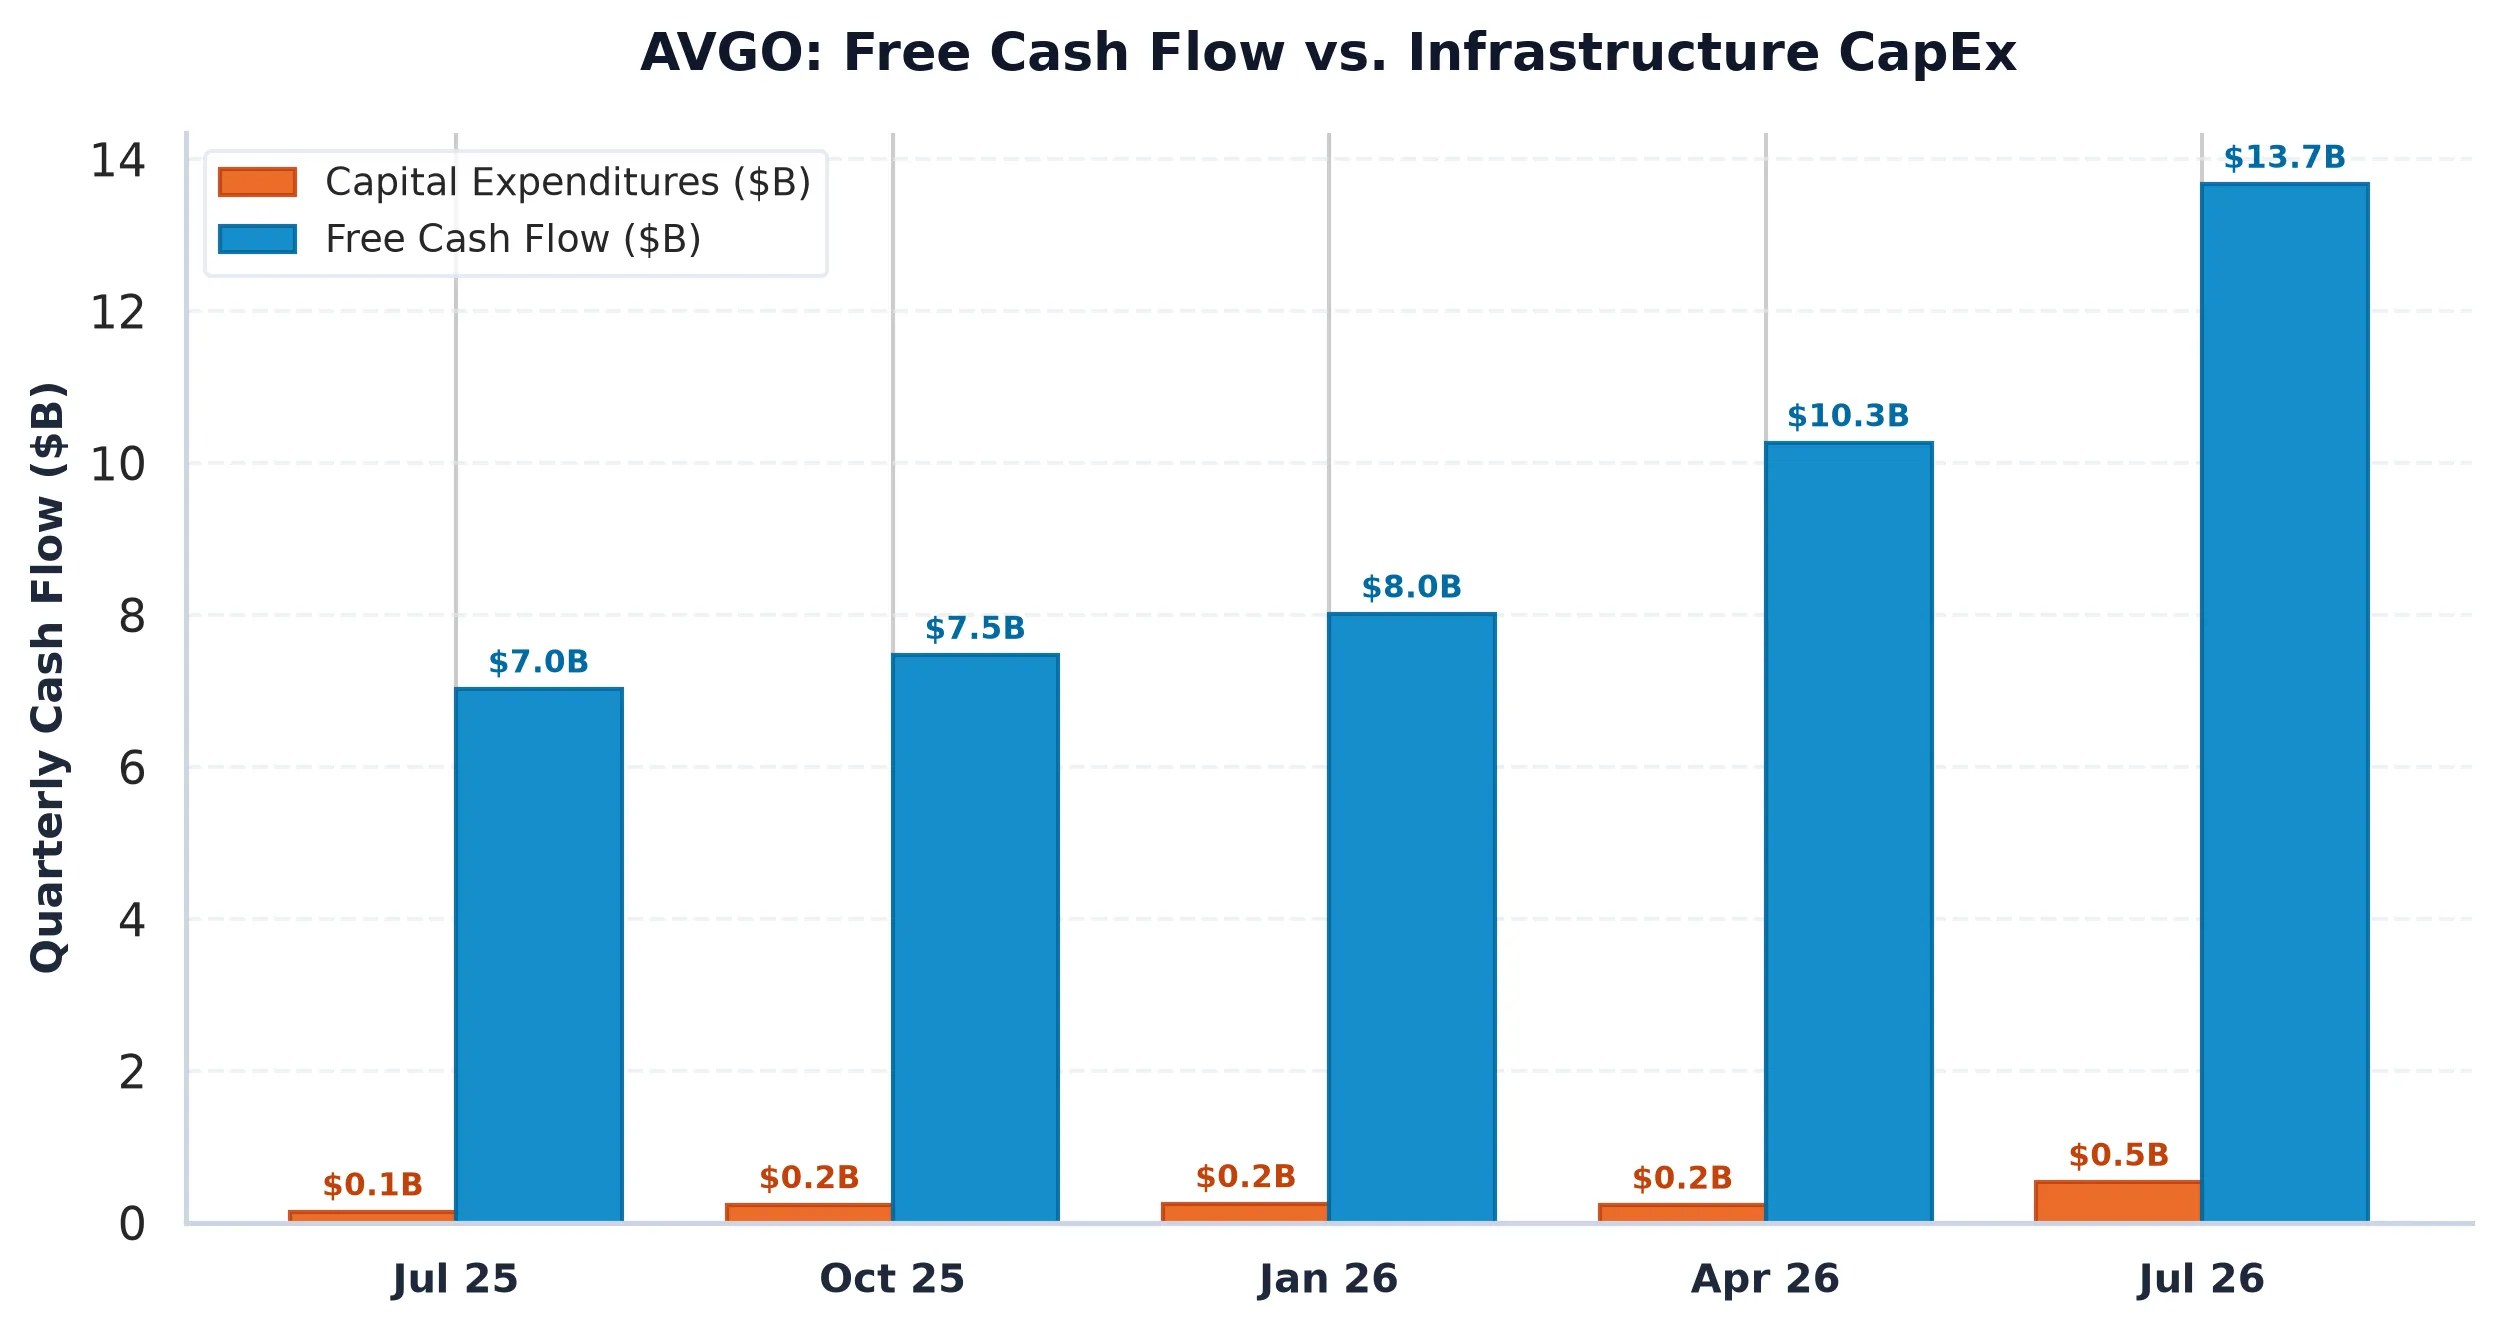
While bulls will point to the forward price-to-earnings ratio of 16.95 and a PEG ratio of 0.33, Broadcom trades at an EV/EBITDA of 30.71 and an EV/Revenue multiple of 18.01. To justify this valuation in an elevated interest rate regime, capital expenditures cannot stumble. Broadcom deployed $10.06 billion in CapEx over the trailing twelve months, representing a capital intensity ratio of 11.29%. In a low-rate world, deploying ten billion dollars to maintain market leadership is routine. In a five-percent world, that capital must generate immediate, compounding returns.
Forensic Friction: The Working Capital Divergence
Broadcom’s reported conversion of operating cash flow to net income looks pristine at 1.19x, supported by an aggregate accrual ratio of -2.58%. However, a closer look at recent Form 10-Q disclosures filed with the Securities and Exchange Commission reveals subtle operational strain in working capital.
Two forensic red flags have emerged over recent quarters:
First, accounts receivable growth outstripped quarterly top-line revenue growth by more than 15 percentage points. When receivables stretch faster than sales, it suggests either that enterprise customers are negotiating extended payment terms or that Broadcom is offering aggressive vendor financing to accelerate custom silicon deployments into hyperscale data centers.
Second, inventory balances expanded faster than the cost of goods sold by more than 15 percentage points. Broadcom operates a fabless model, relying heavily on Taiwan Semiconductor Manufacturing Co. for advanced wafer fabrication and packaging. A sharp accumulation of work-in-progress inventory can mean one of two things: management is prudently stockpiling high-cost sub-assemblies to satisfy an insatiable backlog of custom AI accelerators, or finished silicon is beginning to accumulate ahead of a seasonal deceleration in enterprise networking spend.
Neither issue indicates financial distress. Broadcom carries $23.98 billion in cash against $59.42 billion in total debt, leaving net debt at $35.44 billion. Thanks to massive cash flow generation, net debt to EBITDA stands at a comfortable 0.68x. Still, working-capital expansion acts as a direct drag on near-term cash conversion. When accounts receivable and inventory consume cash, the free cash flow cushion shrinks.
Options Plumbing: The $350 Max Pain Magnet
While fundamental analysts debate the durability of custom ASIC margins, the derivatives market has established a very defined liquidity channel heading into the weekly options cycle.
According to institutional options positioning across the front-month expirations, Broadcom displays a Put/Call Open Interest ratio of 0.65. Total call open interest sits at 62,864 contracts against 41,090 put contracts, signaling a speculative upside skew.
================================================================================
BROADCOM INC. (AVGO) OPTIONS MARKET ARCHITECTURE
================================================================================
Spot Price:                     $328.75
Put/Call Open Interest Ratio:   0.65 (Bullish/Speculative Skew)
At-The-Money Implied Vol:       41.74%
30-Day Expected Move:           +/- $39.35 (+/- 11.97%)
Max Pain Strike:                $350.00 (+6.46% from spot)

Key Gamma Resistance (Call Walls):
  - $345 Strike:                3,932 contracts (Initial hurdle)
  - $370 Strike:                6,430 contracts (Primary Call Wall)
  - $380 Strike:                4,589 contracts (Secondary Call Wall)

Key Gamma Support (Put Walls):
  - $345 Strike:                2,975 contracts (Transitional pivot)
  - $330 Strike:                2,589 contracts (Primary Put Wall)
  - $350 Strike:                2,542 contracts (Structural floor)
================================================================================
The options architecture reveals a distinct dynamic. The dominant Max Pain strike sits at $350.00, roughly 6.46% above the current spot price of $328.75. In neutral dealer gamma conditions, market makers delta-hedge their books by purchasing underlying shares as spot moves toward high-concentration pin levels into expiration.
Immediate overhead resistance is defined by heavy call open interest at the $345 strike, followed by the primary Call Wall at $370 (6,430 contracts) and $380 (4,589 contracts). On the downside, dealer bid support establishes a floor at the $330 Put Wall (2,589 contracts).
With an at-the-money implied volatility of 41.74%, the options market prices in a 30-day expected move of $39.35 in either direction (an 11.97% dispersion band). This implied volatility reflects heightened sensitivity to macroeconomic debt auctions, Federal Reserve commentary, and cross-asset turbulence in the tech sector.
Capital Allocation and the Strategic Horizon
Hock Tan’s strategic playbook has always been straightforward: buy high-margin enterprise infrastructure with sticky recurring revenues, eliminate redundant corporate overhead, and harvest operating cash flow to reward equity holders via dividends and debt paydown.
The integration of VMware provides Broadcom with a recurring software subscription base that acts as a ballast against the cyclicality of merchant silicon. At the same time, the company’s custom AI accelerators (XPUs) allow hyperscalers to reduce their dependence on merchant GPU suppliers. Broadcom does not need to win every design contest; it simply needs to remain the premier partner for hyper-scale enterprises that want custom, proprietary silicon.
Yet, valuation discipline cannot be dismissed. When a company’s free cash flow yield sits below 2.0% while the risk-free rate stands at 5.10%, multiple expansion requires uninterrupted acceleration. With 473 Form 4 insider filings recorded in recent disclosures, corporate leadership has shown a steady cadence of equity liquidation rather than aggressive open-market buying.
Broadcom remains an elite, highly defensive monopoly on data center connectivity and custom computing. However, until working-capital friction resolves and the cash yield re-establishes a sensible premium over sovereign debt, broad multiple expansion will remain capped by the realities of modern capital costs.
Broadcom Inc. (AVGO)
Trailing P/E
Marcus Wolfe Screen
Leverage Profile
30D Channel
ELEVATED CONCERN (2 flags): Receivables growth outstripped revenue growth by >15%, pointing to potential revenue recognition or collection friction. Inventory growth outpaced COGS growth by >15%, signaling potential inventory bloat or pending margin compression.
Manageable liability structure relative to institutional cash flow.
Evaluated against 5.10% US 10-Yr Benchmark (FCF Spread: -3.15% (vs 10Y Yield of 5.10%)).
Max Pain: $350.00 (+6.46%) | P/C Ratio: 0.65 | 30D Channel: $305.19 – $352.31.
$302.45 – $315.60 (-4% to -8% Pullback Accumulation)
Sustained weekly close below $295.88 (-10.0% structural stop) or fundamental cash flow deterioration.