
The current market regime is defined by a desperate search for the adult in the room. As NVIDIA grapples with a leadership crisis and the logistical gymnastics of its Blackwell rollout, institutional capital has reflexively pivoted toward Broadcom Inc. (AVGO). The narrative is seductively simple: if you want exposure to the AI build-out without the single-point-of-failure risk of a celebrity CEO or the volatility of a GPU-only story, you buy the networking titan. Broadcom Inc. provides the switches, the custom silicon (ASICs), and the software glue that makes massive data centers actually function.
This safety-trade narrative pushed Broadcom Inc. shares up significantly over the weekend while its peers faltered. However, there is a distinct tension between the stock price and the plumbing of the business. While the market celebrates Broadcom as a stable alternative, our forensic screens have begun to flash red. When a company is this large and this central to a secular trend, investors tend to stop looking at the cash flow statement and start looking at the headlines. We believe that is a mistake, especially when the US 10-Year Treasury yield is hovering at 5.15%, making the opportunity cost of being wrong about a semiconductor giant exceptionally high.
The VMware Mask and the Working Capital Strain
To understand Broadcom Inc. today, you have to look past the 85.5% year over year revenue growth. That number is a bit of a statistical miracle produced by the massive VMware acquisition. Integrating a multi-billion dollar software entity into a hardware-centric culture creates a lot of accounting noise that can hide underlying operational friction. Broadcom Inc. currently boasts an elite Rule of 40 score of 119.8%, which usually signals a business firing on all cylinders. But when we look at the multi-year historical trajectory, a different picture emerges regarding the quality of those returns.
In the 2025 fiscal year, Stock-Based Compensation (SBC) ballooned to $7.57 billion, representing 18.6% of operating cash flow. For context, in 2022, that figure was just $1.53 billion. SBC is a non-cash expense that companies add back to their “Adjusted” earnings to make them look more profitable, but for a common shareholder, it is a very real cost of dilution. When you strip out this SBC, the real Free Cash Flow (FCF) yield drops to a meager 1.39%. Compare that to the risk-free 5.15% you can get from a government bond, and you realize you are paying a massive premium for the privilege of owning Broadcom equity.
| Period | Revenue | Operating Income | Operating Margin | Free Cash Flow | SBC Expense |
|---|---|---|---|---|---|
| FY2022 | $33.20B | $14.28B | 43.0% | $16.31B | $1.53B |
| FY2023 | $35.82B | $16.45B | 45.9% | $17.63B | $2.17B |
| FY2024 | $51.57B | $15.00B | 29.1% | $19.41B | $5.74B |
| FY2025 | $63.89B | $26.07B | 40.8% | $26.91B | $7.57B |
The most pressing concern is the divergence in working capital. Our forensic audit found that accounts receivable growth outstripped revenue growth by more than 15%. In plain English, this means Broadcom Inc. is recording sales on its books faster than it is actually collecting cash from its customers. Simultaneously, inventory growth has outpaced the cost of goods sold (COGS) by a similar margin. This suggests that chips are piling up in warehouses or that the company is extending more generous credit terms to hit its quarterly numbers. In a high-rate environment, inventory bloat is a precursor to margin compression and potential write-downs.
Peer Realities and the Benchmarking Burden
Broadcom Inc. currently commands a 3.0% weight in the S&P 500, which creates a psychological floor for the stock. Institutional fund managers who are benchmarked against the index face massive career risk if they underweight a winner. This creates a mechanical bid: they have to buy it because everyone else owns it. This index-mandated demand often masks the fact that Broadcom Inc. is trading at an EV/EBITDA multiple of 32.4x, which is significantly higher than NVIDIA’s 19.4x.
| Company (Ticker) | Market Cap | Forward P/E | EV/EBITDA | Rev Growth (YoY) | Operating Margin | FCF Yield |
|---|---|---|---|---|---|---|
| Broadcom (AVGO) | $1.66T | 17.9x | 32.4x | 85.50% | 48.81% | 1.85% |
| NVIDIA (NVDA) | $3.93T | 10.3x | 19.4x | 105.9% | 65.2% | 1.06% |
| Marvell Technology (MRVL) | $141.0B | 21.3x | 48.7x | 36.5% | 16.8% | 1.71% |
| QUALCOMM (QCOM) | $184.5B | 14.1x | 20.8% | -8.4% | 20.8% | 4.93% |
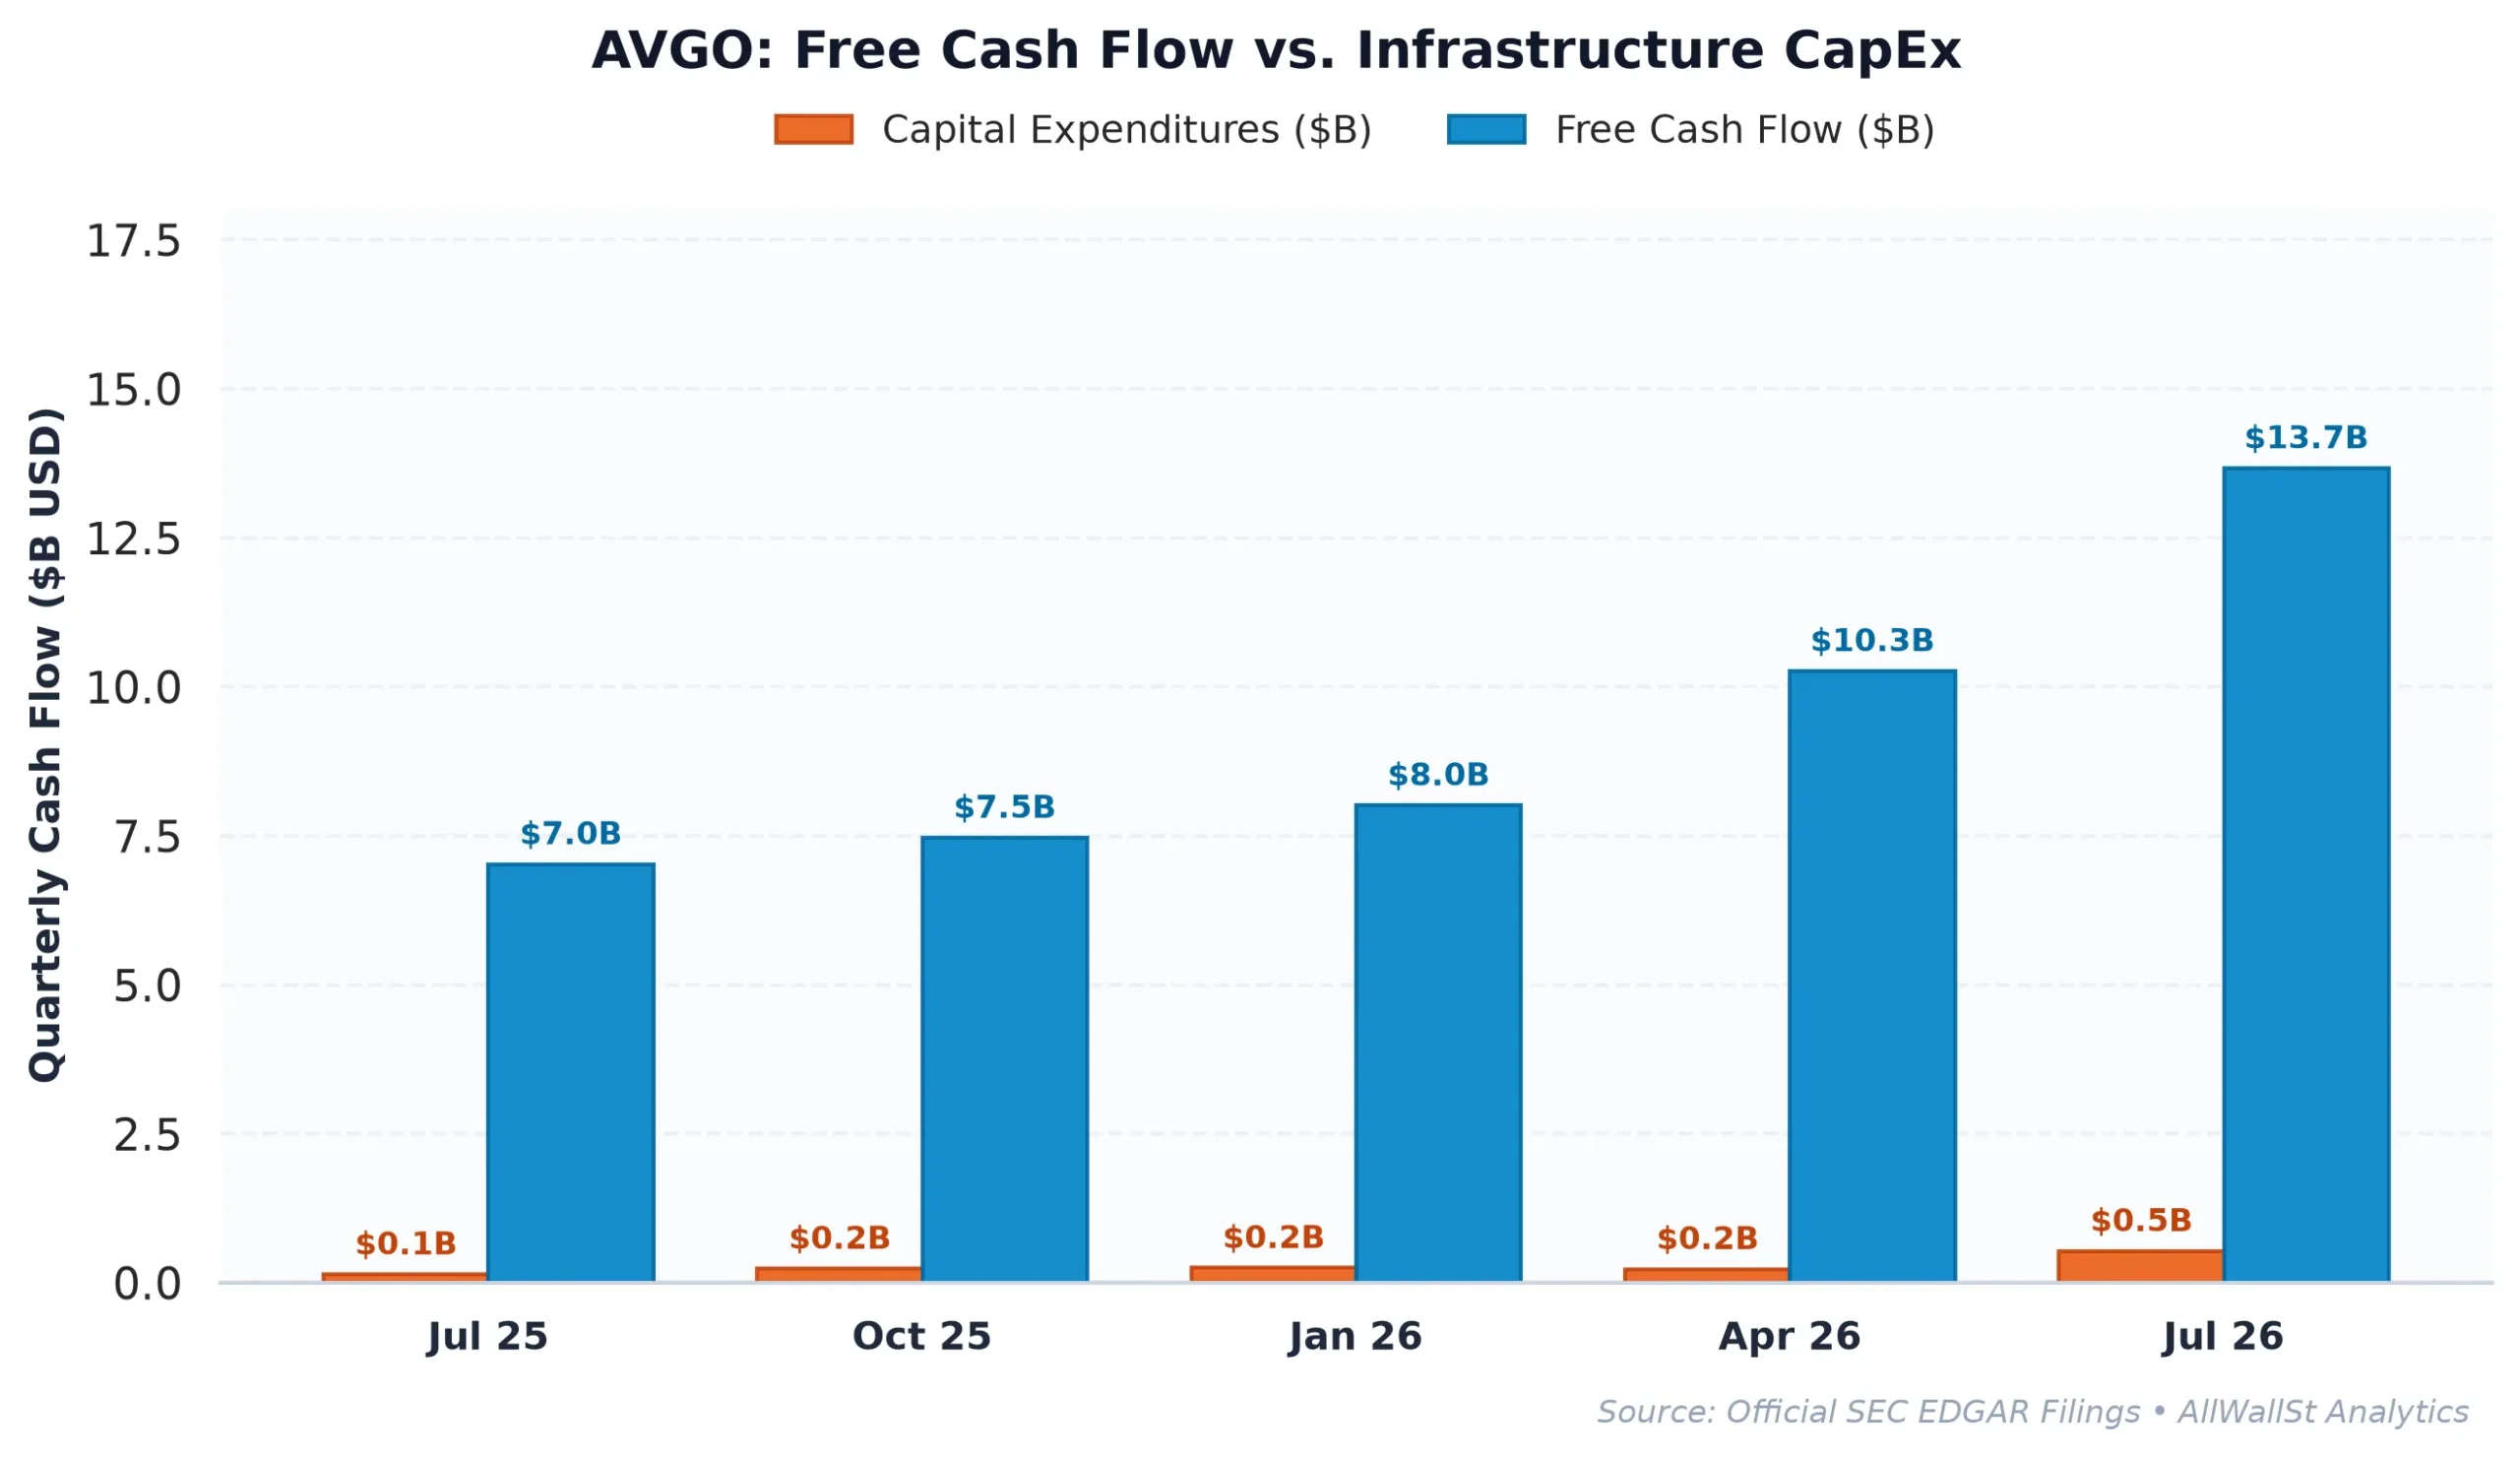
When we compare Broadcom Inc. to Marvell Technology (MRVL) or QUALCOMM (QCOM), the valuation premium becomes harder to justify. Marvell is the closest direct competitor in AI networking and custom silicon, yet Broadcom is the one being treated as a defensive staple. The market is essentially pricing Broadcom Inc. as if its 48.8% operating margins are permanent and immune to the cyclicality of the semiconductor industry. However, the 10-Q filings show a business that is becoming increasingly capital-intensive, with CapEx intensity rising to 11.29%. As the cost of building the next generation of AI infrastructure rises, Broadcom will have to run faster just to stay in place.
The competitive moat in high-end switching (the Tomahawk and Jericho lines) is formidable, but it is not impenetrable. The rise of open-source networking standards and the internal silicon efforts of hyperscalers like Amazon and Google represent a long-term threat to Broadcom’s pricing power. If those customers decide they can build their own “good enough” networking chips, Broadcom’s margins will have nowhere to go but down.
Options Pinning and the Path to Max Pain
As we head into a week featuring massive earnings from NVIDIA and Palo Alto Networks, the options market structure for Broadcom Inc. suggests a state of uneasy balance. The Put/Call Open Interest ratio is 0.95, indicating that for every optimistic call buyer, there is a defensive put hedger. The Max Pain strike, the price level where the most options contracts expire worthless, sits at $340.00. With the stock currently at $347.01, there is a mechanical pull toward that $340 level as dealers hedge their delta exposure into the Friday expiration.
The primary Call Wall is at $400, which acts as a formidable ceiling. It would take a massive, sector-wide catalyst to pierce that level. On the downside, the Put Wall at $340 is the first line of defense, followed by a much deeper floor at $300. Given the 30-day expected move of +/- 17%, the market is pricing in significant volatility. If NVIDIA’s earnings on November 17 fail to provide a perfect “beat and raise” scenario, the entire semiconductor sector, including Broadcom Inc., could see a rapid unwind of the recent “safety” premium.
The combination of forensic red flags in receivables and inventory, alongside a negative 3.31% spread between the FCF yield and the 10-Year Treasury, makes the current price level unsustainable. We previously held a neutral stance on the business, but the recent price appreciation has outpaced the fundamental reality. When the market ignores working capital friction to chase a narrative, the eventual correction is usually painful. Broadcom Inc. is a great company, but at these levels, it is an expensive and increasingly risky stock.
Investment Committee Steelman Dissent: The bull case rests on Broadcom’s dominant position in the AI backend, where its custom ASIC business could experience a multi-year surge as hyperscalers move away from general-purpose GPUs. If the VMware integration delivers higher-than-expected synergies and software recurring revenue, the current cash flow divergence could be viewed as a temporary integration artifact rather than a structural decay.
AllWallSt Investment Verdict: SELL (Downgrade from HOLD)
Broadcom Inc. (AVGO)
Trailing P/E
Marcus Wolfe Screen
Leverage Profile
30D Channel
Dealer Gamma Pinning & Max Pain Alignment (AVGO)
🎯 Max Pain: $340.00
Spot $347.01
Ceiling $400C Resistance ▲
ELEVATED CONCERN (2 flags): Receivables growth outstripped revenue growth by >15%, pointing to potential revenue recognition or collection friction. Inventory growth outpaced COGS growth by >15%, signaling potential inventory bloat or pending margin compression.
Prudent Leverage (0.68x Net Debt/EBITDA); well within investment-grade covenant headroom.
Negative yield spread (-3.31% vs 5.15% Treasury); equity requires robust multiple expansion or growth.
Max Pain: $340.00 (-2.02%) | P/C Ratio: 0.95 | 30D Channel: $287.88 – $406.14. Dealer gamma bounded between $340 Put Wall and $400 Call Wall.
AVGO commands a massive ~3.0% S&P 500 benchmark footprint. Wall Street sell-side consensus reflects structural career-risk defense: institutional funds face severe benchmark tracking penalties for underweighting mega-cap heavyweights, forcing mandatory allocations regardless of current Free Cash Flow yield.
$392.00 – $408.00 (Call Wall Resistance Distribution Ceiling)
Sustained weekly close above $400.00 (Call Wall Resistance) or structural rebound in GAAP Free Cash Flow.
Bullish IC Dissent: Despite 44.3x trailing earnings and 1.85% FCF yield alongside 2 flagged accrual anomalies, Broadcom Inc. (AVGO) could stage a sharp short-covering squeeze if management surprises with cost discipline, buyback acceleration, or stabilizing guidance above the $400 call wall. Consensus pessimism already prices in significant deterioration, creating asymmetric upside risk if credit spreads remain contained.
Sources & References
- Official SEC Form 10-K Annual Report (Filed 2025-12-18)
- Broadcom Inc. Investor Relations: https://www.broadcom.com
- SEC EDGAR Filings (CIK 0001730168): https://www.sec.gov/edgar/browse/?CIK=0001730168
- Latest Form 10-Q: https://www.sec.gov/Archives/edgar/data/1730168/000173016826000080/avgo-20260802.htm
Disclaimer: This report is for informational purposes only and does not constitute financial, legal, or investment advice. The views expressed are those of the AllWallSt research team and do not reflect the opinions of any other institution. Investing in equities involves significant risk. Past performance is not indicative of future results.