
The Berkshire Exit and the Anatomy of Panic
When Warren Buffett sells down eighty-four percent of a position over six months, the market typically assumes one of two things: either the borrower is broke, or the lender is about to be. Over the past forty-eight hours, Berkshire Hathaway disclosed that its stake in Capital One Financial Corporation has dwindled to just 1.15 million shares. That disclosure arrived alongside headlines about transient digital banking outages and industry-wide anxiety over rising payment fraud.
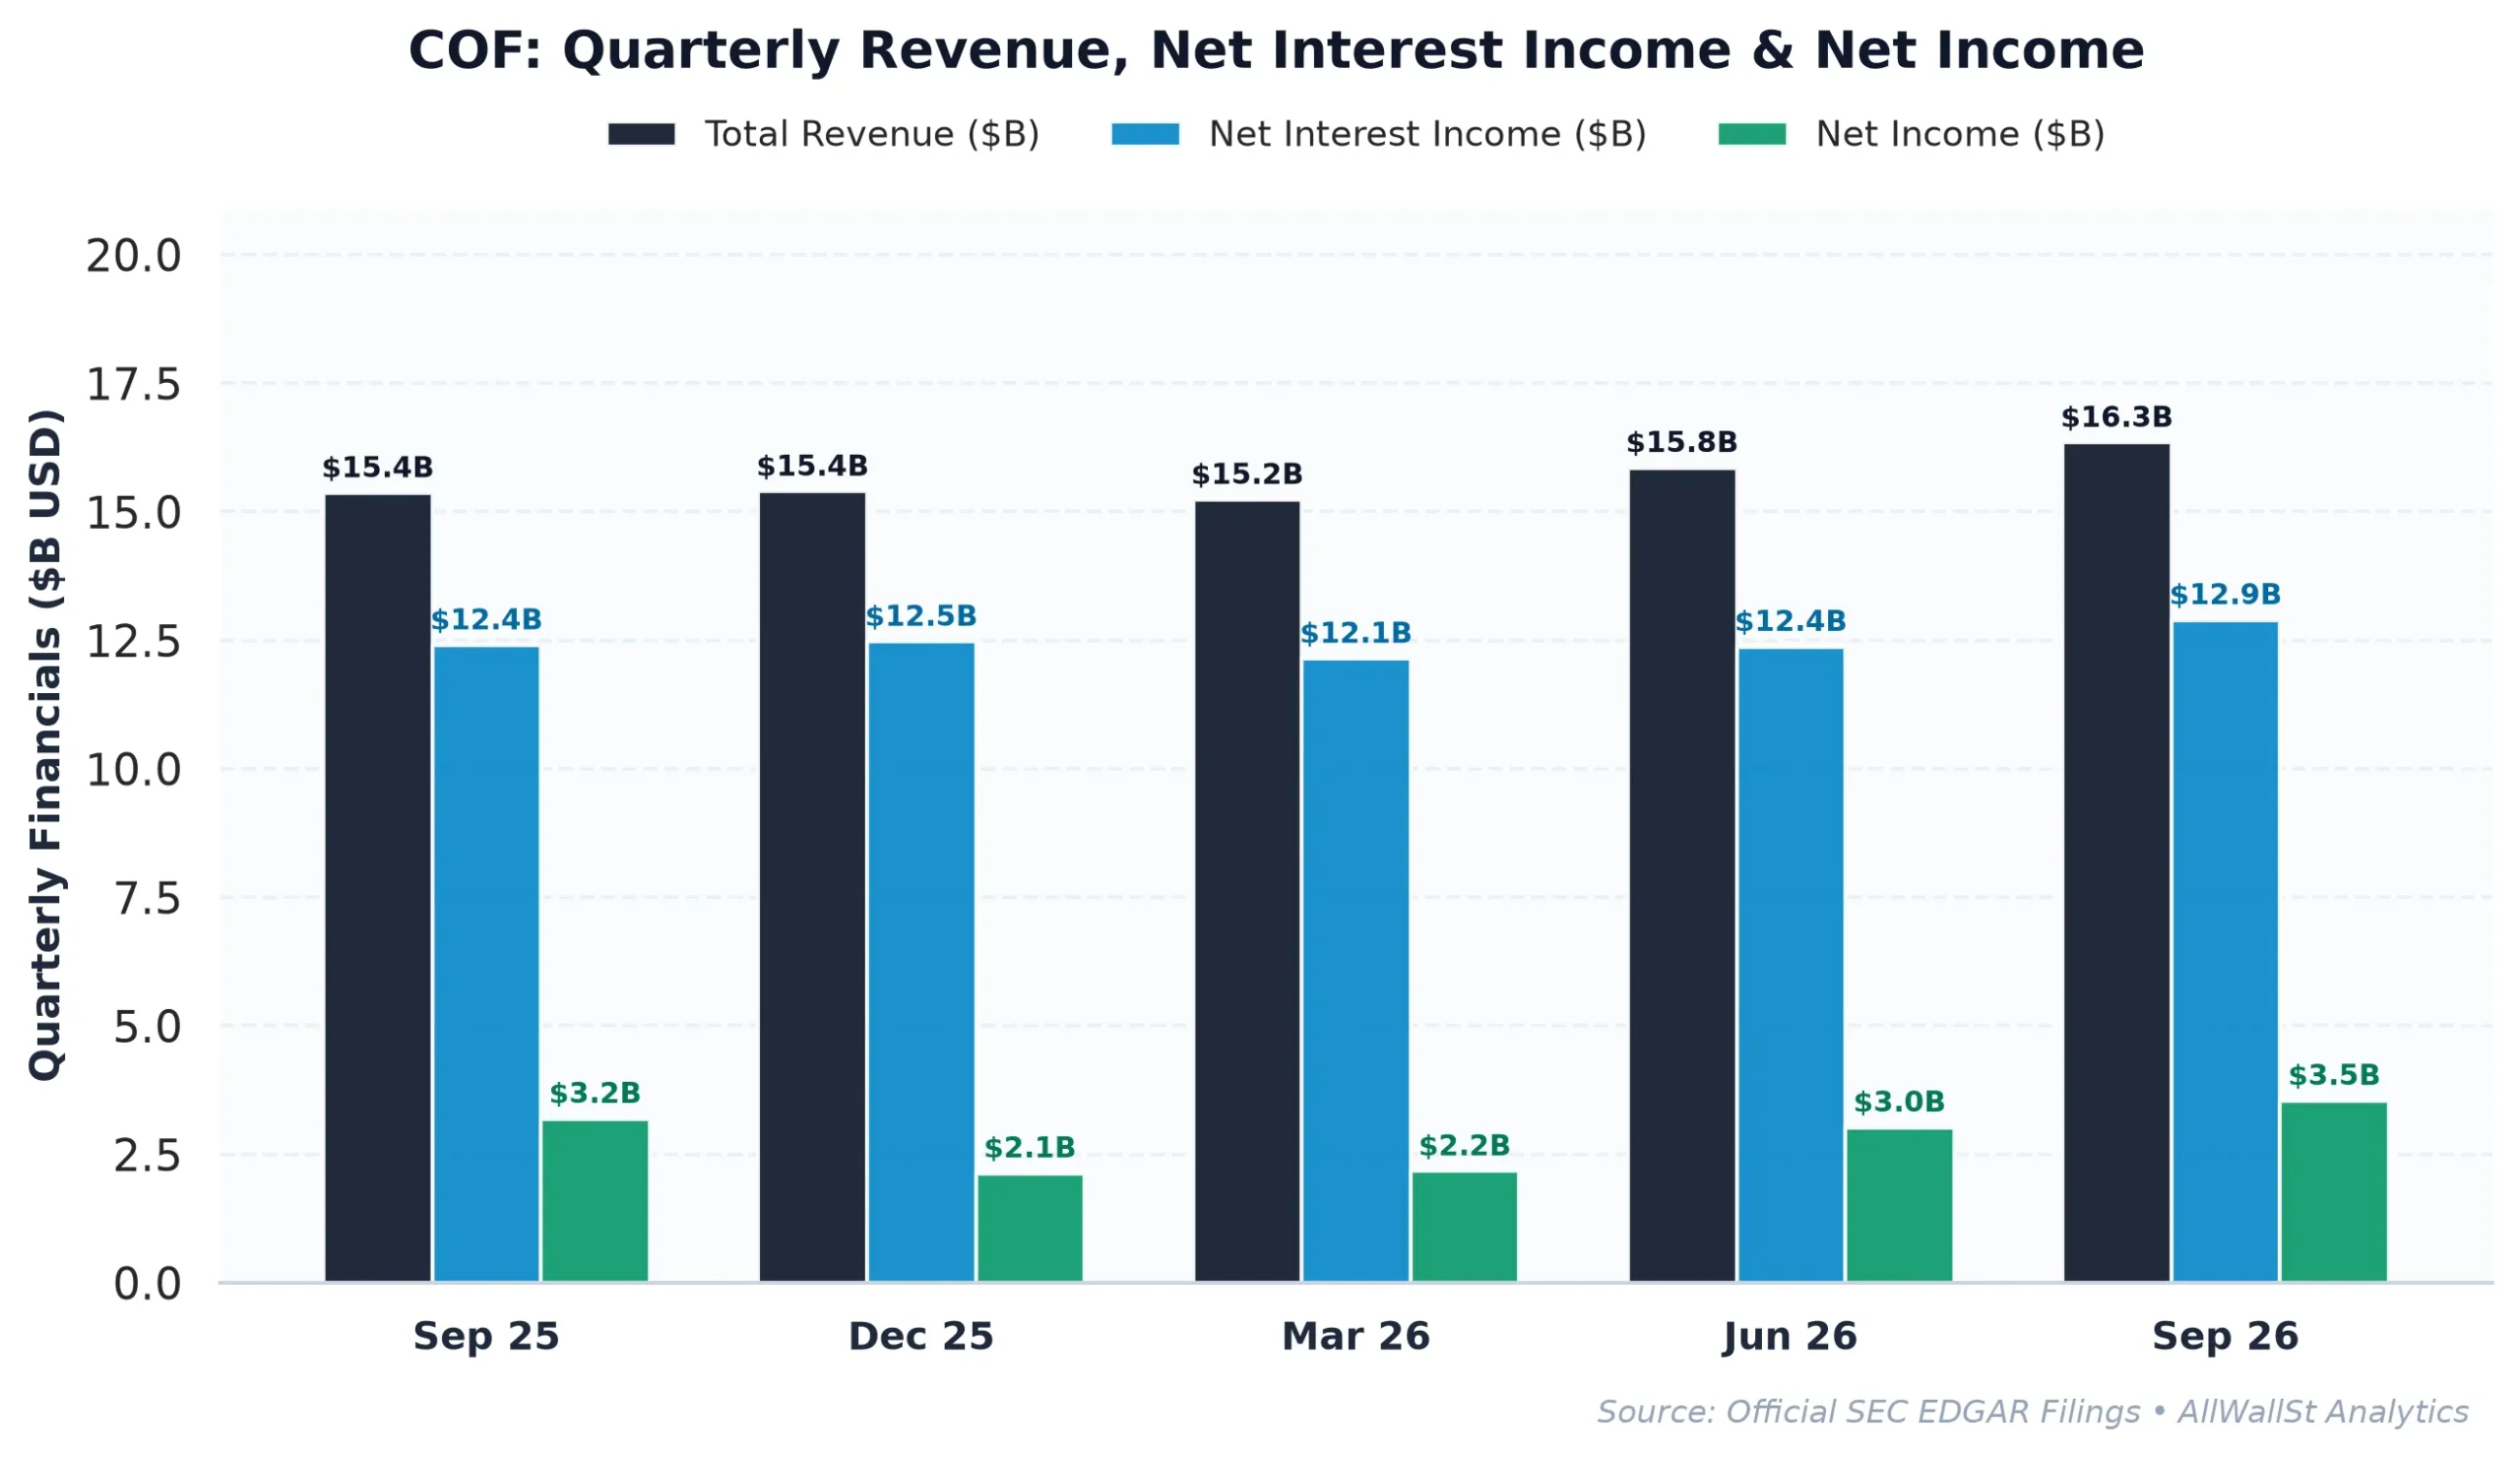
Yet looking through the headline noise to the regulatory record reveals a vastly different institutional reality. Capital One reported third-quarter 2026 net income of $3.5 billion, translating to $5.61 per diluted share, or $6.69 per share net of adjusting items. In its monthly credit metric disclosure filed on Form 8-K on November 16, domestic credit card net charge-offs stood at 4.02%, with thirty-day performing delinquencies holding steady at 3.87%. These are normalized consumer lending numbers, not the indicators of an impending credit collapse.
The market has greeted these disclosures by pricing Capital One at an extraordinarily steep discount to its banking peers. At roughly 7.8 times forward earnings and barely 1.07 times book value, the equity market is treating one of the country’s largest card issuers as if its underwriting engine were structurally impaired. For institutional capital with an event-driven horizon, that pessimism creates an exceptional asymmetry.
Balance Sheet Mechanics and the Shareholder Yield
Evaluating a bank requires a different set of analytical tools than evaluating a software firm or an industrial conglomerate. You cannot judge a deposit-taking lender on enterprise value to EBITDA or raw industrial free cash flow, because customer deposits are liabilities that fund income-producing loan assets. Instead, bank solvency and shareholder value hinge on net interest margin, credit reserves, Price-to-Book value, and Return on Equity.
Price-to-Book (P/B) measures what the stock market is willing to pay for each dollar of net accounting assets on the balance sheet. When a bank trades near 1.07x book, investors are essentially arguing that management will barely earn its cost of capital over the full cycle. Yet Capital One generated a Return on Equity of 9.39% over the trailing twelve months, comfortably covering its capital requirements while building an expansive reserve cushion. Net interest income, the fundamental spread between what the bank earns on its credit card and auto loans versus what it pays depositors, expanded from $27.11 billion in FY2022 to $42.88 billion in FY2025.
| Period | Revenue | Net Interest Income | Pretax Income | Net Income | Net Margin | SBC Expense |
|---|---|---|---|---|---|---|
| FY2022 | $34.25B | $27.11B | $9.24B | $7.04B | 20.6% | $314.0M |
| FY2023 | $36.79B | $29.24B | $6.04B | $4.58B | 12.5% | $513.0M |
| FY2024 | $39.11B | $31.21B | $5.91B | $4.45B | 11.4% | $569.0M |
| FY2025 | $53.43B | $42.88B | $2.28B | $2.18B | 4.1% | $776.0M |
Crucially, Capital One couples its net interest spread with aggressive capital returns. The bank maintains a Total Shareholder Yield of 5.80%, consisting of a 1.71% dividend yield augmented by $4.60 billion in trailing twelve-month share repurchases. That buyback yield of 4.09% is quietly retiring shares at a price near tangible accounting value, generating immediate accretion for remaining long-term holders.
Management’s deposit beta, which tracks how rapidly customer deposit rates must rise to match benchmark interest rates, has remained disciplined throughout this cycle. With the US 10-Year Treasury yield hovering at 5.10%, Capital One continues to fund its high-yielding loan portfolio with stable retail deposits rather than costly wholesale institutional borrowings.
The Peer Multiple Gap and the Network Catalyst
The prevailing equity discount becomes even more glaring when Capital One is placed beside money-center rivals and wholesale investment banks. Wall Street continues to assign Capital One a single-digit price-to-earnings multiple, penalizing it for consumer credit exposure while assigning rich premiums to institutional balance sheets.
| Company (Ticker) | Market Cap | Forward P/E | P/B | ROE | Rev Growth (YoY) | Dividend Yield |
|---|---|---|---|---|---|---|
| Capital One Financial (COF) | $112.4B | 7.8x | 1.07x | 9.39% | 6.20% | 1.71% |
| JPMorgan Chase & Co. (JPM) | $876.2B | 12.9x | 2.49x | 18.01% | 10.2% | 2.00% |
| Bank of America (BAC) | $341.1B | 9.5x | 1.26x | 10.73% | 3.4% | 2.59% |
| Goldman Sachs Group (GS) | $253.1B | 11.8x | 2.39x | 17.71% | 23.3% | 2.28% |
JPMorgan Chase commands a forward price-to-earnings multiple of 12.9x and trades at nearly 2.5 times book value. Even Bank of America, which carries substantial unrealized losses in its low-coupon fixed-rate debt portfolios, trades at 9.5 times forward earnings. Capital One’s valuation of 7.8x forward earnings reflects widespread market skepticism regarding subprime auto exposure and consumer credit deterioration.
However, this valuation completely ignores the strategic endgame of the Discover Financial acquisition. In retail banking, you are either a tenant paying interchange fees to Visa and Mastercard, or you own the payment rails. By acquiring Discover, Capital One is transforming itself into a closed-loop payments powerhouse, capturing merchant interchange fees while eliminating network processing expenses across hundreds of billions of dollars in annual transaction volume.
The deal break risk, which once commanded a severe regulatory spread due to antitrust scrutiny, has increasingly de-risked as operational milestones approach. Even if cross-border regulators impose compliance conditions or the integration timeline stretches slightly, the unaffected equity value of the core credit card franchise provides a durable valuation floor. Capital One does not need multiple expansion to 13 times earnings to deliver alpha; it simply needs the market to recognize that owning the payment network turns a cyclical lender into a secular payments tollbooth.
Options Structure, Balance Sheet Durability, and Verdict
Turning to the options market reveals that institutional positioning is far more constructive than retail headlines suggest. Capital One trades near $186.78, with a Put/Call Open Interest ratio of 0.73, reflecting a healthy, balanced options posture without speculative put crowding.
The Max Pain strike sits overhead at $200.00, representing a 7.08% upward gap from current spot levels. In options market plumbing, Max Pain is the strike where option market makers pay out the least money to option holders upon expiration, creating a natural mechanical gravity toward that price as contract settlement nears.
Downside support is heavily defended by a Put Wall at $185.00 (1,438 contracts) and $190.00 (2,509 contracts). A Put Wall functions as a structural floor because market makers who sold those downside put options must dynamically purchase underlying common stock as the price dips, cushioning downside declines. Overhead resistance is defined by a Call Wall at $210.00 (3,069 contracts), where option sellers will defend upside strikes. With thirty-day implied volatility at 38%, the mathematical expected move spans roughly plus or minus $20.34, setting a near-term trading range between $166.44 and $207.12.
The macro environment remains demanding, but Capital One’s balance sheet is built to absorb credit normalization. The bank carries $52.22 billion in balance-sheet liquidity alongside an extensive credit-loss reserve allowance that already anticipates elevated consumer stress. When an institution trades at 1.07 times book while repurchasing four percent of its own shares annually, patience pays a compounding return.
Investment Committee Steelman Dissent: The primary downside risk centers on domestic credit card charge-offs breaching 5.5% alongside a sharp contraction in prime auto loan values, which would force management to pause share repurchases and redirect capital into loan-loss provisions. Furthermore, any protracted litigation or unexpected consent decree arising from network integration reviews could defer projected payment rail synergies well into 2028.
AllWallSt Investment Verdict: BUY (Capital Allocation & Rerating)
Capital One Financial Corporation (COF)
Trailing P/E
Marcus Wolfe Screen
Leverage Profile
30D Channel
Dealer Gamma Pinning & Max Pain Alignment (COF)
🎯 Max Pain: $200.00
Spot $186.78
Ceiling $210C Resistance ▲
Banking liquidity & regulatory capital compliant (Basel III / CET1 governed); deposit & trading settlement flows normalized.
Tier 1 Regulatory Capital & Liquidity Coverage Ratio (LCR) compliant; balance sheet governed by Basel III capital buffers.
Evaluated against 5.10% US 10-Yr Benchmark; bank net interest margins sensitive to yield curve slope (2s10s spread) and deposit beta.
Max Pain: $200.00 (+7.08%) | P/C Ratio: 0.73 | 30D Channel: $166.44 – $207.12. Dealer gamma bounded between $190 Put Wall and $210 Call Wall.
COF carries standard index weighting (< 0.6% SPY footprint); sell-side consensus reflects standard earnings momentum rather than index-tracking mandates.
$186.20 – $193.80 (Options Support Pinning)
Sustained weekly close below $190.00 (Put Wall) or compression in ROE and net interest margins.
Bearish IC Dissent: At 11.4x trailing earnings and 9.39% ROE (1.07x P/B) against a 5.10% 10-year risk-free hurdle, Capital One Financial Corporation (COF) leaves limited cushion for top-line deceleration or net interest margin and credit quality compression. If institutional flows break below the $190 put wall, dealer de-hedging can accelerate multiple contraction before fundamental buyers step in.
Sources & References
- Official SEC Form 10-K Annual Report (Filed 2026-02-19)
- SEC Form 8-K Exhibit 99.1 (Press Release / Earnings) (2026-11-16)
- SEC DEF 14A Proxy / M&A Filing (2026-03-25)
-
Federal Docket: Vervaet v. Capital One Financial Corporation (2026-11-16)
-
SEC EDGAR Portal: Capital One Financial Corporation Official Filings (CIK 0000927628), https://www.sec.gov/edgar/browse/?CIK=0000927628
- Capital One Financial Corporation Investor Relations, https://www.capitalone.com
- SEC Form 8-K Monthly Credit Metrics Filing (November 16, 2026), https://www.sec.gov/Archives/edgar/data/927628/000092762826000160/cof-20261113.htm
- SEC Form 8-K Third Quarter 2026 Earnings Release (October 20, 2026), https://www.sec.gov/Archives/edgar/data/927628/000092762826000142/ex991q32026earningsrelease.htm
- SEC Form 10-Q Quarterly Report for Period Ended September 30, 2026, https://www.sec.gov/Archives/edgar/data/927628/000092762826000152/cof-20260930.htm
Regulatory Disclaimer: This publication is produced strictly for informational and educational purposes and does not constitute investment advice, financial analysis, or an offer or solicitation to buy or sell any security. Past performance is no guarantee of future results. Financial market transactions involve substantial risk of capital loss. Readers should consult an independent, registered financial advisor and review official SEC EDGAR disclosures before executing any financial transaction.