
The traditional business of Carrier Global Corporation (CARR) is, at its heart, the business of keeping things from getting too warm. For decades, this involved selling large, heavy, and remarkably reliable metal boxes to people who own buildings or supermarkets. You sold the box, you maybe sold a basic maintenance contract, and you waited fifteen years for the box to break so you could sell another one.
Then came the Internet of Things (IoT). Suddenly, the metal boxes became smart. They started talking to the cloud, reporting their internal temperatures to centralized dashboards, and allowing supermarket managers to adjust the cooling for the organic kale from their iPhones. This was marketed as a miracle of efficiency. It also, as it turns out, turned every refrigerator in Europe into a potential entry point for international cyber-criminals.
Reports of coordinated cyber-attacks hitting supermarket freezers across ten European countries have sent a chill through the retail sector, but for Carrier, this is less of a crisis and more of a mandatory product recall that the customers have to pay for themselves. The breach of industrial control systems (ICS) highlights a structural vulnerability in the global cold chain. If your freezer can be held for ransom, you do not just need a repairman. You need an encrypted, cloud-native hardware overhaul.
The Security as a Service Pivot
The market currently values Carrier Global Corporation at roughly 17.3 times forward earnings. To put that in perspective, GE Aerospace trades at 34.4 times, and Eaton (ETN) commands 24.0 times. The discount exists because the market still views Carrier as a cyclical manufacturer of hardware. However, the European freezer hack provides the perfect catalyst to accelerate the transition to high-margin recurring revenue.
When a supermarket chain realizes its entire inventory of frozen goods can be liquidated by a teenager in a basement, the conversation shifts from CapEx to OpEx. Carrier is no longer just selling a cooling unit. It is selling “Secure-as-a-Service.” This involves a mandatory replacement cycle of legacy IoT controllers with proprietary, secure hardware that requires a monthly subscription for security patches and monitoring.
This shift is visible in the historical trajectory. Revenue grew from $17.29 billion in 2022 to $21.75 billion in 2025. While operating margins have hovered around 11.0%, the move toward software-heavy service contracts is the classic playbook for margin expansion. If Carrier can successfully migrate its installed base to a subscription model, that 11.0% margin starts looking a lot more like the 18.5% seen at GE Aerospace.
Valuation and Peer Realities
Carrier looks remarkably inexpensive when compared to its industrial peers. While Caterpillar (CAT) boasts a 20.5% operating margin, it is a deeply cyclical beast. Carrier, by contrast, operates in a world of increasing climate volatility and now, increasing digital volatility. Both are tailwinds for cooling demand.
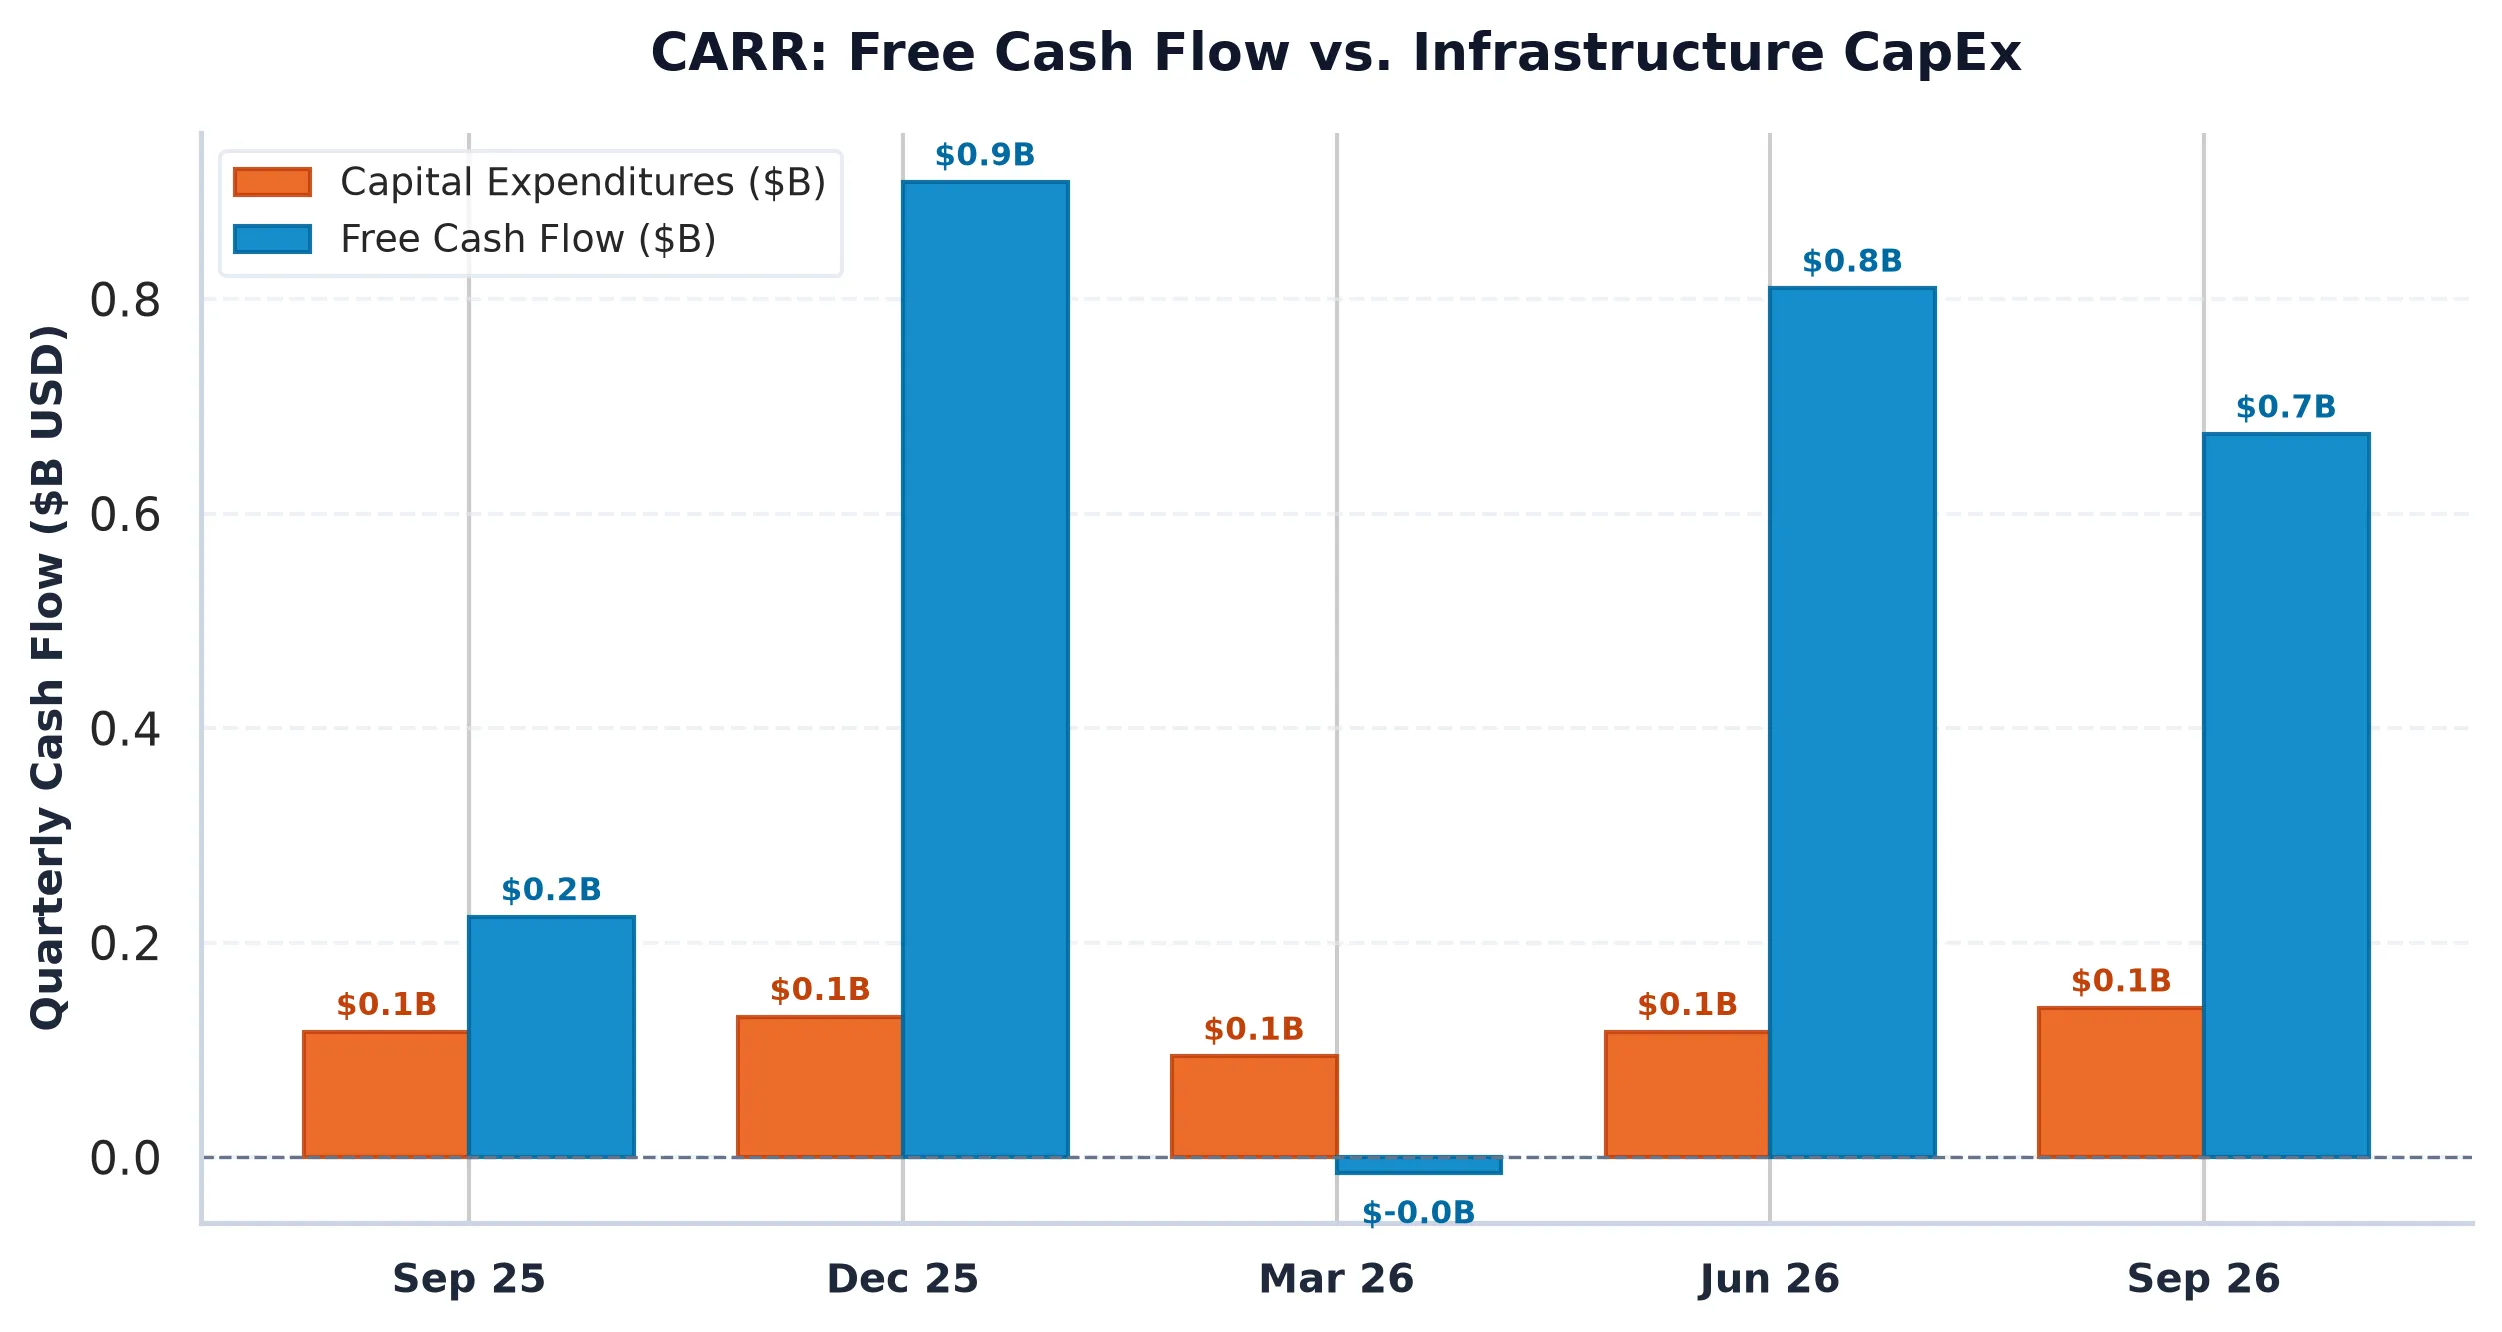
Carrier’s Free Cash Flow (FCF) yield of 4.29% is actually quite attractive when you consider the total shareholder yield. Between a 1.74% dividend and a massive 6.38% buyback yield, the company is returning 8.12% to shareholders. In a world where the 10-Year Treasury yield is hovering around 5.10%, a well-covered 8% yield from a dominant industrial player is a significant margin of safety.
The company’s Rule of 40 score sits at 20.8%, which is below the 25% institutional hurdle. This is largely why the multiple remains compressed. However, the revenue growth of 12.3% is robust. If the service pivot can drag the FCF margin up from its current 8.5% level, the stock will likely undergo a significant re-rating.
The Market Structure and Gamma Squeeze
The options market for Carrier is currently exhibiting some of the strangest behavior in the industrial sector. The Put/Call Open Interest ratio is a staggering 10.93. For every person betting the stock goes up, nearly eleven are betting it goes down or are paying through the nose to protect their positions.
This level of defensive skew usually signals one of two things: either the market knows a disaster is coming, or there is a massive amount of institutional hedging that is about to be unwound. With a Max Pain strike of $55.00, the stock is currently pinned near its point of least payout for option sellers.
However, the primary Put Walls are down at $47.50 and $45.00. This suggests that if the stock stays above $55.00, the massive put position will begin to decay rapidly. As those puts lose value, dealers who sold them will have to buy back the underlying shares they used as hedges. This “vanna” and “charm” flow creates a mechanical tailwind for the stock price, regardless of what the broader market is doing.
Capital Allocation and the Buyback Machine
Carrier is currently a buyback machine. The company spent $2.89 billion on share repurchases over the last year, which is a significant chunk of its $45.3 billion market cap. Unlike many tech companies that use buybacks merely to offset the dilution of stock-based compensation (SBC), Carrier’s SBC is a rounding error at just $0.07 billion.
This means the buybacks are actually reducing the share count and concentrating the earnings for remaining holders. When you combine an 8% total shareholder yield with a fundamental catalyst like a mandatory European hardware upgrade cycle, the investment case becomes very difficult to ignore. The market is worried about cyber-attacks on freezers. We are more interested in who gets paid to fix them.
Carrier Global Corporation (CARR)
Trailing P/E
Marcus Wolfe Screen
Leverage Profile
30D Channel
Pristine cash flow conversion (1.69x) and healthy accrual ratio (-2.77%). Zero accounting anomalies detected (LOW ANOMALY RISK).
Moderate Leverage (3.24x Net Debt/EBITDA); manageable through operating cash generation.
Negative yield spread (-0.66% vs 5.10% Treasury); equity requires robust multiple expansion or growth.
Max Pain: $55.00 (-0.67%) | P/C Ratio: 10.93 | 30D Channel: $49.35 – $61.39. Dealer gamma bounded between $47.5 Put Wall and $60 Call Wall.
CARR operates with negligible index gravitational pull. Sell-side ratings reflect pure idiosyncratic fundamental consensus without passive indexing distortion.
$46.55 – $48.45 (Options Support Pinning)
Sustained weekly close below $47.50 (Put Wall) or gross margin compression below 24.38%.
Sources & References
- Carrier Global Corporation SEC EDGAR Filings
- Carrier Investor Relations
- SEC Form 10-K Filed February 5, 2026
- SEC Form 10-Q Filed October 29, 2026
Regulatory Disclaimer: This report is for informational purposes only and does not constitute financial, legal, or investment advice. AllWallSt is a financial journalism outlet and is not a registered investment advisor. The data provided is sourced from primary SEC filings and market feeds; however, accuracy is not guaranteed. Investing in public equities involves significant risk. Always consult with a certified financial professional before making capital allocation decisions.