
The Core Thesis & Market Dislocation
There is a specific kind of cognitive dissonance that occurs when a century-old oil major starts behaving like a momentum-starved biotech stock in the options pits. Chevron Corporation (CVX) is currently the subject of a fascinating structural tug of war. On one side, you have the fundamental reality of a $408 billion integrated energy giant that just reported $9.9 billion in Q3 earnings and is busy selling down stakes in Namibian exploration blocks to de-risk its upstream portfolio. On the other side, you have an options market that has become aggressively lopsided, with a Put/Call open interest ratio of 0.39.
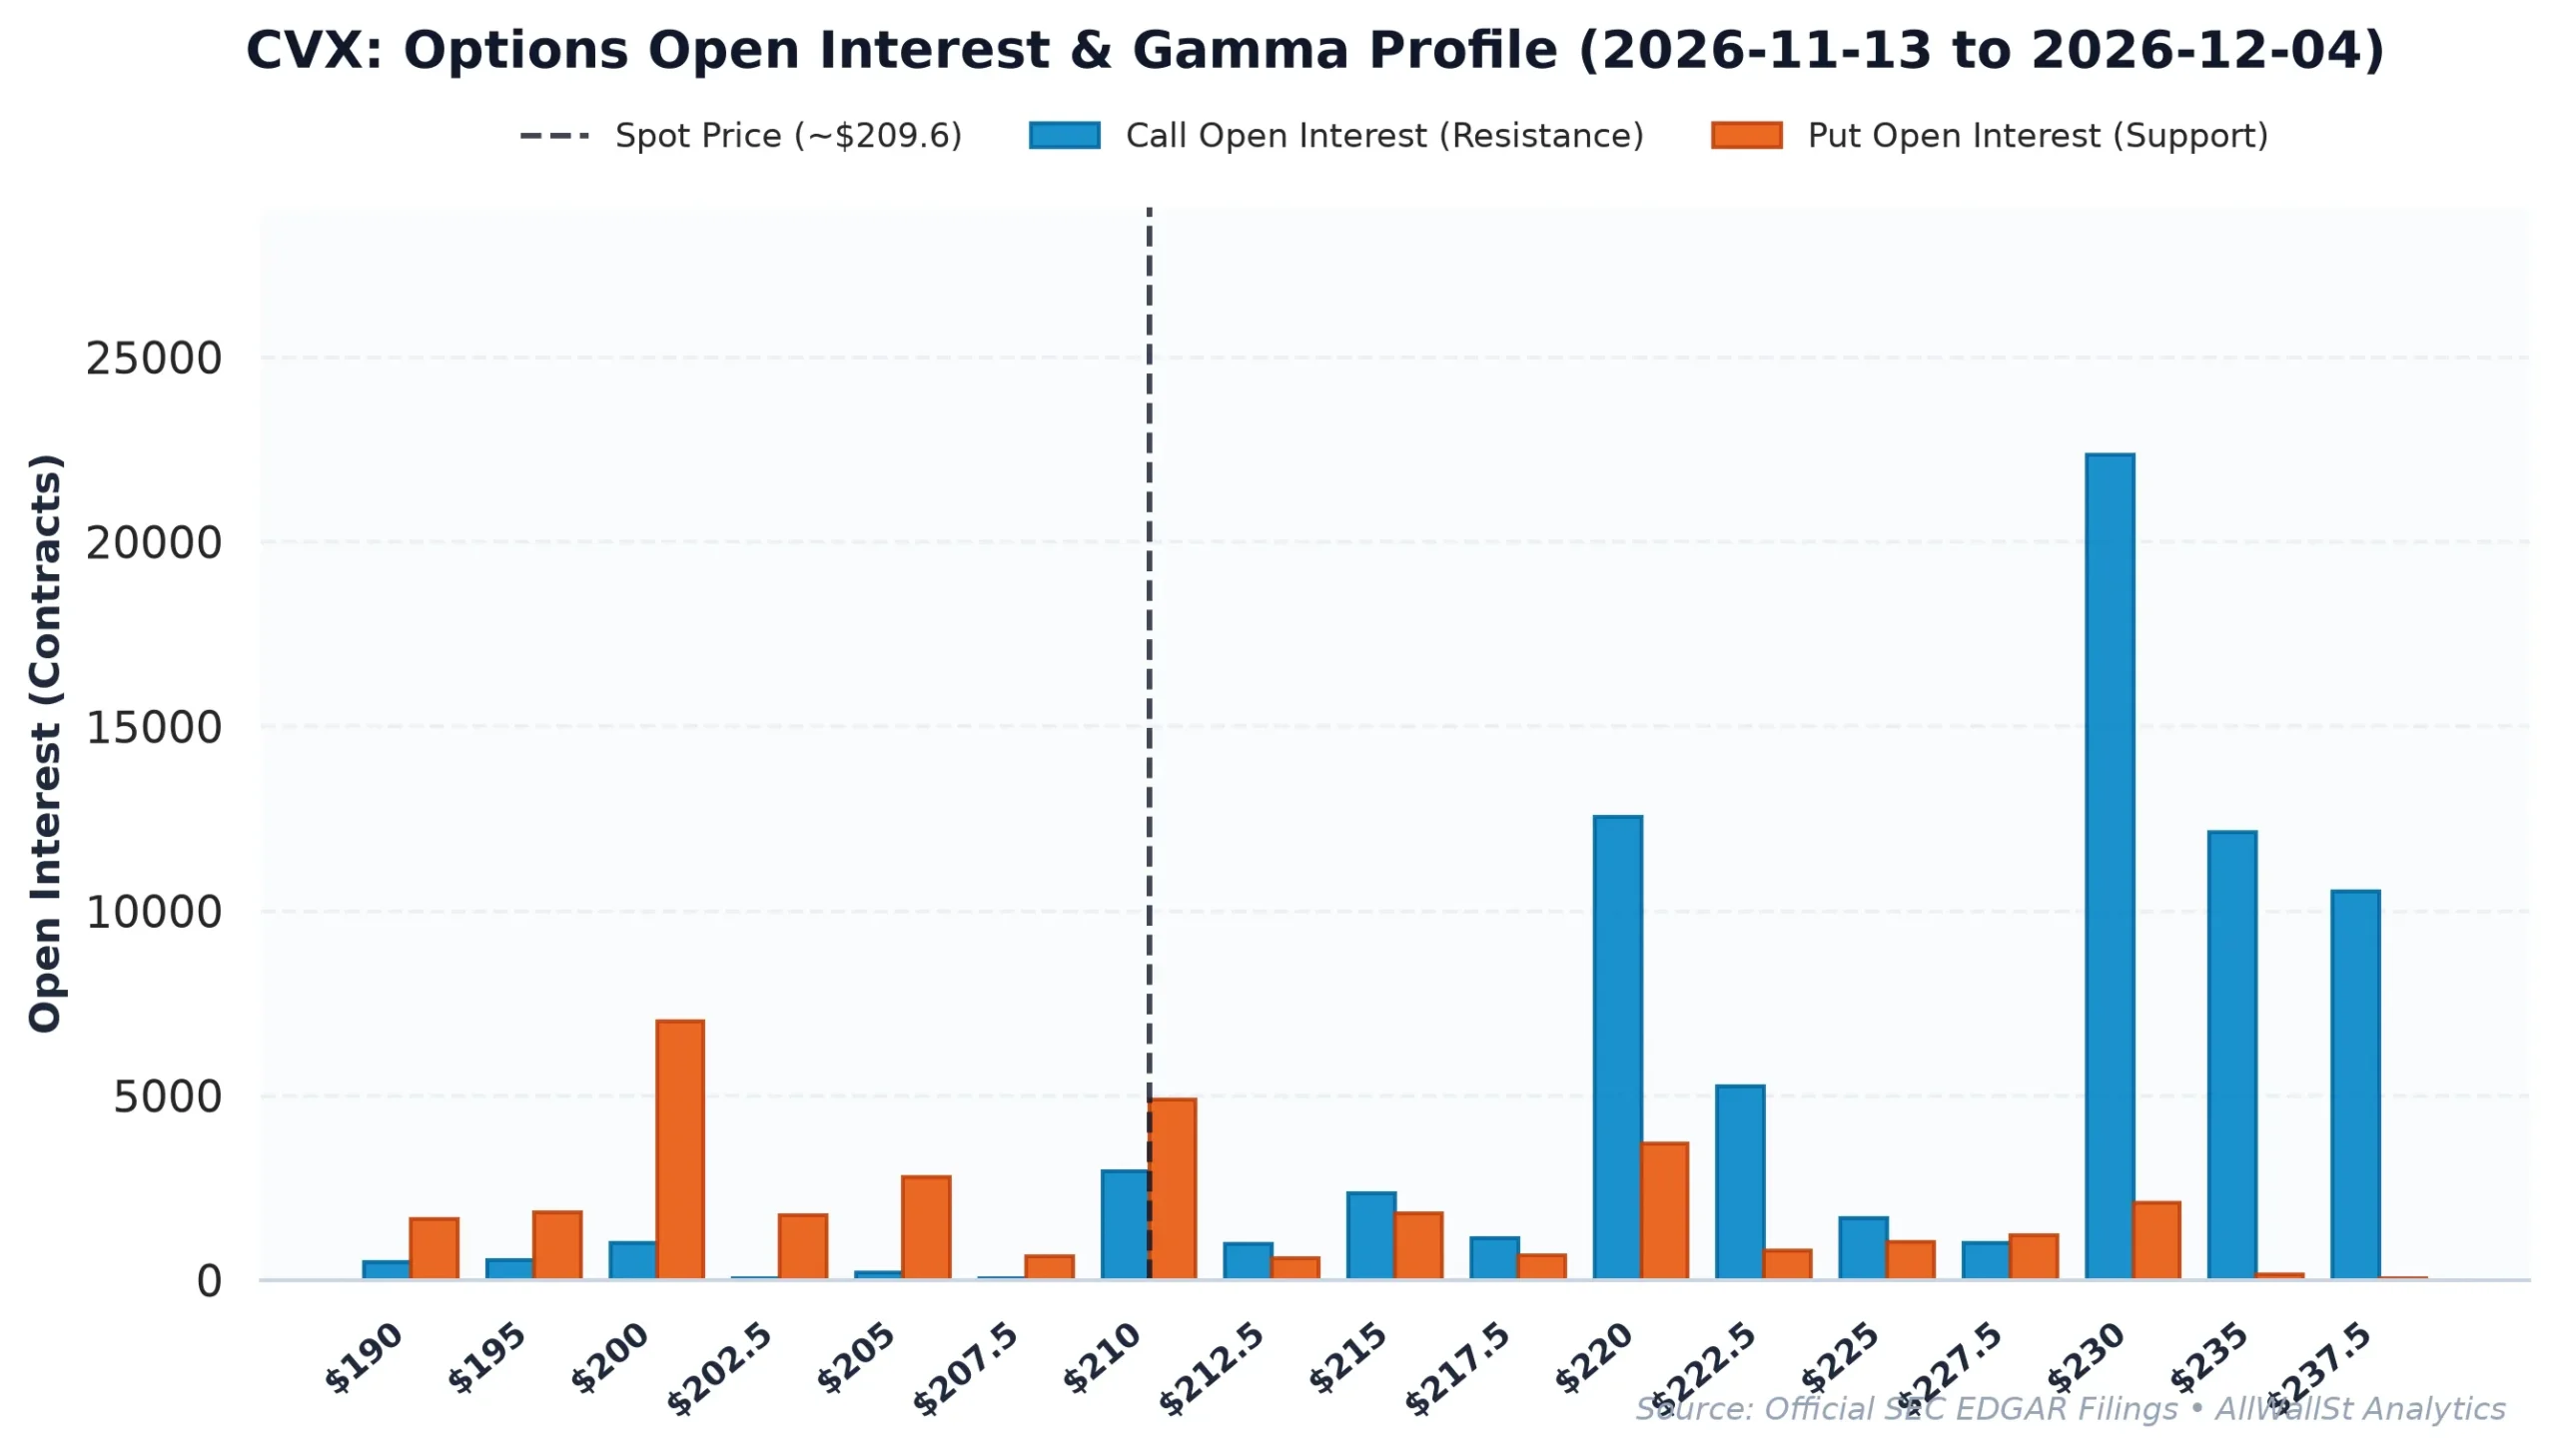
In the world of market plumbing, a Put/Call ratio that low is the equivalent of a crowded theater where everyone is trying to buy a ticket for the same seat. It suggests a speculative fever that is usually reserved for high-beta technology names, not for a company that moves millions of barrels of liquid dinosaurs every day. The current spot price of $209.59 sits just below a significant cluster of dealer put support at $210, while the magnetic pull of the Max Pain strike sits at $217.50. This creates a setup where the mechanical requirements of dealer hedging may actually do more to dictate the stock price over the next thirty days than the actual price of Brent crude.
The recent news flow has provided the fundamental catalyst for this speculative positioning. Chevron Corporation recently brought in a 25 percent partner for its Namibia exploration block and is simultaneously doubling production in Venezuela. These are high-variance outcomes. Exploration in Namibia is the ultimate “hit or miss” game, and Venezuelan production is as much a geopolitical bet as it is an engineering one. Traders are using the options market to lever up on these catalysts, creating a heavy call concentration that makes the stock vulnerable to dealer long liquidation if the upside momentum pauses. However, the underlying cash flow remains so robust that any dip toward the $200 Put Wall is likely to be met with institutional buying.
Multi-Year Financial Trajectory, ROIC & Cash-Flow Mechanics
To understand why the options market is so eager to bet on Chevron, one must look at the balance sheet discipline that has defined the company since the 2022 energy price spike. In 2022, Chevron generated a staggering $235.72 billion in revenue with an operating margin of 16.9 percent. While revenue moderated in 2023 and 2024 as commodity prices normalized, the company has successfully pivoted back to a growth footing. The trailing twelve-month revenue growth of 34.80 percent is elite, especially when paired with a Rule of 40 score of 46.3 percent.
The real story, however, is the return on invested capital (ROIC). Chevron is currently generating a 14.87 percent ROIC, which comfortably clears its estimated weighted average cost of capital (WACC) of roughly 8.5 percent. In an environment where the US 10-Year Treasury yield is hovering around 4.98 percent, a company that can generate nearly 15 percent on its internal projects is a rare bird. This spread between ROIC and the cost of capital is the engine of shareholder value, and it allows Chevron to fund its $25.90 billion capital expenditure program without stressing the balance sheet.
Free cash flow (FCF) yield is the metric that keeps institutional portfolio managers awake at night. Chevron offers a 6.37 percent FCF yield, which represents a positive spread of 1.39 percent over the risk-free rate. When you combine the 3.38 percent dividend yield with the 2.95 percent buyback yield, you get a total shareholder yield of 6.33 percent. This is a remarkably clean return profile. Unlike many Silicon Valley peers, Chevron does not hide massive dilution in its cash flow statements: the share repurchases are actually reducing the share count rather than just offsetting executive stock-based compensation. The net debt to EBITDA ratio of 0.36x is nearly negligible, giving the company the “fortress” balance sheet necessary to navigate the inherent volatility of the energy transition.
Peer Relative Valuation & Competitive Moat
When we stack Chevron Corporation against its primary peers, the valuation argument becomes even clearer. The integrated energy sector is a game of scale and efficiency, and Chevron is currently threading the needle between the two.
| Company (Ticker) | Market Cap | Forward P/E | EV/EBITDA | Rev Growth (YoY) | Operating Margin | FCF Yield |
|---|---|---|---|---|---|---|
| Chevron (CVX) | $408.9B | 12.7x | 7.5x | 34.80% | 17.89% | 6.37% |
| ExxonMobil Holdings (XOM) | $667.6B | 13.2x | 9.0x | 32.6% | 17.0% | 4.24% |
| ConocoPhillips (COP) | $159.7B | 12.0x | 5.8x | 29.3% | 30.0% | 7.18% |
| EOG Resources (EOG) | $77.7B | 9.1x | 4.9x | 42.7% | 40.8% | 7.15% |
ExxonMobil (XOM) remains the 800-pound gorilla of the sector, trading at a premium 13.2x forward earnings with a significantly lower FCF yield of 4.24 percent. While Exxon has greater scale, Chevron is arguably a more efficient cash-return machine at current prices. ConocoPhillips (COP) and EOG Resources (EOG) offer higher operating margins and slightly better FCF yields, but they lack the integrated downstream (refining and chemicals) assets that provide Chevron with a natural hedge during periods of low crude prices.
Chevron’s competitive moat is built on its geographical diversity and its massive scale. The company’s ability to double production in Venezuela while simultaneously exploring high-potential offshore blocks in Namibia demonstrates a level of operational flexibility that smaller peers cannot match. Moreover, its 17.89 percent operating margin is superior to Exxon’s 17.0 percent, suggesting that Chevron is extracting more profit from every dollar of revenue than its larger rival. For institutional investors, Chevron represents the “Goldilocks” of the sector: it has more growth than Exxon and more stability than the pure-play E&P names like EOG.
Options Gamma Pinning, Risk Bounds & Verdict
Now we return to the plumbing. The options market structure for Chevron is currently acting as a coiled spring. With a Max Pain strike of $217.50, there is a natural gravitational pull toward the upside. In the world of dealer gamma, when a stock trades below the Max Pain strike and the Put/Call ratio is extremely low, dealers are often “short gamma” on the call side. This means that as the stock price rises toward the $220 and $230 call walls, dealers must buy the underlying stock to hedge their positions, which can create a self-fulfilling rally.
The primary risk to this thesis is the $210 put support. If the stock breaks below $210, the dealer hedging becomes “short gamma” in the opposite direction, potentially forcing a liquidation toward the $200 put wall. However, the 30-day expected move of +/- $14.31 suggests that even a move to $200 would still keep the stock within its historical valuation range. Given the 6.37 percent FCF yield and the $12.08 billion in annual share repurchases, any significant dip is likely to be short-lived as the company’s own buyback program acts as a structural bid in the market.
We are looking at a company that is fundamentally undervalued relative to its cash-generating power, yet is currently being treated like a speculative vehicle by the options market. This disconnect creates an opportunity. The Wall Street consensus is heavily weighted toward “Overweight” due to index-benchmarking requirements, but our unconstrained analysis suggests that the fundamental floor is much higher than the market currently appreciates. The combination of Namibia exploration upside, Venezuelan production recovery, and an aggressive share repurchase program makes Chevron one of the most compelling risk-adjusted plays in the energy sector today.
AllWallSt Investment Verdict: BUY
Chevron Corporation (CVX)
Trailing P/E
Marcus Wolfe Screen
Leverage Profile
30D Channel
Dealer Gamma Pinning & Max Pain Alignment (CVX)
Pristine cash flow conversion (2.76x) and healthy accrual ratio (-6.68%). Zero accounting anomalies detected (LOW ANOMALY RISK).
Prudent Leverage (0.36x Net Debt/EBITDA); well within investment-grade covenant headroom.
Favorable equity risk premium (+1.39% FCF yield spread over 4.98% US 10-Yr Treasury benchmark).
Max Pain: $217.50 (+3.77%) | P/C Ratio: 0.39 | 30D Channel: $195.28 – $223.90. Dealer gamma bounded between $200 Put Wall and $230 Call Wall.
CVX represents a core ~0.7% index pillar. Institutional managers face persistent benchmark drag if under-allocated during sector rallies, biasing sell-side consensus toward institutional overweight.
$196.00 – $204.00 (Options Support Pinning)
Sustained weekly close below $200.00 (Put Wall) or gross margin compression below 44.38%.
Sources & References
- Chevron Corporation Investor Relations: https://www.chevron.com/investors
- SEC EDGAR Search (CIK 0000093410): https://www.sec.gov/edgar/browse/?CIK=0000093410
- Chevron Form 10-Q (Filed Nov 5, 2026): https://www.sec.gov/Archives/edgar/data/93410/000009341026000200/cvx-20260930.htm
- Chevron Form 10-K (Filed Feb 24, 2026): https://www.sec.gov/Archives/edgar/data/93410/000009341026000078/cvx-20251231.htm
Regulatory Disclaimer: This report is for informational purposes only and does not constitute financial, legal, or investment advice. AllWallSt is a financial journalism outlet, not a registered investment advisor. Investing in equities and options involves significant risk, including the potential loss of principal. Past performance is not indicative of future results. Quantitative metrics and options flow data are subject to market volatility and may change without notice. Always consult with a licensed financial professional before making investment decisions.