
The most reliable law of corporate physics is that any sufficiently large technology company, given enough time and a stagnant stock price, will eventually declare itself an Artificial Intelligence company. It is a bit like a mid-life crisis, but instead of buying a convertible, the company buys a software firm for $28 billion and starts talking about “low-latency fabrics.”
Cisco Systems, Inc. (CSCO) is currently in the middle of this transformation. For decades, Cisco was the company that sold you the heavy, beige boxes that made the internet work. They were the plumbers of the digital age. But plumbing is a difficult business to get people excited about when the 10-Year Treasury yield is sitting at 5.00%. If you are going to ask investors to buy a networking company with a 2.78% Free Cash Flow (FCF) yield, you cannot just tell them you sell routers. You have to tell them you sell the “AI Backplane.”
The market seems to be buying it. Over the last 48 hours, the consensus has shifted from a cautious wait and see approach to a full-throated upgrade cycle. Shares moved up 3.36% today, fueled by a chorus of analysts suggesting that we have all “underestimated the AI opportunity.” The narrative is simple: as hyperscalers build massive GPU clusters, they need faster ways to connect them. Cisco, via its acquisition of Splunk and its new Silicon One architecture, is positioning itself as the toll collector for this new data highway.
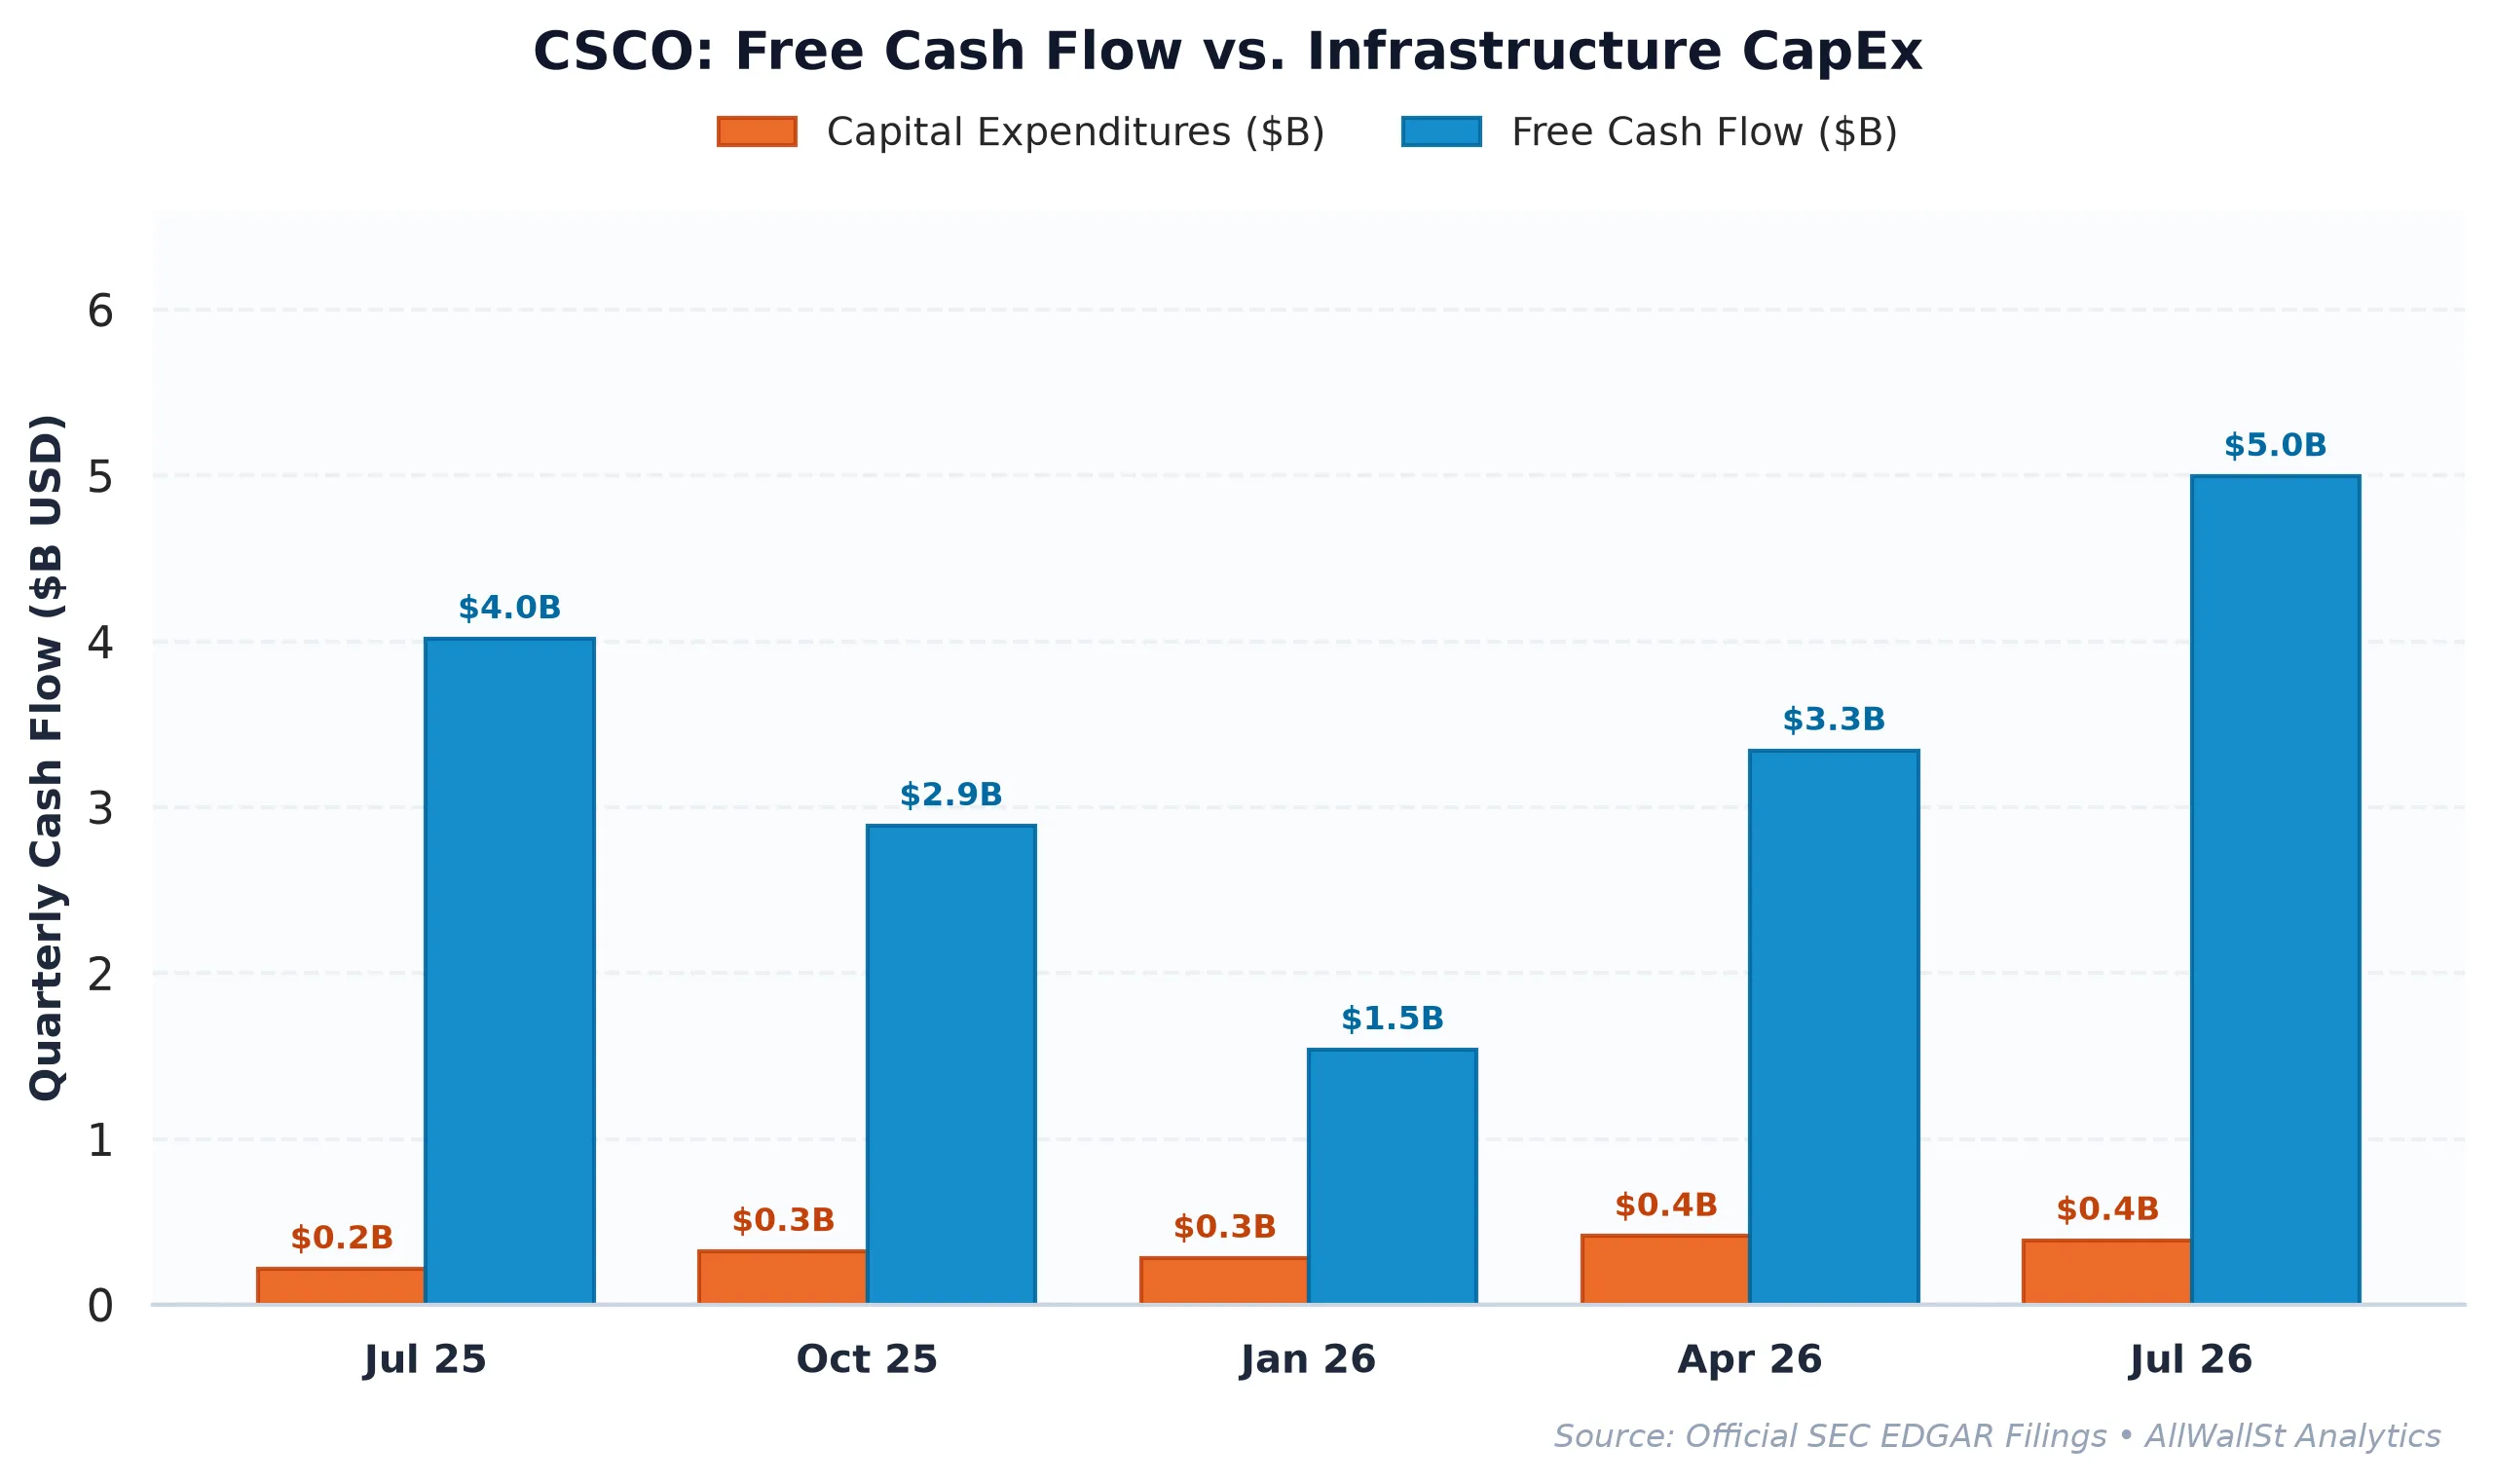
The Circular Economy of Networking Cash
When you look past the “AI Ethernet” marketing, the actual financial machinery of Cisco Systems, Inc. (CSCO) tells a more nuanced story. This is a company that generates a lot of cash, but it is also a company that spends a significant portion of that cash just to keep its share count from exploding.
In the fiscal year 2026, Cisco reported $12.77 billion in Free Cash Flow. On the surface, that is a formidable number. However, the company also issued $3.83 billion in Stock-Based Compensation (SBC). That represents 27% of its operating cash flow. To offset this dilution, Cisco spent $7.98 billion on share repurchases. If you do the math, nearly half of the buyback program is essentially just a transfer of wealth from shareholders to employees to keep the share count flat. It is a circular economy: Cisco pays employees in stock, then uses the cash it earned from selling routers to buy that stock back so the “Earnings Per Share” number looks better.
The historical trajectory shows a company that is working very hard to stay in the same place. In 2023, operating margins were a healthy 27.3%. By 2025, they had dipped to 22.1% as the company integrated Splunk and navigated a post-pandemic inventory glut. While margins have recovered to 25.4% in 2026, they are still below the levels seen three years ago.
| Period | Revenue | Operating Income | Operating Margin | Free Cash Flow | SBC Expense |
|---|---|---|---|---|---|
| FY2023 | $57.00B | $15.56B | 27.3% | $19.04B | $2.35B |
| FY2024 | $53.80B | $12.97B | 24.1% | $10.21B | $3.07B |
| FY2025 | $56.65B | $12.50B | 22.1% | $13.29B | $3.64B |
| FY2026 | $63.33B | $16.06B | 25.4% | $12.77B | $3.83B |
Cisco is growing revenue at 17.6% year over year, which is respectable for a $400 billion titan. But it is doing so with a capital intensity that is increasing. CapEx now sits at nearly $3 billion annually. The “Rule of 40” score of 35.3% puts it in the “solid” category, but it is not quite the hyper-growth profile that the current AI hype would suggest.
The Relative Valuation Asymmetry
The fundamental problem for Cisco is not that it is a bad business; it is that it is being priced like a growth business in an environment where the “risk-free” alternative is incredibly attractive. The 10-Year Treasury yield is 5.00%. Cisco’s FCF yield is 2.78%. This means you are accepting a -2.22% spread to own Cisco instead of a government bond. For that to make sense, you have to believe that Cisco’s future growth will be so explosive that the current price is a bargain.
When we compare Cisco to its peers, the valuation looks even more stretched on a cash-flow basis.
| Company (Ticker) | Market Cap | Forward P/E | EV/EBITDA | Rev Growth (YoY) | Operating Margin | FCF Yield |
|---|---|---|---|---|---|---|
| Cisco Systems (CSCO) | $401.6B | 18.1x | 21.6x | 17.60% | 25.39% | 2.78% |
| Microsoft (MSFT) | $3.87T | 21.5x | 19.6x | 18.8% | 47.1% | 0.08% |
| Alphabet (GOOGL) | $3.61T | 19.0x | 18.5x | 24.7% | 33.3% | -0.03% |
| Oracle (ORCL) | $400.4B | 11.6x | 14.4x | 29.6% | 34.3% | -11.45% |
Oracle (ORCL), for instance, is growing revenue at nearly 30% and has significantly higher operating margins, yet it trades at a much lower forward P/E of 11.6x. While Oracle’s FCF yield is currently negative due to massive cloud CapEx investments, the growth-adjusted valuation suggests that the market is paying a premium for Cisco’s perceived safety and its dividend, which currently yields 1.71%.
The market is treating Cisco as a “safe” way to play the AI infrastructure boom. But safety is relative. If the AI build-out slows down, or if hyperscalers continue to move toward in-house custom silicon (ASICs) rather than buying off-the-shelf networking gear, Cisco’s “moat” might look more like a puddle.
Options Plumbing and the Earnings Pin
As we head into tomorrow’s earnings report, the market structure for Cisco is leaning heavily into the “AI breakout” narrative. The Put/Call Open Interest ratio is 0.53, which indicates a massive speculative long skew. Everyone is buying calls.
This creates a specific type of mechanical risk. When everyone is on one side of the boat, the boat tends to tip. Dealers are currently long a significant amount of gamma, particularly around the $105 strike, which serves as the primary Call Wall. If Cisco delivers a “good but not great” report, the decay of those out-of-the-money calls will force dealers to sell the underlying stock to stay delta-neutral.
The “Max Pain” strike sits at $105.00, about 3% above current prices. This suggests that the options market is positioned for a move toward that level, but the heavy call concentration at $110 and $115 acts as a ceiling. Unless Cisco provides a truly transformative upward revision to its guidance, the mechanical gravity of dealer hedging is likely to pin the stock near current levels or trigger a “sell the news” liquidation if the speculative momentum stalls.
The expected 30-day move is +/- 21.77%, which is exceptionally high for a mature networking company. This tells us that the market is no longer pricing Cisco as a boring utility; it is pricing it as a high-beta AI play. When a company’s identity shifts from “reliable plumbing” to “speculative growth,” the margin for error disappears.
Cisco is a fine company. It has a solid balance sheet, a dominant position in enterprise networking, and a management team that knows how to navigate cycles. But at 18x forward earnings and a FCF yield that doesn’t even cover the inflation rate (let alone the Treasury yield), the risk-reward has moved into “prove it” territory. We are happy to watch the AI rebrand from the sidelines until the valuation reflects the reality of the cost of capital.
AllWallSt Investment Verdict: HOLD
Cisco Systems, Inc. (CSCO)
Trailing P/E
Marcus Wolfe Screen
Leverage Profile
30D Channel
Dealer Gamma Pinning & Max Pain Alignment (CSCO)
🎯 Max Pain: $105.00
Spot $101.85
Ceiling $105C Resistance
MODERATE WATCHLIST (1 flag): Inventory growth outpaced COGS growth by >15%, signaling potential inventory bloat or pending margin compression.
Prudent Leverage (0.82x Net Debt/EBITDA); well within investment-grade covenant headroom.
Negative yield spread (-2.21% vs 5.00% Treasury); equity requires robust multiple expansion or growth.
Max Pain: $105.00 (+3.09%) | P/C Ratio: 0.53 | 30D Channel: $79.68 – $124.02. Dealer gamma bounded between $80 Put Wall and $105 Call Wall.
CSCO represents a core ~0.7% index pillar. Institutional managers face persistent benchmark drag if under-allocated during sector rallies, biasing sell-side consensus toward institutional overweight.
Accumulation Deferred (Await Pullback toward $78.40 – $81.60 Support Pinning)
Sustained weekly close below $80.00 (Put Wall) or acceleration in margin compression.
Sources & References
- Official SEC Form 10-Q Quarterly Report (Filed 2026-05-19)
- SEC EDGAR: Cisco Systems, Inc. (CIK 0000858877) Primary Filings: https://www.sec.gov/edgar/browse/?CIK=0000858877
- Cisco Investor Relations: https://www.cisco.com
- Form 10-K (Filed 2026-09-02): https://www.sec.gov/Archives/edgar/data/858877/000085887726000132/csco-20260725.htm
- Form 8-K (Filed 2026-05-13): https://www.sec.gov/Archives/edgar/data/858877/000085887726000075/csco-20260513.htm
Regulatory Disclaimer: This report is for informational purposes only and does not constitute financial, legal, or investment advice. AllWallSt is a financial journalism outlet and is not a registered investment advisor. Investing in public equities involves substantial risk. Past performance is not indicative of future results. The author and AllWallSt may hold positions in the securities mentioned. Always consult with a qualified financial professional before making investment decisions. Data provided by SEC EDGAR and primary exchange feeds. All figures are in USD unless otherwise noted.