
The business of being a global systemic bank is mostly about having a very large balance sheet and convincing people that you are too boring to fail. For years, Citigroup Inc. (C) struggled with the second half of that equation, operating as a sprawling collection of international outposts that seemed to produce more regulatory consent decrees than consistent shareholder returns. But the narrative is shifting.
Under the current regime, the bank is attempting a two-pronged evolution: becoming a lean wealth management machine while simultaneously acting as the high-tech plumbing for the future of digital finance. On Wednesday, the bank announced a partnership with Circle to help the World Bank study stablecoin payouts for development payments. While stablecoins are often associated with the more speculative corners of the internet, this is a move into institutional infrastructure. It is about moving money across borders faster and cheaper, using Citigroup’s $1.17 trillion cash pile as the ultimate anchor of trust.
This pivot comes at a time when the macro environment is unforgiving. With the US 10-Year Treasury yield hovering at 5.10%, the hurdle for equity capital is high. Investors no longer reward banks for simply existing; they reward them for generating a Return on Equity (ROE) that actually exceeds the cost of capital. Citigroup is currently reporting a net profit margin of 23.21%, suggesting that the internal plumbing is finally starting to clear.
Digital Pipes and the World Bank Experiment
The collaboration with Circle to test USDC stablecoins for the World Bank is a classic Citigroup move: find a complex, cross-border regulatory problem and solve it with technology. In the old world, sending aid to developing nations involved a series of correspondent banks, high fees, and days of settlement risk. In the new world, Citigroup wants to be the gatekeeper that bridges traditional fiat currency with blockchain-based settlement.
This is not just about being “innovative” for the sake of a press release. It is about defending the bank’s core Services division, which is the crown jewel of the new strategy. When you move money for the World Bank, you are essentially embedding yourself into the sovereign financial architecture of the planet. It creates a level of “stickiness” that a standard retail deposit base simply cannot match.
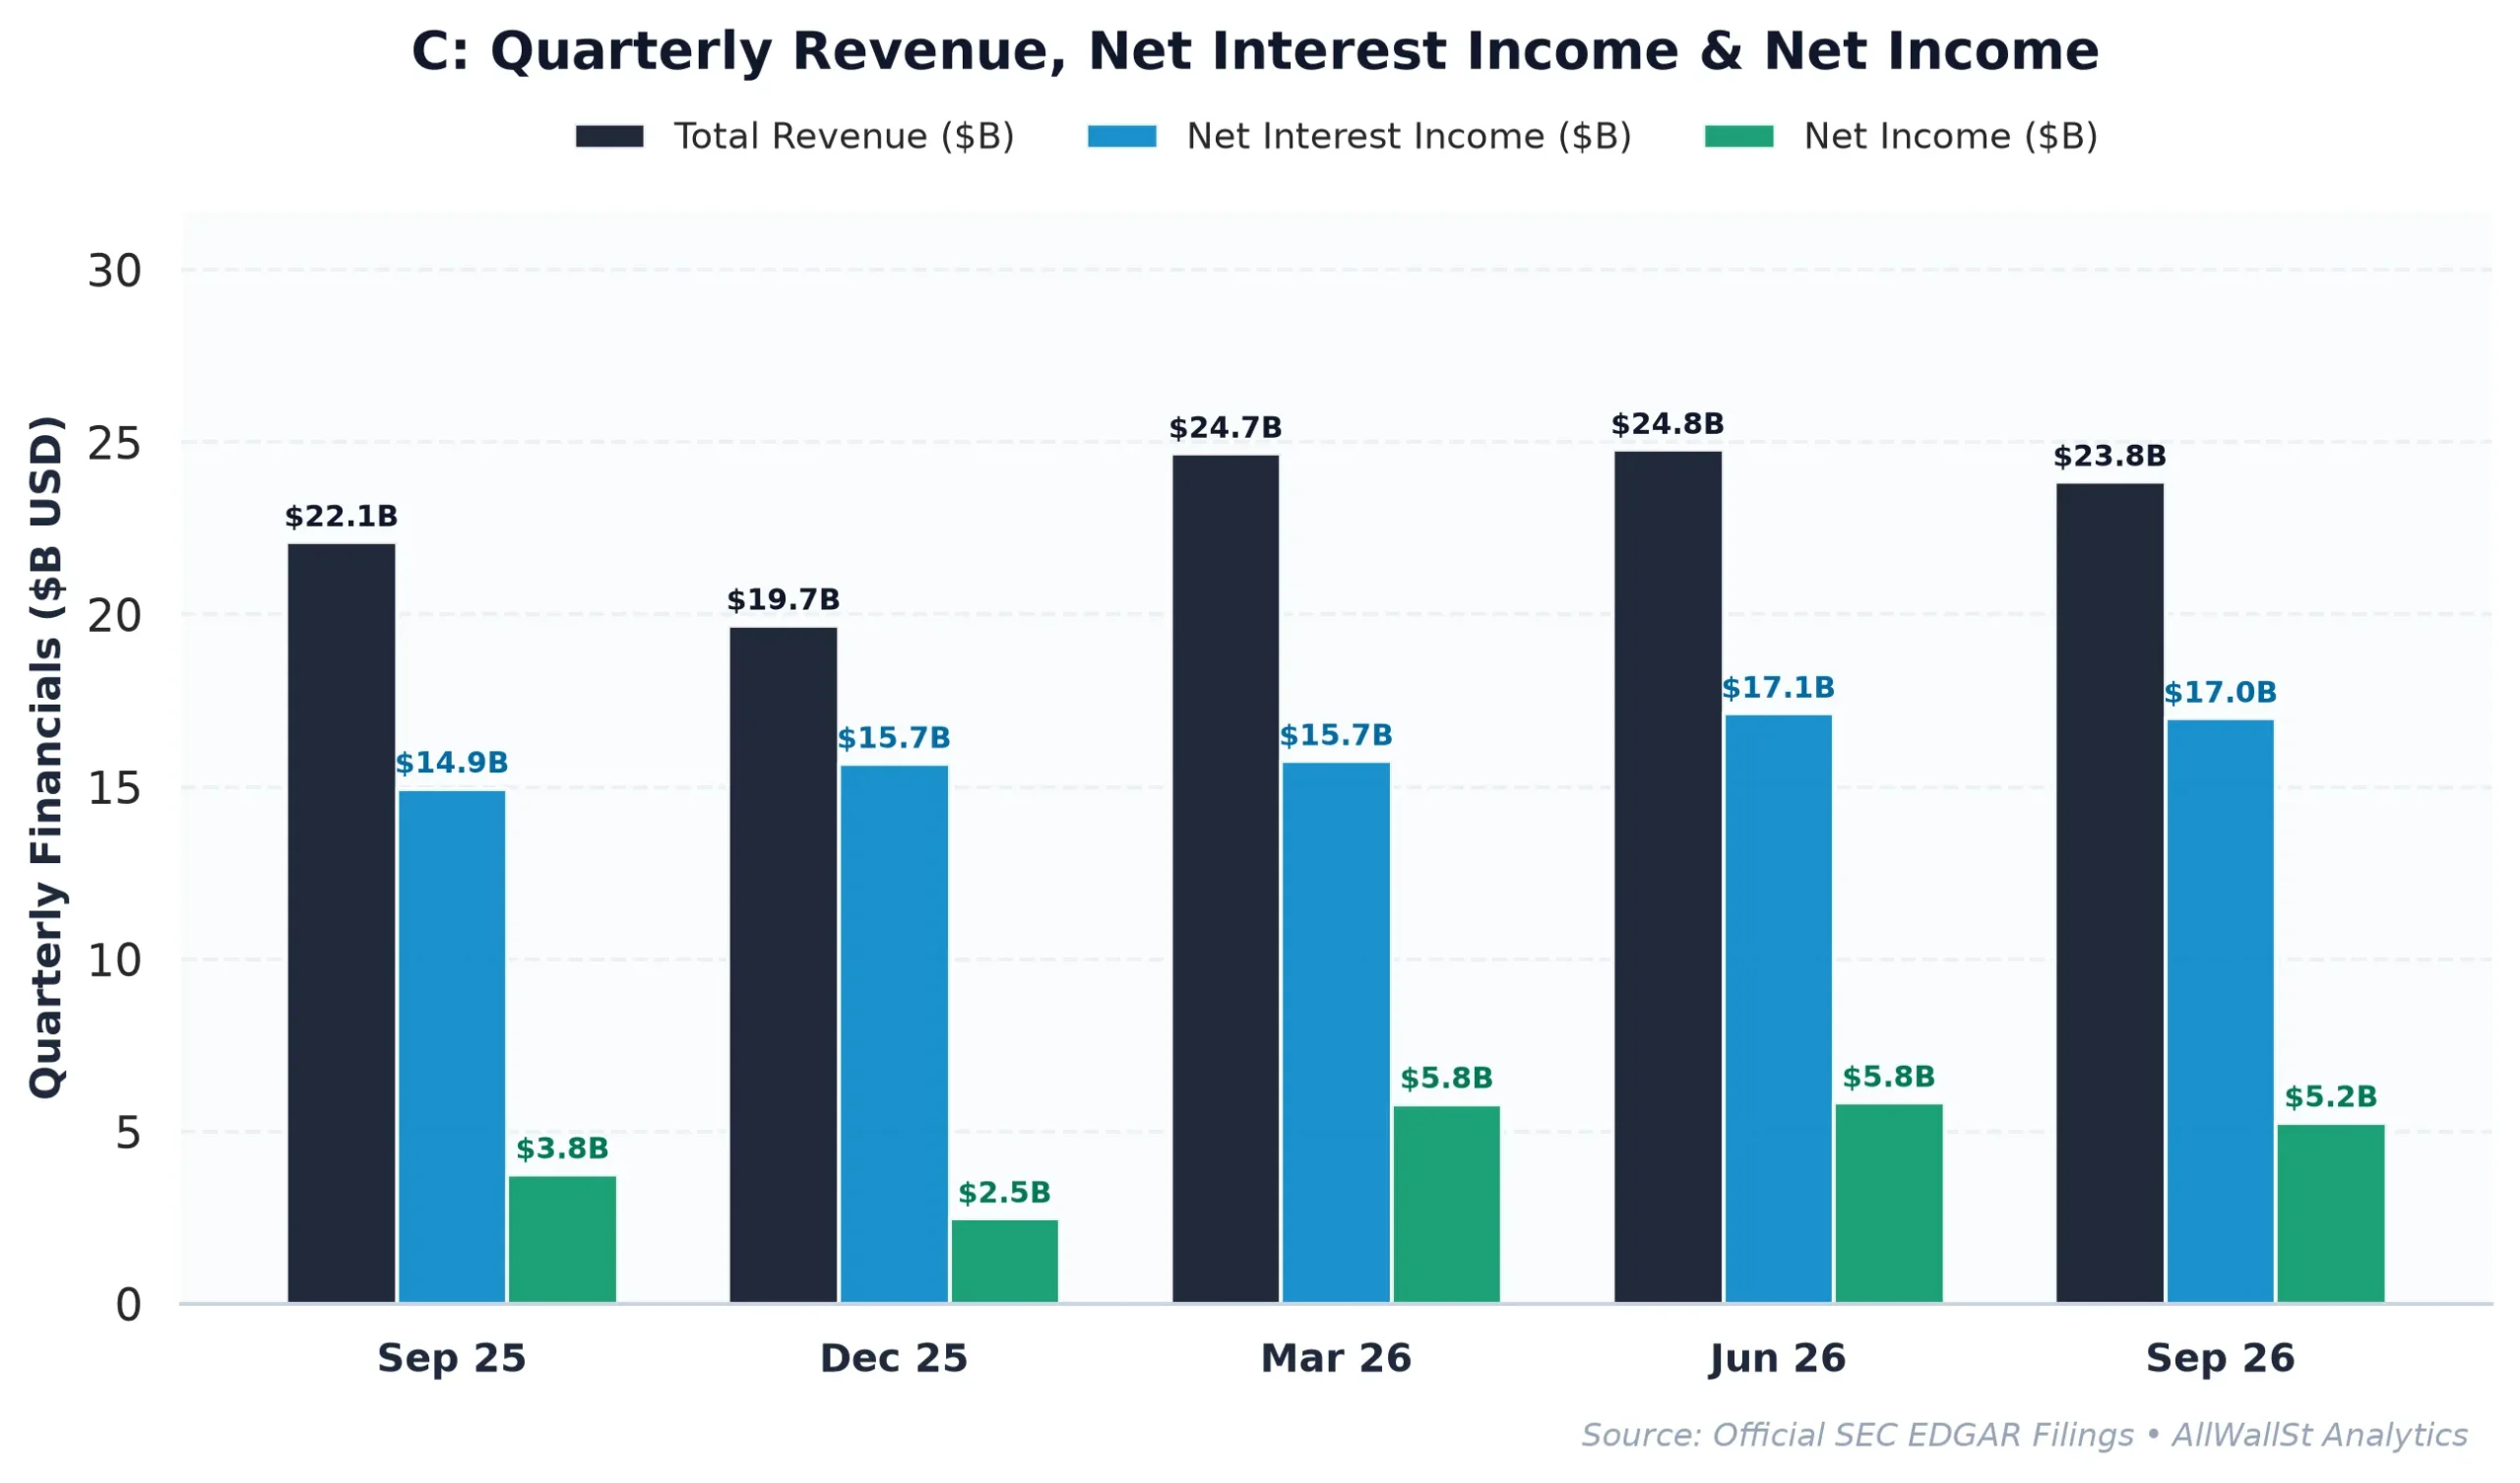
Financially, this strategy is starting to show up in the numbers. In the third quarter of 2026, the company reported net income of $5.2 billion, or $2.85 per diluted share. This is a significant jump from the $3.8 billion reported in the same period last year. Revenue hit $23.8 billion, proving that even as the bank prunes its international retail footprint, the core institutional engine is gaining RPMs.
The Five Trillion Dollar Wealth Ambition
While the digital pipes are being upgraded, the bank is also going hunting for assets. Citigroup recently signaled it is targeting $5 trillion in client wealth currently held by rivals. To put that in perspective: it is a number so large it sounds like a rounding error in a federal budget, but it represents a massive shift in how the bank intends to earn its keep.
Wealth management is a capital-light business. Unlike traditional lending, where you have to set aside expensive capital for every dollar you loan out, wealth management generates fees based on assets under management. It is a high-ROE business that the market typically rewards with a higher multiple. Currently, Citigroup’s ROE stands at 9.35%, which is respectable but still trails the industry titans. By chasing that $5 trillion, management is attempting to bridge the gap between being a “utility bank” and a “fee machine.”
The historical trajectory shows a steady climb in Net Interest Income (NII), which hit $59.79 billion in FY2025. This is the “spread” the bank earns by paying you very little for your deposits and charging everyone else quite a bit more for loans. In a 5.10% yield environment, that spread is a powerful tailwind, provided the bank can keep its “deposit beta” (the speed at which it has to raise rates for savers) under control.
Closing the Gap with the Goliaths
The primary investment thesis for Citigroup has always been a “mean reversion” play. For years, the stock traded at a deep discount to its tangible book value: the theoretical price you would get if you sold all the desks, liquidated the loans, and paid off the debts. Today, the stock trades at 1.04x Price-to-Book (P/B). It has finally reached the point where the market believes the bank is actually worth what its accountants say it is.
| Company (Ticker) | Market Cap | Forward P/E | P/B | ROE | Rev Growth (YoY) | Dividend Yield |
|---|---|---|---|---|---|---|
| Citigroup (C) | $198.5B | 9.2x | 1.04x | 9.35% | 8.00% | 2.23% |
| JPMorgan Chase (JPM) | $876.2B | 12.9x | 2.49x | 18.01% | 10.2% | 2.00% |
| Bank of America (BAC) | $341.1B | 9.5x | 1.26x | 10.73% | 3.4% | 2.59% |
| Wells Fargo (WFC) | $248.2B | 10.3x | 1.56x | 12.91% | 0.4% | 2.42% |
When compared to its peers, the valuation gap remains stark. JPMorgan Chase (JPM) trades at a 2.49x P/B, more than double Citigroup’s multiple. While JPMorgan earns its premium through a massive 18.01% ROE, Citigroup’s path to a higher stock price does not require it to become JPM. It simply needs to continue its current trajectory of operational efficiency. With a forward P/E of just 9.2x, the market is still pricing in a “skepticism discount” that the underlying financials are starting to invalidate.
The bank is also returning an immense amount of capital to shareholders. The total shareholder yield, which combines the 2.23% dividend with a massive buyback program, stands at 11.42%. In a world where the risk-free rate is 5.10%, getting double-digit returns through capital returns alone is a compelling proposition for institutional managers who are tired of chasing volatile tech multiples.
Gamma Floors and the Path to One-Twenty-Three
The options market currently reflects a defensive posture with a dash of “coiled spring” potential. The Put/Call Open Interest ratio is 1.51, meaning there are significantly more protective puts being bought than speculative calls. In the world of market plumbing, this creates a “Put Wall” at the $110 strike, where over 44,000 contracts are sitting. This acts as a structural floor: as the stock approaches $110, options dealers are forced to buy shares to hedge their positions, effectively providing a mechanical bid.
On the upside, the “Max Pain” strike sits at $123.00. This is the price point where the maximum number of options contracts expire worthless. Toward monthly expiration, the stock often exhibits a magnetic pull toward this level as dealers adjust their hedges. With the current price near $119.94, the path of least resistance appears to be a drift toward that $123 magnet.
The expected 30-day move is roughly 9.56% in either direction. Given the solid Q3 results and the lack of new regulatory “surprises” in recent 8-K filings, the risk-reward profile favors the upside. The bank is no longer the “problem child” of the Big Four; it is a restructuring story that is finally entering the execution phase.
Investment Committee Steelman Dissent: The primary risk to the bull case is a sudden spike in deposit betas or a sharp deterioration in credit quality that forces higher loan-loss provisions, which would stall the ROE expansion. Additionally, if the World Bank stablecoin trials encounter regulatory friction, the “tech-forward” narrative could lose its luster, leaving the stock trapped at its current book value.
AllWallSt Investment Verdict: BUY (Initiation)
Citigroup Inc. (C)
Trailing P/E
Marcus Wolfe Screen
Leverage Profile
30D Channel
Dealer Gamma Pinning & Max Pain Alignment (C)
🎯 Max Pain: $123.00
Spot $119.94
Ceiling $130C Resistance ▲
Banking liquidity & regulatory capital compliant (Basel III / CET1 governed); deposit & trading settlement flows normalized.
Tier 1 Regulatory Capital & Liquidity Coverage Ratio (LCR) compliant; balance sheet governed by Basel III capital buffers.
Evaluated against 5.10% US 10-Yr Benchmark; bank net interest margins sensitive to yield curve slope (2s10s spread) and deposit beta.
Max Pain: $123.00 (+2.55%) | P/C Ratio: 1.51 | 30D Channel: $108.47 – $131.41. Dealer gamma bounded between $110 Put Wall and $130 Call Wall.
C carries standard index weighting (< 0.6% SPY footprint); sell-side consensus reflects standard earnings momentum rather than index-tracking mandates.
$107.80 – $112.20 (Options Support Pinning)
Sustained weekly close below $110.00 (Put Wall) or compression in ROE and net interest margins.
Bearish IC Dissent: At 11.7x trailing earnings and 9.35% ROE (1.04x P/B) against a 5.10% 10-year risk-free hurdle, Citigroup Inc. (C) leaves limited cushion for top-line deceleration or net interest margin and credit quality compression. If institutional flows break below the $110 put wall, dealer de-hedging can accelerate multiple contraction before fundamental buyers step in.
Investigative Reporting & Public Record Sourcing: Dispatches published under Word on Wall St constitute financial news reporting, investigative journalism, and market commentary on matters of public and economic interest. Information is synthesized from publicly available regulatory filings (including SEC Form 8-K, Form 10-K, and Form 10-Q disclosures), official corporate press communications, verified news reports, and discussions with institutional market participants.
Presumption of Innocence & Unadjudicated Allegations: Any references to executive conduct, personal relationships, workplace misconduct, whistleblower claims, espionage inquiries, internal governance reviews, or government investigations represent reported allegations and active inquiries as of the publication date. They do not constitute formal judicial determinations, legal verdicts, or findings of guilt, civil liability, or statutory wrongdoing unless expressly identified as adjudicated final court judgments.
Protected Editorial Commentary & Non-Investment Counsel: All quantitative scenario analyses, key-person risk haircuts, forward valuation estimates, dealer gamma pinning levels, and investment conviction ratings reflect protected analytical opinion, editorial commentary, and financial modeling under the First Amendment. Nothing herein constitutes legal counsel, personal tax advice, or individualized investment advice. AllWallSt and its contributors assume no liability for trading, investment, or commercial decisions taken on the basis of this report.
Sources & References
- Official SEC Form 10-K Annual Report (Filed 2026-02-20)
- SEC Form 8-K Exhibit 99.x (2026-10-22)
- SEC Form 8-K Exhibit 99.x (2026-10-13)
- SEC DEF 14A Proxy / M&A Filing (2026-04-02)
- Federal Register (2026-11-04): Combined Notice of Filings #1
- Federal Register (2026-06-08): Rescission of Policy Relating to the Acceptance of Settlements in Administrative and…
- Federal Docket: CITIGROUP MORTGAGE LOAN TRUST 2021-A v. ADAMS (2026-11-05)
- Citigroup Inc. SEC EDGAR Filings: https://www.sec.gov/edgar/browse/?CIK=0000831001
- Citigroup Investor Relations: https://www.citigroup.com/global/investors
- SEC Form 10-Q (Filed 2026-11-05): https://www.sec.gov/Archives/edgar/data/831001/000083100126000056/c-20260930.htm
- SEC Form 8-K (Filed 2026-10-13): https://www.sec.gov/Archives/edgar/data/831001/000110465926115323/c-20261013x8k.htm
Regulatory Disclaimer: This report is for informational purposes only and does not constitute financial, legal, or investment advice. AllWallSt and its analysts are not registered investment advisors. Financial markets involve significant risk, and past performance is not indicative of future results. Always consult with a certified financial professional before making investment decisions. Data provided is sourced from primary regulatory filings and market feeds; however, accuracy cannot be guaranteed. AllWallSt may hold positions in the securities mentioned.