
The mainstream media narrative heading into earnings season is soothingly familiar. Financial news outlets are celebrating The Coca-Cola Company (KO) as it hits new all-time highs above $92 per share. Commentators are offering tutorials on how retail investors can manufacture passive monthly income from the stock, framing the beverage giant as the ultimate, unshakeable sanctuary for volatile economic times.
If you read enough financial commentary, the thesis sounds almost frictionless. People drink soda during recessions. They drink soda during expansions. Therefore, buying Coca-Cola at an all-time high is treated not as a valuation decision, but as a moral act of prudence.
There is, however, a minor structural detail that financial networks tend to skim over when praising safe havens: the cold mathematics of cash return relative to risk-free sovereign paper.
The Negative Equity Risk Premium Problem
To understand what you are actually buying when you acquire equity in The Coca-Cola Company at current levels, you have to look past brand equity and look directly at cash yields.
At a share price of $92.29, the company trades at a trailing price-to-earnings multiple of 27.7x and a forward multiple of 26.18x. Its enterprise value stands at $428.94 billion, representing an EV-to-EBITDA multiple of 25.24x. These are multiples usually reserved for asset-light technology platforms with compounding software margins, rather than mature physical distribution networks selling packaged consumer liquids.
More importantly, Coca-Cola currently generates a free cash flow yield of just 1.31%.
When you benchmark that 1.31% cash yield against the US 10-Year Treasury yield of 4.98%, the equity risk premium spread is negative 3.67%. In plain language: an investor buying Coca-Cola today is paying the company 367 basis points per year for the privilege of taking on equity duration risk, commodity price exposure, and global currency friction, all while earning substantially less cash yield than Uncle Sam guarantees on risk-free debt.
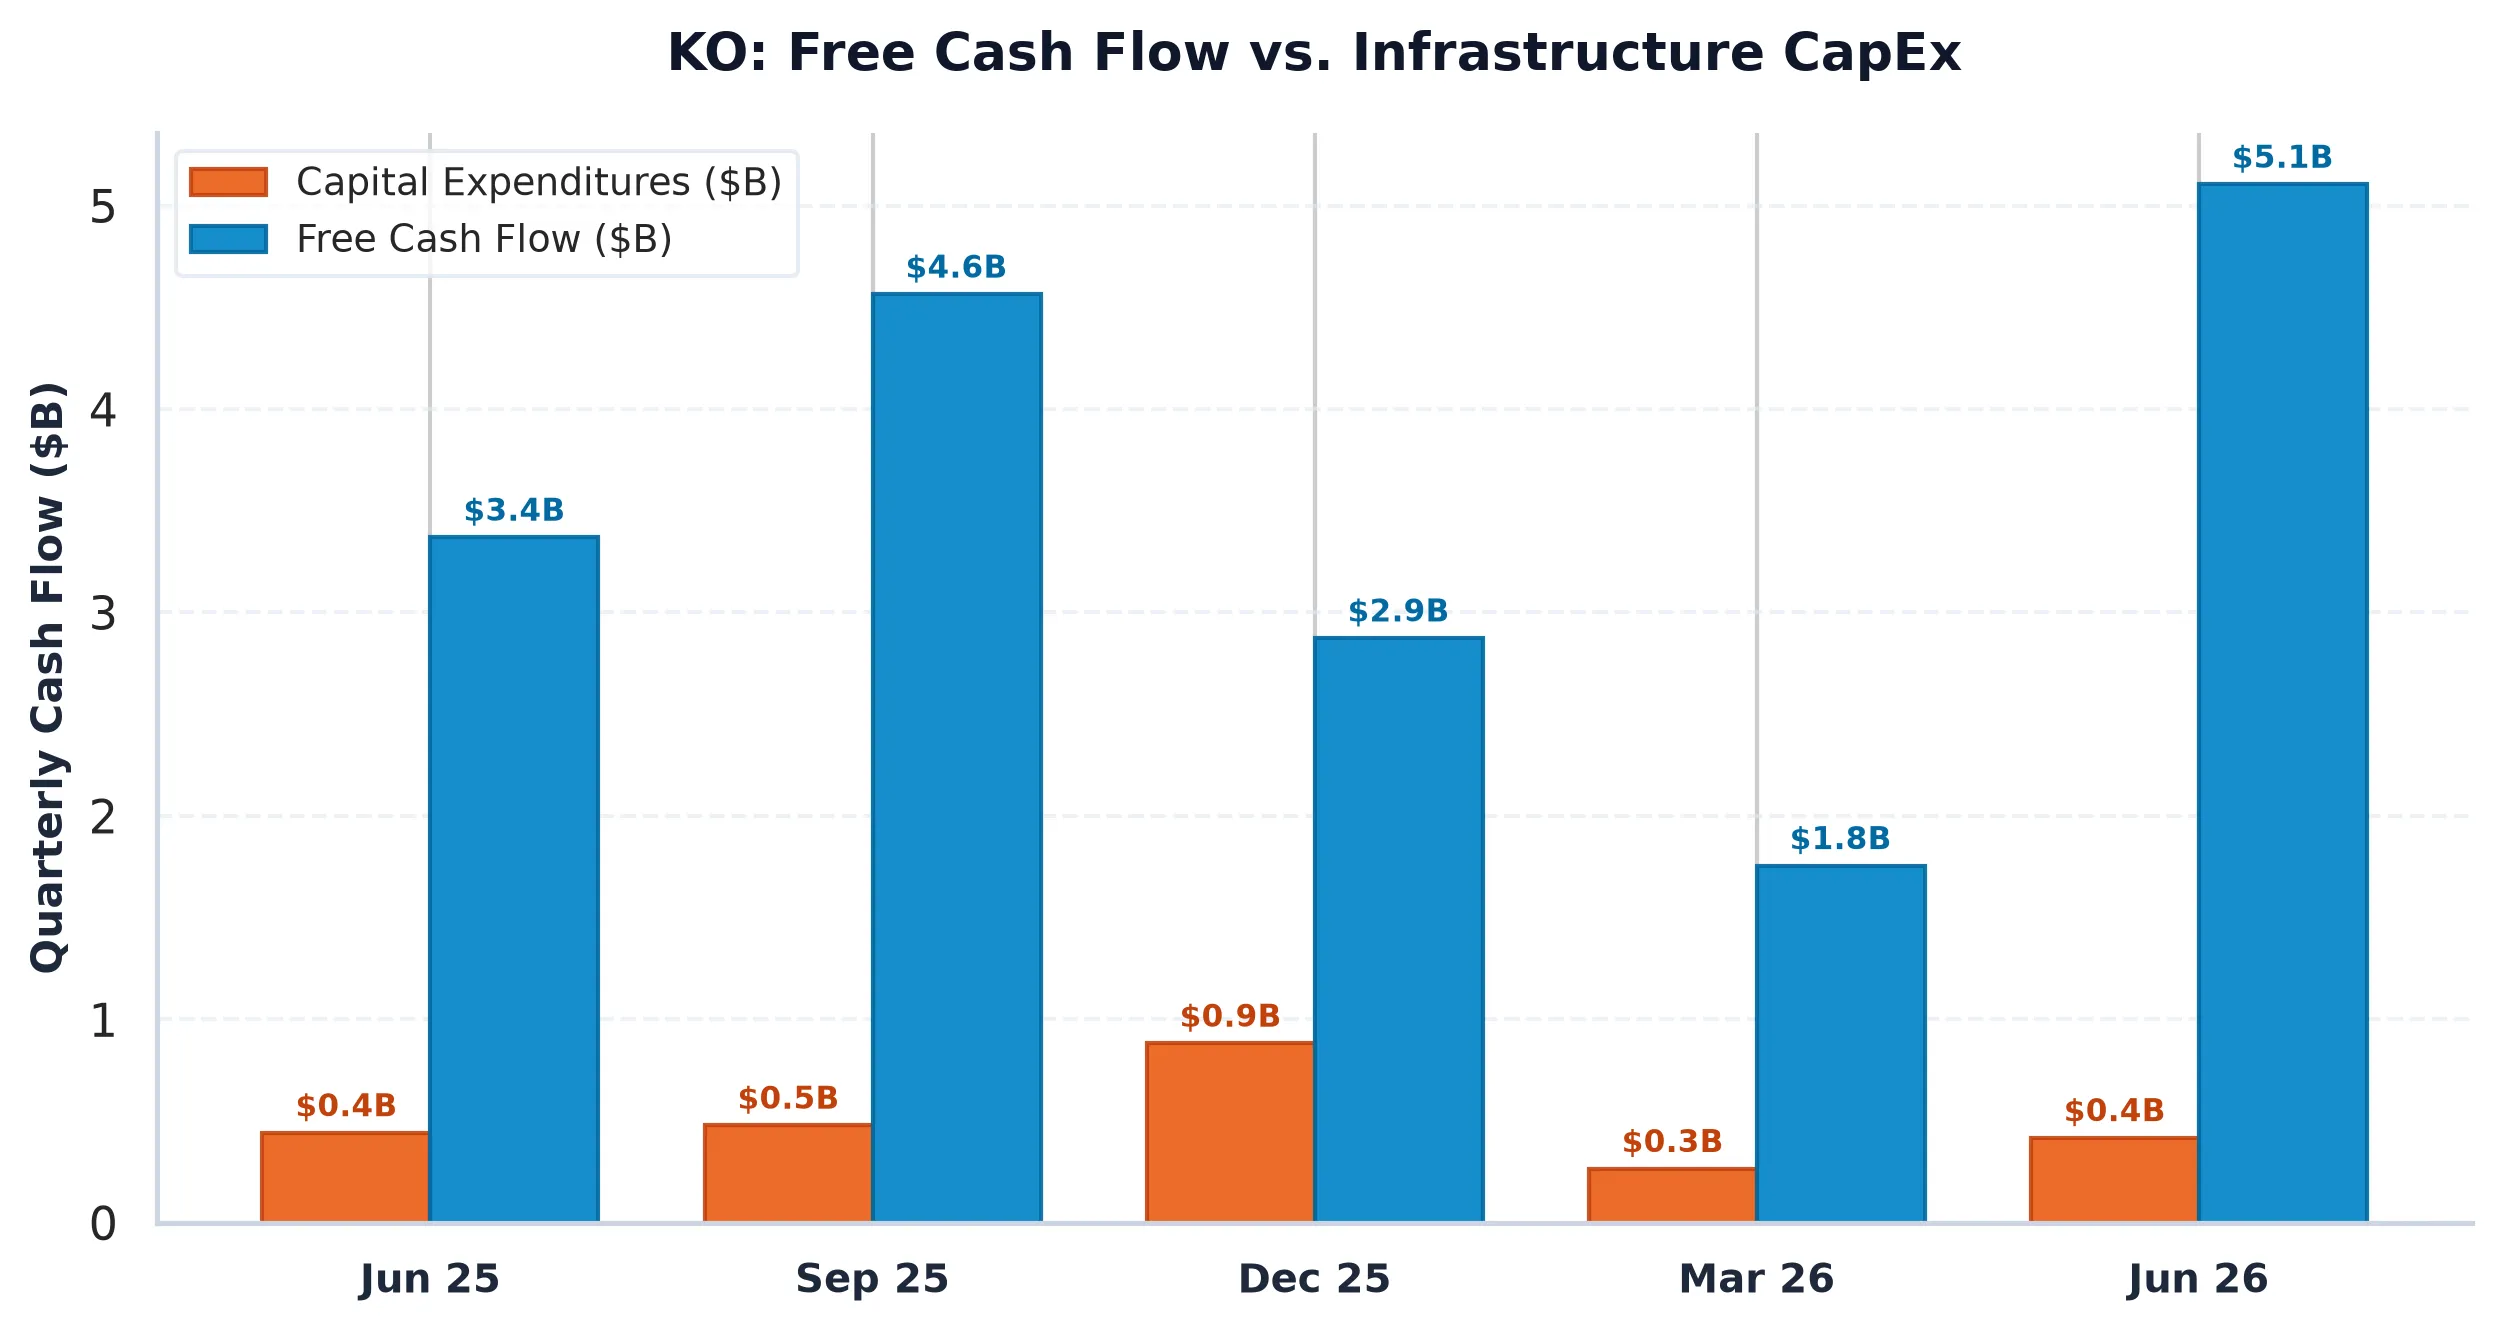
How does a enterprise with $50.13 billion in annual revenue and a gross margin of 61.89% produce a free cash flow yield of only 1.31%?
The answer lies in capital intensity and working capital demands. Capital expenditures have climbed to $11.12 billion, representing a CapEx-to-revenue ratio of 22.19%. While reported net income reaches $14.32 billion, actual economic free cash flow compresses to $5.22 billion. When weighed against $44.26 billion in total debt ($27.89 billion in net debt), the cash flow profile begins to look far more constrained than headline gross margins would suggest.
The Options Market Plumbing and Near-Term Pinning
While fundamental consensus views Coca-Cola as an unstoppable defensive compounder, derivatives positioning indicates that institutional desks are preparing for a ceiling.
Options market structure into the upcoming earnings cycle reveals a balanced yet heavily bound inventory profile. The aggregate Put/Call open interest ratio sits at 0.79.
================================================================================
THE COCA-COLA COMPANY (KO) OPTIONS MARKET STRUCTURE & GAMMA PROFILE
================================================================================
Current Spot Price:               $92.29
Max Pain Strike Price:            $90.00 (-2.47% from spot)
Primary Call Resistance Walls:    $95.00 (7,554 contracts) / $96.00 (7,516)
Primary Put Support Walls:     $89.00 (7,597 contracts) / $90.00 (7,578)
At-The-Money Implied Volatility:  33.59%
Implied 30-Day Move Envelope:     +/- $8.89 (+/- 9.63%)
================================================================================
The options plumbing illustrates clear boundaries for near-term price movement. The Max Pain strike sits down at $90.00, representing a negative 2.47% distance from current spot prices. Massive Call Walls at $95.00 (7,554 contracts) and $96.00 (7,516 contracts) create formidable dealer short-gamma resistance above, meaning any post-earnings rally will face systematic dealer hedging pressure as market makers sell stock into upside strength.
Conversely, strong Put Walls at $89.00 and $90.00 provide downside bid support. The market is pricing a 30-day expected move of +/- 9.63% ($8.89), yet institutional positioning suggests the stock is mathematically locked inside a narrow $90.00 to $95.00 channel through upcoming option expirations.
The Verdict on Consensus
The narrative that Coca-Cola is a risk-free sanctuary relies on confusing business stability with investment safety. The business itself is extraordinarily stable: return on equity is a stellar 42.05%, operating margins hold firm at 34.87%, and global brand dominance is undisputed.
However, paying 27.7x trailing earnings for 6.70% revenue growth during a high interest rate regime is not a defensive strategy. It is duration speculation dressed up in consumer staple attire. When a risk-free government bond yields 4.98% and a defensive stock yields 1.31% on free cash flow, the consensus safe haven is quietly harboring significant multiple risk.
The Coca-Cola Company (KO)
Trailing P/E
Marcus Wolfe Screen
Leverage Profile
30D Channel
Pristine cash flow conversion (0.57x) and healthy accrual ratio (5.44%). Zero accounting anomalies detected (LOW ANOMALY RISK).
Manageable liability structure relative to institutional cash flow.
Evaluated against 5.10% US 10-Yr Benchmark (FCF Spread: -3.67% (vs 10Y Yield of 4.98%)).
Max Pain: $90.00 (-2.47%) | P/C Ratio: 0.79 | 30D Channel: $85.68 – $98.91.
$84.91 – $88.60 (-4% to -8% Pullback Accumulation)
Sustained weekly close below $83.07 (-10.0% structural stop) or fundamental cash flow deterioration.