
The fundamental allure of a Real Estate Investment Trust (REIT) used to be simple: you buy a building, you collect rent, and you distribute the leftovers to shareholders who prefer steady checks over the adrenaline of Silicon Valley. Equinix, Inc. (EQIX) has spent the last decade complicating this narrative by rebranding the humble warehouse as a “digital infrastructure” powerhouse. It is a compelling story. In the age of artificial intelligence, the world needs more blinking lights in cold rooms, and Equinix owns the best cold rooms in the business.
However, the laws of physics and the laws of finance eventually converge. While the market treats Equinix like a high-flying software company, the balance sheet reveals a capital-intensive utility struggling with the gravity of a 5.1% interest rate environment. When the risk-free rate of return sits at 4.93%, an equity yielding 3.17% in free cash flow (FCF) is already asking for a lot of faith. When that FCF yield turns out to be a mirage supported by heavy stock-based compensation and a multi-year trajectory of declining cash generation, that faith starts to look like a liability.
The Core Thesis and the Cost of Carry
The central tension for Equinix, Inc. (EQIX) lies in the widening gap between its narrative as an AI beneficiary and the reality of its capital structure. As global futures open with the E-Mini S&P 500 near $7,614, the macro environment is no longer forgiving of “growth at any cost” models. The company currently trades at a forward P/E of 49.7x, a multiple usually reserved for asset-light software firms with 80% gross margins. Equinix, by contrast, is an asset-heavy business with a 52% gross margin and a voracious appetite for capital expenditure.
The market dislocation is most visible in the spread between the company’s earnings yield and the sovereign benchmark. With the 10-Year Treasury yield at 4.93%, the Equinix FCF yield of 3.17% represents a negative spread of 176 basis points. In institutional terms, investors are paying Equinix for the privilege of taking on corporate credit and operational risk, rather than simply lending money to the US government. This might be justifiable if cash flows were exploding, but the primary filings tell a different story.
Recent institutional movements underscore this skepticism. Sumitomo Mitsui Trust Group Inc. recently trimmed its position, a notable exit from a major institutional holder at a time when sell-side brokerages are still maintaining “Moderate Buy” ratings. The bull case, recently echoed by Citi with a $1,320 price target, relies on the assumption that data center pricing power will stay ahead of rising power costs and interest expenses. But for a company with $24.05B in net debt, the cost of carry is becoming a permanent drag on equity value.
Multi-Year Trajectory and the Cash Flow Vanishing Act
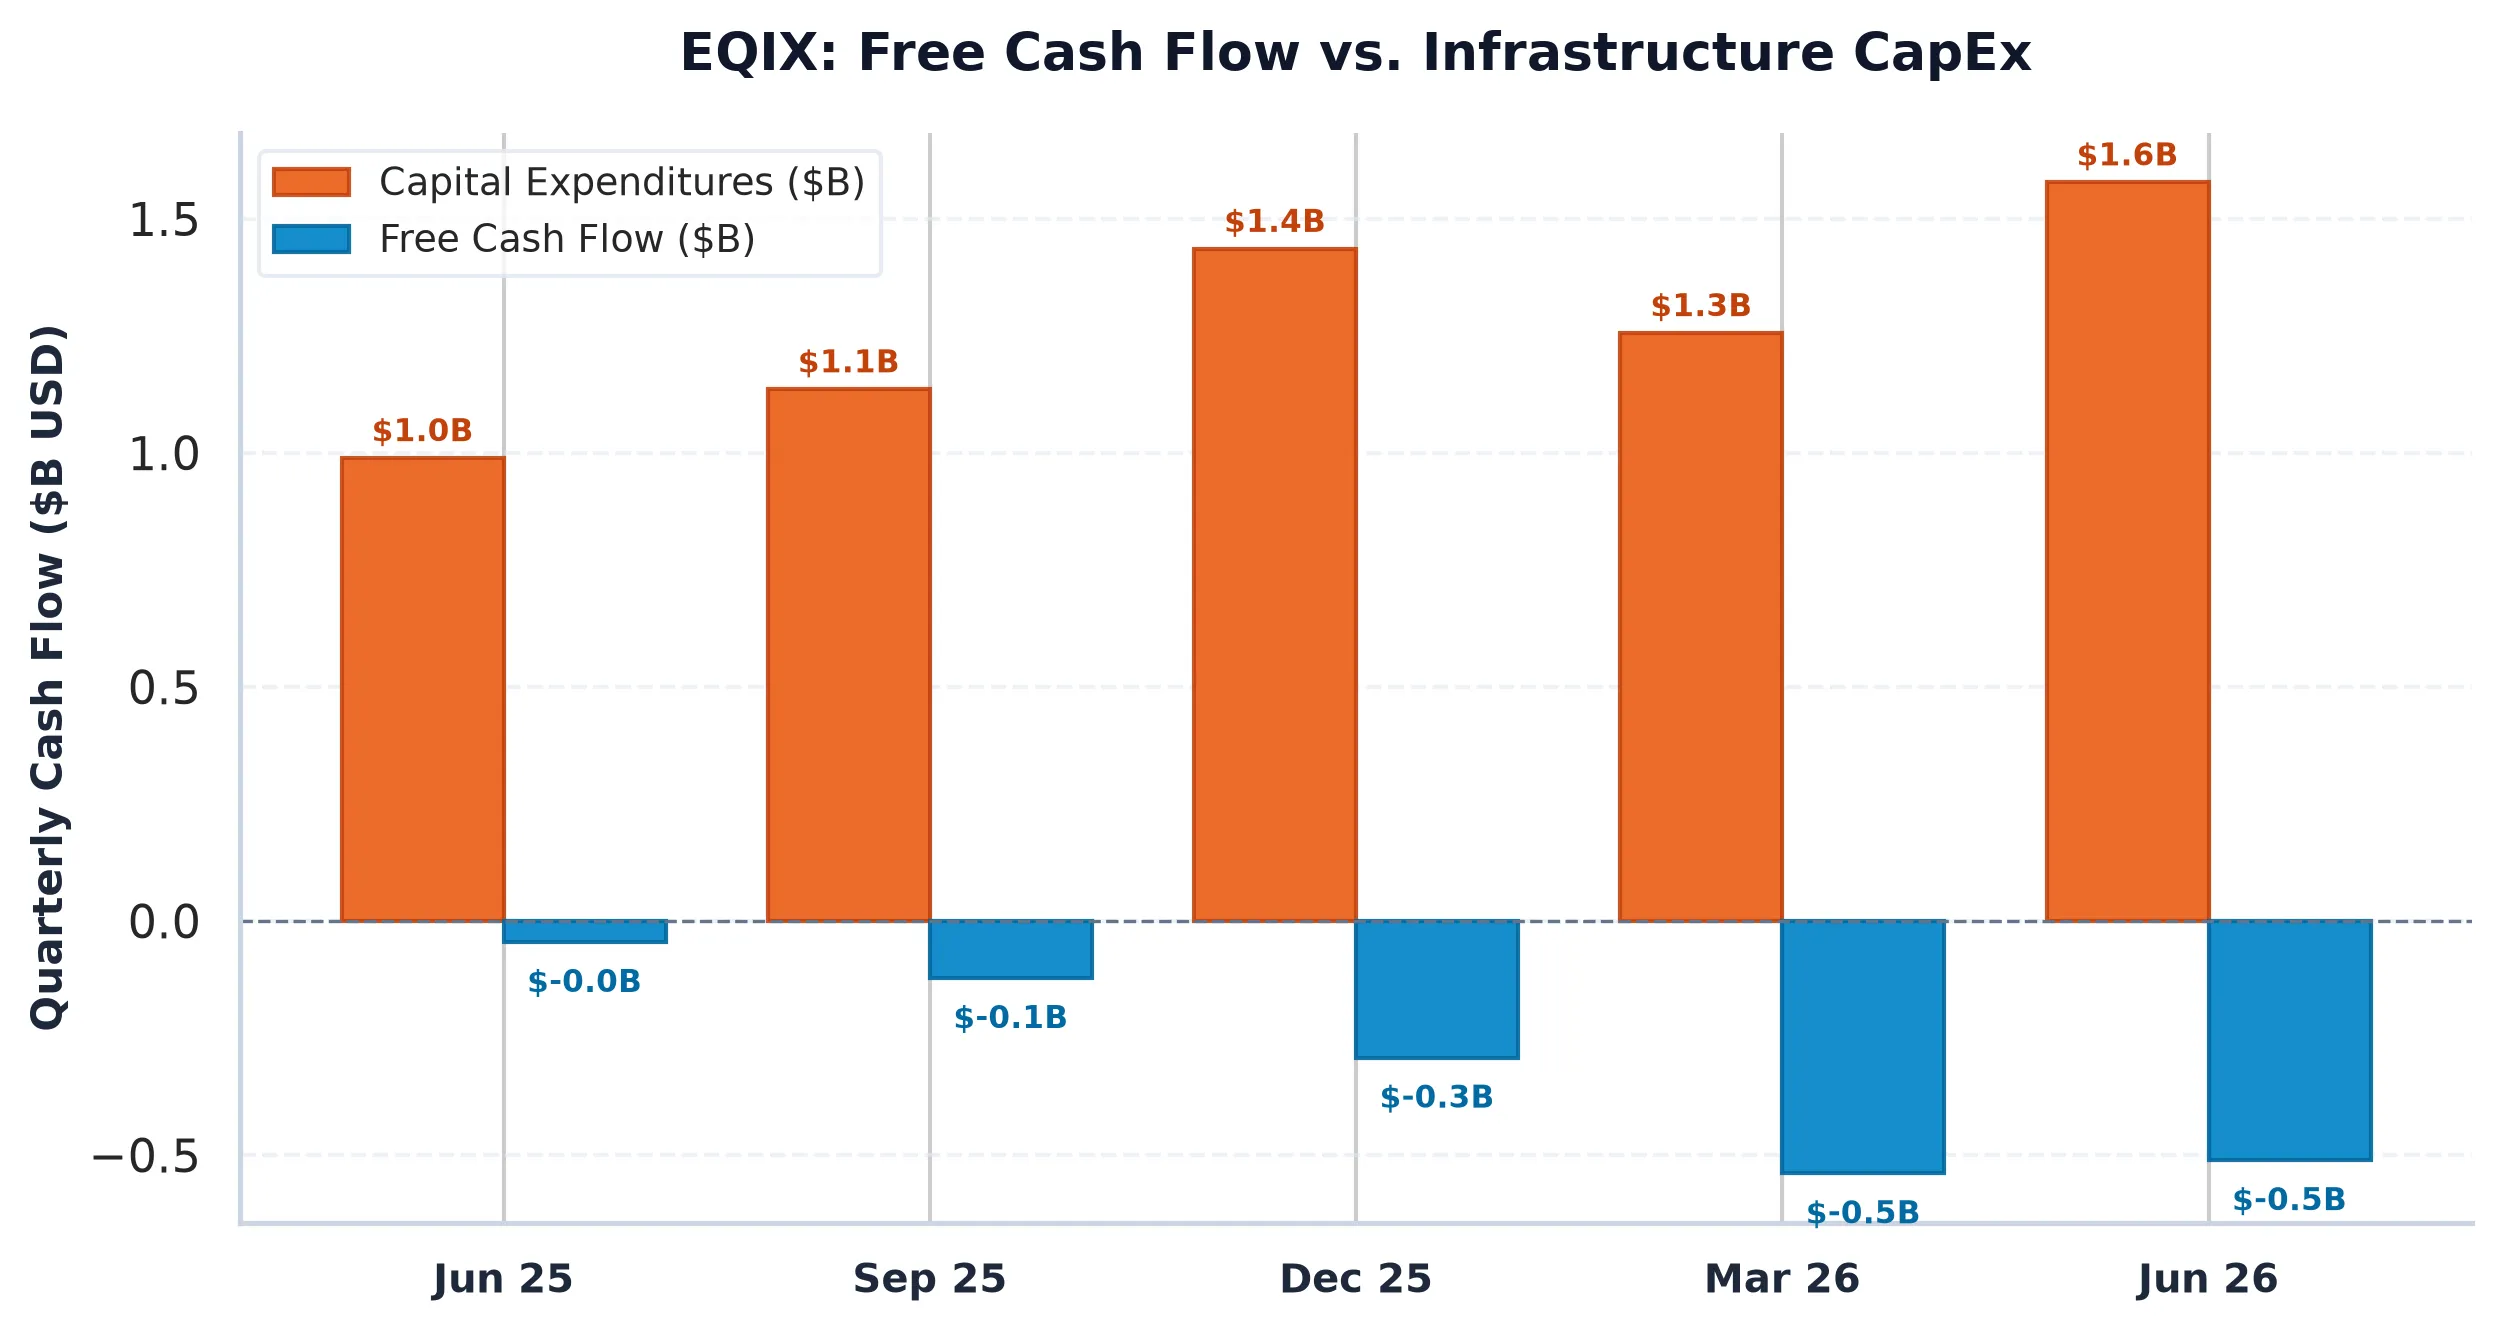
To understand the risk in Equinix, one must look past the adjusted earnings and focus on the actual cash entering and leaving the bank account. The multi-year historical fundamental trajectory reveals a disturbing trend for a $100B corporation. In FY2022, Equinix generated $685 million in free cash flow. By FY2024, that figure had dwindled to $183 million. In FY2025, the company reported a negative free cash flow of $400 million.
This is not the profile of a compounding machine: it is the profile of a business running faster and faster just to stay in the same place. While revenue grew 10.4% year-over-year, the capital intensity required to maintain that growth is cannibalizing the bottom line. The company’s Return on Invested Capital (ROIC) stands at a meager 5.20%. When compared to a Weighted Average Cost of Capital (WACC) hurdle of approximately 8.5%, it becomes clear that Equinix is currently destroying economic value with every new dollar it deploys.
Furthermore, the quality of the remaining cash flow is diluted by stock-based compensation (SBC). Equinix issued $0.50B in SBC over the last twelve months, representing nearly 12% of its operating cash flow. When you strip away this non-cash expense to see what is actually available for common shareholders, the real FCF yield drops to 2.67%. In a world where the 2-Year Treasury yields 4.75%, holding a 2.67% yielding equity with 5.13x leverage requires an almost heroic assumption of future terminal value.
The latest Form 10-Q filed on October 28, 2026, confirms that while operating margins have improved to 25%, the interest expense on $26.4B of total debt is a growing headwind. The debt maturity ladder will eventually force Equinix to refinance legacy low-coupon notes into a 5% plus environment, further compressing the margins that the bulls are currently celebrating.
Peer Relative Valuation and the Competitive Moat
Equinix often argues that its “interconnection” moat justifies its premium valuation. By owning the hubs where different networks meet, they create a “sticky” ecosystem that competitors like Digital Realty Trust (DLR) struggle to replicate. However, the peer table suggests that the market may be overestimating the value of that moat relative to the price being paid.
| Company (Ticker) | Market Cap | Forward P/E | EV/EBITDA | Rev Growth (YoY) | Operating Margin | FCF Yield |
|---|---|---|---|---|---|---|
| Equinix (EQIX) | $100.3B | 49.7x | 26.5x | 10.40% | 25.02% | 3.17% |
| Digital Realty Trust (DLR) | $68.2B | 59.5x | 27.1x | 20.7% | 17.2% | 5.76% |
| Iron Mountain (IRM) | $34.7B | 42.7x | 21.5x | 18.5% | 19.1% | -1.26% |
| American Tower (AMT) | $87.1B | 26.8x | 19.3x | 2.5% | 45.6% | 3.46% |
Digital Realty Trust (DLR) is growing revenue at twice the rate of Equinix (20.7% vs 10.4%) and offers a significantly higher FCF yield of 5.76%. While DLR trades at a higher forward P/E, its cash flow generation is objectively superior in the current window. American Tower (AMT) offers a much higher operating margin at 45.6% and a better FCF yield of 3.46% with a far more reasonable 26.8x forward P/E.
Equinix sits in a dangerous middle ground: it lacks the explosive growth of DLR and the margin safety of AMT, yet it maintains an enterprise value of over $124B. The “Rule of 40” score of 41.7% is technically elite, but it is heavily tilted toward revenue growth and “adjusted” margins rather than actual cash return to shareholders. For a REIT, cash is the only metric that ultimately pays the mortgage and the dividend.
Options Gamma Pinning and the Path to $1000
The quantitative market structure for Equinix suggests a high degree of institutional defensiveness. The Put/Call open interest ratio is a staggering 2.72, indicating that for every call option betting on an upside breakout, there are nearly three put options hedging for a decline. This is one of the most bearish skews in the large-cap real estate sector.
The Max Pain strike is currently pinned at $1000.00, which is only 1.35% below the current spot price. In the options market, $1000 represents a psychological and structural “Put Wall” with over 3,220 contracts in open interest. If the stock price breaks below this level, dealers who are short those puts will be forced to sell the underlying stock to remain delta-neutral, potentially creating a “gamma trap” that accelerates the selloff toward the next support level at $950.
The expected 30-day move is roughly 10.24%, or $103.80 in either direction. Given the fundamental decay in free cash flow and the negative yield spread against Treasuries, the path of least resistance appears to be lower. While the sell-side maintains its “Moderate Buy” consensus, the options market is pricing in a significant risk of a breakdown.
Equinix is a great company with a difficult balance sheet and an impossible valuation. It is the landlord of the internet, but it is currently charging its tenants less than it costs to keep the lights on and pay the bank. Until the ROIC moves significantly above the WACC, or the stock price adjusts to reflect a realistic FCF yield, the risk-reward remains heavily skewed to the downside.
AllWallSt Investment Verdict: SELL
Equinix, Inc. (EQIX)
Trailing P/E
Marcus Wolfe Screen
Leverage Profile
30D Channel
Pristine cash flow conversion (2.90x) and healthy accrual ratio (-6.38%). Zero accounting anomalies detected (LOW ANOMALY RISK).
Elevated Leverage (5.13x Net Debt/EBITDA); balance sheet requires structural deleveraging.
Negative yield spread (-1.76% vs 5.10% Treasury); equity requires robust multiple expansion or growth.
Max Pain: $1000.00 (-1.35%) | P/C Ratio: 2.72 | 30D Channel: $909.90 – $1117.50. Dealer gamma bounded between $1000 Put Wall and $1140 Call Wall.
EQIX carries standard index weighting (< 0.6% SPY footprint); sell-side consensus reflects standard earnings momentum rather than index-tracking mandates.
$980.00 – $1020.00 (Options Support Pinning)
Sustained weekly close below $1000.00 (Put Wall) or gross margin compression below 52.00%.
Sources & References
- Equinix, Inc. SEC EDGAR Filings
- Equinix Investor Relations
- SEC Form 10-Q (Filed 2026-10-28)
- SEC Form 10-K (Filed 2026-02-11)
Regulatory Disclaimer: This report is for informational purposes only and does not constitute financial, investment, or legal advice. The author is a financial journalist, not a registered investment advisor. All investments involve risk, including the loss of principal. Quantitative data is derived from primary exchange feeds and SEC filings; historical performance is not indicative of future results. AllWallSt and its contributors may hold positions in the securities mentioned. Consult with a qualified professional before making any investment decisions.