
The stock market has spent the last week rediscovering that gravity is not merely a suggestion. The State Street SPDR S&P 500 ETF Trust (SPY) closed Thursday down 1.96% at $715.87, marking its fifth consecutive losing session. It is a peculiar moment for the broader index: the sort of environment where a massive tech debut can happen in one corner of the room while the rest of the furniture is being repossessed by the bond market.
While the headline indices bled, the CBOE Volatility Index (^VIX) surged 15.80% to finish at 28.44. This is the market’s way of saying it is no longer bored. When the VIX climbs toward 30, the mechanical “dip-buying” that usually supports the S&P 500 tends to vanish, replaced by the nervous rustle of institutional managers paying up for downside protection.
The Five Day Fever and the Anthropic Distraction
The primary narrative tension today was the debut of Anthropic (ANT), which entered the public markets with a staggering $1.27T valuation. It was a massive, idiosyncratic event that saw 851.8 million shares change hands. Usually, a successful trillion dollar IPO acts as a tide that lifts all boats, but today it felt more like a giant sponge soaking up all the available liquidity in the room.
While Anthropic surged 17.07%, the rest of the S&P 500 felt the weight of the US 10-Year Treasury Yield, which remains stubbornly parked at 5.05%. In a world where you can get a guaranteed 5% return from the government, paying 22.8x earnings for a basket of stocks requires a level of optimism that five days of losses tend to erode. The Equity Risk Premium (the extra return you get for taking stock market risk over bonds) is currently razor thin, leaving the index vulnerable to even minor earnings disappointments.
The scoreboard below reflects a broad-based retreat. Note the divergence between the Nasdaq 100 (QQQ), which fell 2.19%, and the more defensive Energy (XLE) and Utilities (XLU) sectors, which managed to lose less than the broader tape.
| Asset / Benchmark | Ticker | Current Price / Level | Change (%) | 52-Week Low | 52-Week High |
|---|---|---|---|---|---|
| E-Mini S&P 500 Futures (ES=F) | ES=F | $7170.50 | -0.37% | $6353.25 | $7897.50 |
| E-Mini Nasdaq 100 Futures (NQ=F) | NQ=F | $26412.00 | -0.71% | $22961.50 | $31616.50 |
| S&P 500 (SPY) | SPY | $715.87 | -1.96% | $629.28 | $781.62 |
| Nasdaq 100 (QQQ) | QQQ | $645.04 | -2.19% | $555.60 | $762.86 |
| Russell 2000 (IWM) | IWM | $264.22 | -2.18% | $228.90 | $305.18 |
| 20+ Year Treasury (TLT) | TLT | $80.35 | +0.16% | $76.43 | $90.86 |
| High Yield Corporate (HYG) | HYG | $76.53 | -0.16% | $76.39 | $81.24 |
| Gold (GLD) | GLD | $335.18 | -1.76% | $335.05 | $509.70 |
| WTI Crude Oil (CL=F) | CL=F | $82.95/bbl | +0.62% | $54.98 | $119.48 |
| US Dollar Index Bullish (UUP) | UUP | $29.63 | +0.03% | $26.40 | $29.66 |
| CBOE Volatility Index (^VIX) | ^VIX | 28.44 | +15.80% | 13.38 | 35.30 |
| 2-Yr US Treasury Yield (2YY=F) | 2YY=F | 4.75% | +0.00% | 3.38% | 4.88% |
| 10-Yr US Treasury Yield (^TNX) | ^TNX | 5.05% | -0.28% | 3.96% | 5.36% |
The Cost of Capital Gravity Well
The State Street SPDR S&P 500 ETF Trust (SPY) is not a business in the traditional sense; it is a legal vehicle that holds the five hundred largest American corporations. When we talk about its Return on Invested Capital (ROIC) or its Price to Book (P/B) ratio of 1.67x, we are really talking about the weighted average of the American economy. Right now, that economy is grappling with a Weighted Average Cost of Capital (WACC) that has reset significantly higher.
For a decade, the hurdle rate for new corporate projects was effectively zero. Today, with the 10-Year yield at 5.05%, every dollar of capital a company spends must generate a return significantly higher than that just to break even in economic terms. This is why the market is becoming more discerning. It is no longer enough to grow revenue; you must grow revenue while maintaining margins that can withstand the higher cost of debt.
The “Growth at a Reasonable Price” philosophy mentioned in recent Yahoo Finance wires is a direct response to this. Investors are moving away from speculative “moonshots” and back toward companies that can self-fund their growth. This shift is visible in the intraday movers: while Anthropic was the star, companies like NVIDIA (NVDA) saw a 3.30% decline as the market questioned whether the hyperscaler spending spree can continue at its current pace.
Top % Winners (Regular Session)
| Ticker | Company | Price | Change (%) | Volume | Market Cap |
|---|---|---|---|---|---|
| INSM | Insmed Incorporated | $144.46 | +20.58% | 14.4M | $31.69B |
| ANT | Anthropic, PBC | $97.17 | +17.07% | 851.8M | $1.27T |
| TU | Telus Corporation | $10.78 | +13.35% | 28.2M | $17.14B |
Top % Losers (Regular Session)
| Ticker | Company | Price | Change (%) | Volume | Market Cap |
|---|---|---|---|---|---|
| SNEX | StoneX Group Inc. | $39.45 | -26.71% | 5.2M | $4.76B |
| SLS | SELLAS Life Sciences | $14.86 | -17.21% | 36.2M | $3.03B |
| WSM | Williams-Sonoma | $220.66 | -15.16% | 4.4M | $25.99B |
The Peer Comparison and the Concentration Risk
To understand the SPY, you have to look at what is inside it. The index is increasingly a play on a handful of mega-cap technology companies. Microsoft (MSFT), Alphabet (GOOGL), and Oracle (ORCL) are the structural pillars that dictate whether the SPY lives or dies on any given Tuesday.
The table below highlights the valuation gap. Microsoft trades at 20.6x forward earnings with a massive 47.1% operating margin. Compare that to the broader index P/E of 22.8x. The market is essentially saying that the average stock in the S&P 500 is more expensive than Microsoft, despite Microsoft having significantly better unit economics. This suggests that the “tails” of the index (the smaller 400 companies) might be the ones most at risk of a valuation reset.
| Company (Ticker) | Market Cap | Forward P/E | EV/EBITDA | Rev Growth (YoY) | Operating Margin | FCF Yield |
|---|---|---|---|---|---|---|
| State Street SPDR S&P (SPY) | N/A | N/A | N/A | N/A | N/A | N/A |
| Microsoft (MSFT) | $3.70T | 20.6x | 18.3x | 18.8% | 47.1% | 0.08% |
| Alphabet (GOOGL) | $3.35T | 17.8x | 17.5x | 24.7% | 33.3% | -0.03% |
| Oracle (ORCL) | $344.7B | 10.0x | 13.7x | 29.6% | 34.3% | -13.30% |
As we move into tomorrow, the focus shifts to the after-hours earnings from Alibaba (BABA) and Walmart (WMT). Walmart, in particular, is a bellwether for the American consumer. If they report grocery market share gains but a slowdown in discretionary spending, it will further the “defensive” rotation we saw today in sectors like Staples (XLP).
The Gamma Floor and the Max Pain Magnet
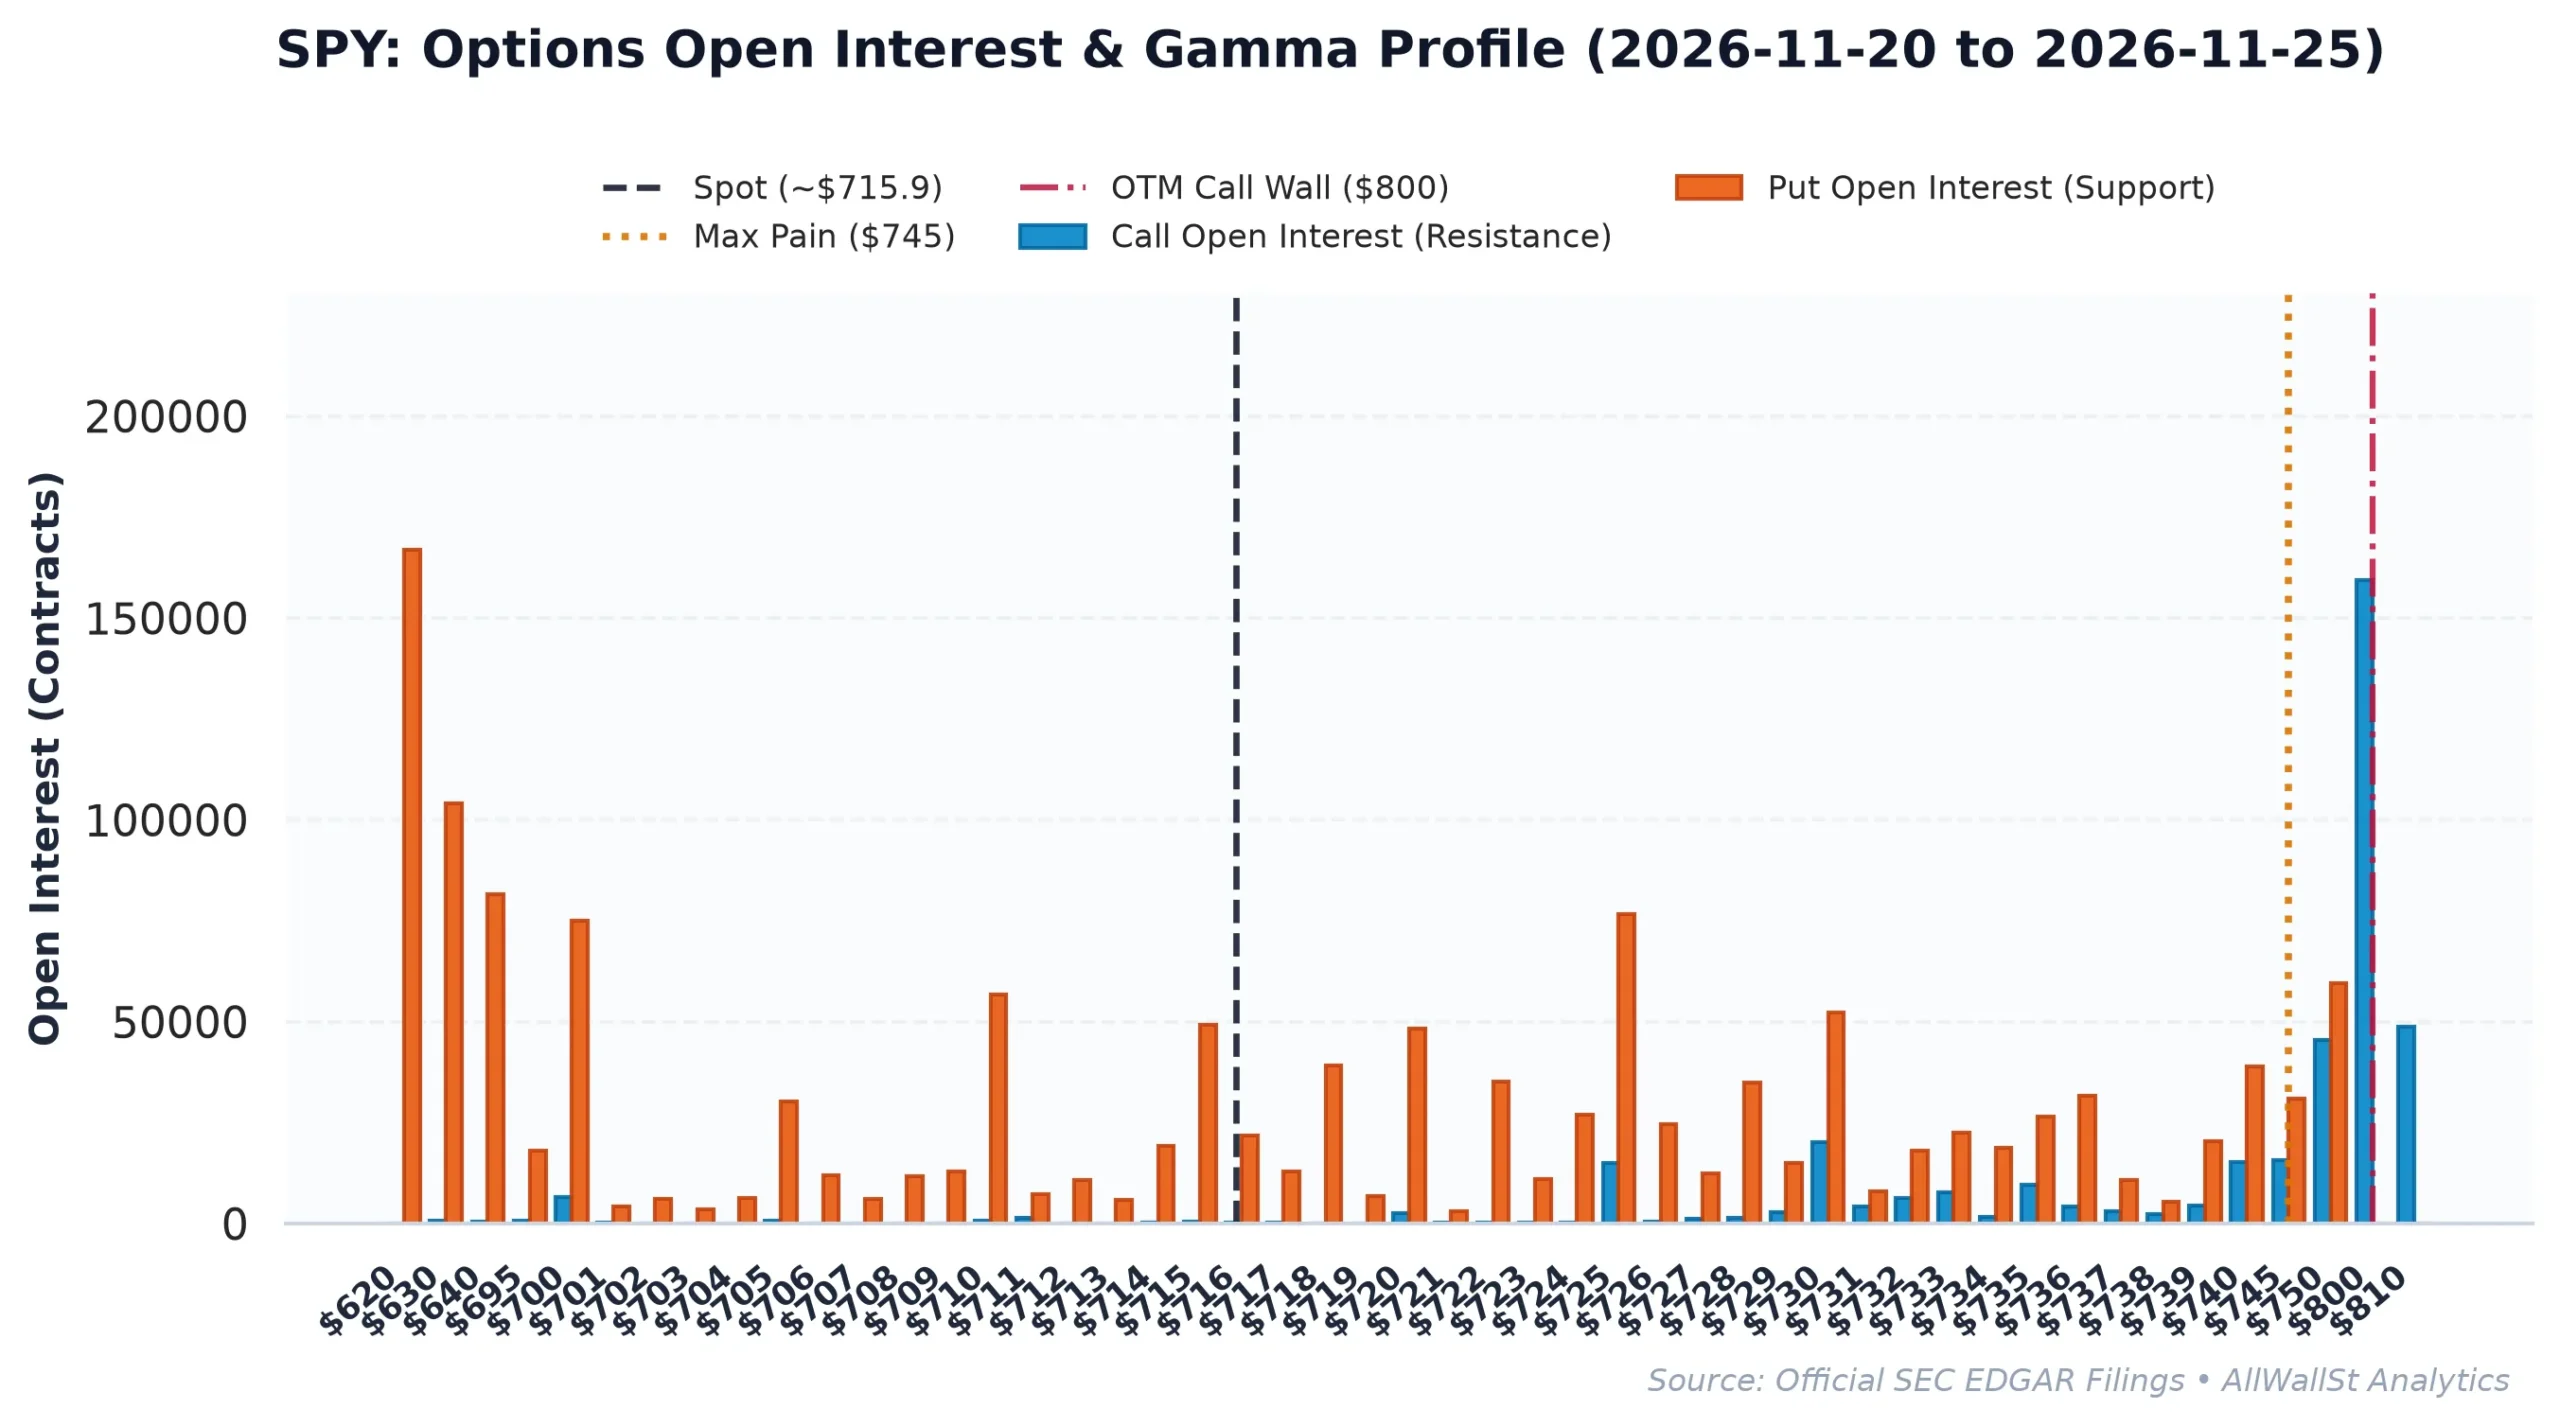
In the short term, the market is not just driven by earnings; it is driven by the plumbing of the options market. The SPY currently has a Put/Call Open Interest Ratio of 2.53. This is an exceptionally defensive reading. It means there are more than two and a half puts for every call in the system.
When the ratio is this high, dealers (the big banks who sell these options) are forced to hedge their positions by selling the underlying stock as the price falls. This creates a “short gamma” environment where volatility accelerates. However, the “Max Pain” strike (the price where the most options expire worthless) currently sits at $744.00. With the SPY at $715.87, there is a significant gap of nearly 4% to that magnetic level.
This creates a tension: the fundamental trend is down, but the options structure is stretched so far that any positive news could trigger a violent short-covering rally. Dealers who are short puts would have to buy back shares rapidly if the price starts to move toward that $744 anchor. For now, the “Put Wall” at $620 serves as the ultimate structural floor, representing the level where institutional hedging is most concentrated.
Investment Committee Steelman Dissent: The bear case rests on the 10-Year yield breaking above 5.25%, which would likely force a technical liquidation of the SPY toward the $620 Put Wall. Conversely, the bull case is a “vanna” rally where falling volatility forces dealers to buy back the shares they sold to hedge those 2.9 million puts, potentially squeezing the index back toward Max Pain.
AllWallSt Investment Verdict: HOLD
State Street SPDR S&P 500 ETF Trust (SPY)
Sources & References
- SEC EDGAR: SPDR S&P 500 ETF Trust (CIK 0000884394)
- CBOE VIX Index Data
- U.S. Treasury Yield Curve Rates
Disclaimer: This analysis is for informational purposes only and does not constitute financial, legal, or tax advice. The State Street SPDR S&P 500 ETF Trust (SPY) is subject to market risk, including the possible loss of principal. Past performance is not indicative of future results.