
There is a recurring comedy in American industrial capitalism where companies spend decades attempting to invent superior physics, only to discover that the most profitable engineering achievement is actually a well-placed line item in the Internal Revenue Code.
First Solar, Inc. (FSLR) has spent years mastering thin-film cadmium telluride technology. That proprietary chemistry allowed the Tempe, Arizona manufacturer to sidestep the Chinese crystalline silicon supply chain entirely. Yet, as the broader market celebrated a 1,500-point post-election surge in the Dow Jones Industrial Average following returns confirming Democratic control of Congress, the real story was not general macroeconomic relief. It was the sudden, total vaporization of legislative tail risk for domestic clean tech manufacturing.
While general consensus treated the 9% jump in First Solar shares as a standard partisan sentiment trade, institutional allocators were repricing something far more durable: the permanent structural entrenchment of Section 45X advanced manufacturing production tax credits under the Inflation Reduction Act.
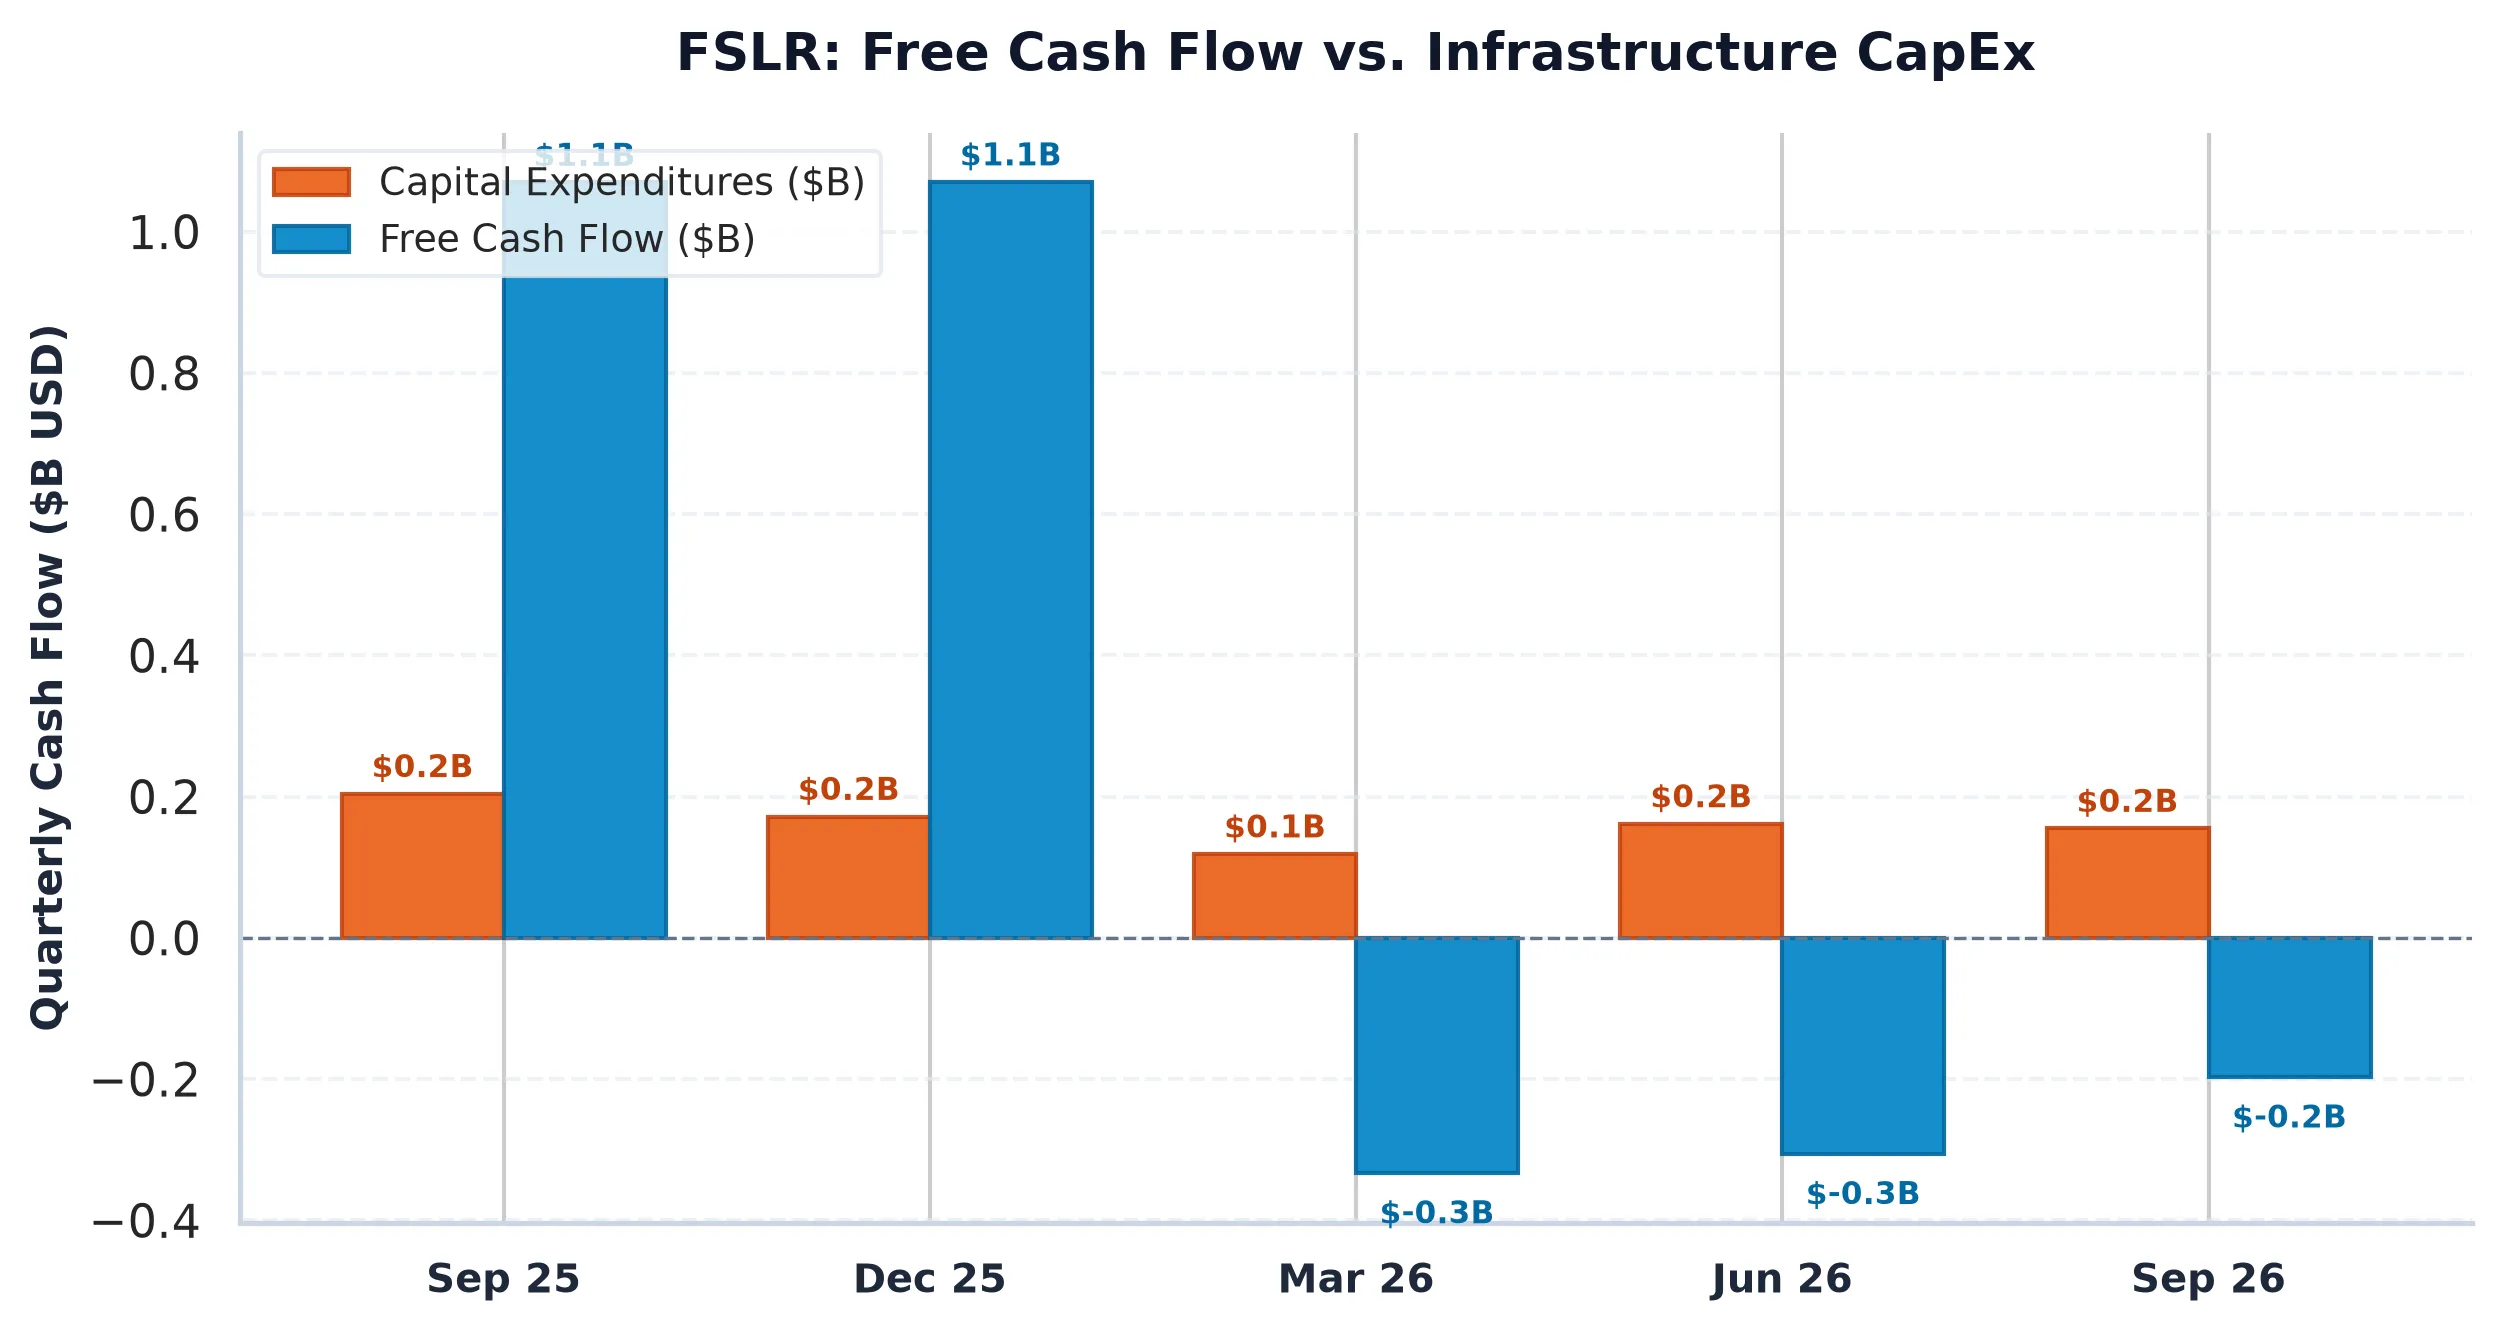
The Balance Sheet Fortress Behind the Ballot
The primary mistake made by casual market observers is viewing First Solar as a speculative renewable energy venture. In reality, the company looks far more like a defensive industrial cash machine disguised as a green energy stock.
Consider the valuation disconnect. First Solar trades at just 8.4 times forward earnings and an enterprise value to EBITDA multiple of 7.5x. Compare that to enterprise software and hyperscaler giants that trade at steep premiums despite slowing free cash generation: Microsoft commands 23.0 times forward earnings with a 0.07% free cash flow yield, while Oracle trades at 11.2 times forward earnings with negative 12.2% free cash flow yield under the weight of debt-funded data center buildouts. Even Alphabet, possessing immense search monopolization, commands 18.6 times forward earnings with a 31.8% operating margin.
First Solar, by contrast, generated a staggering 44.37% operating margin over the trailing twelve months, alongside an 18.34% return on invested capital against an estimated 8.5% cost of capital. Its balance sheet is entirely unbothered by interest rate volatility, carrying $1.62 billion in total cash against just $325 million in debt. That net cash position of $1.30 billion means the business extracts net interest income rather than bleeding cash interest to bondholders.
Official SEC disclosures track this structural transformation. In its latest Form 10-Q filed on October 29, 2026, and its 2025 Form 10-K, First Solar demonstrated how gross margins expanded to 49.25%, up from historical deficits in fiscal 2022 when operating income stood at negative $280.7 million. By fiscal 2025, operating income reached $1.60 billion. Revenue contracted 22.8% year over year purely due to lumpy delivery schedules and utility-scale contracting timing, but profitability per watt reached record highs.
Regulatory Moats and Tariff Symmetry
The consensus anxiety dogging First Solar over the past two years was the threat of legislative repeal. If an opposition Congress dismantled the Inflation Reduction Act, analysts reasoned, the company would lose the lucrative domestic production tax credits that pad its unit economics.
That threat has effectively dropped to zero. With Democratic control of Congress secured, Section 45X tax credits are locked into place for the remainder of the decade. Crucially, First Solar operates in the rare sweet spot of bipartisan industrial policy. Even under alternative trade regimes, aggressive tariffs on Southeast Asian silicon imports merely widen First Solar’s pricing umbrella. Domestic content requirements force utility developers to pay healthy average selling price premiums for American-made cadmium telluride modules.
The company is not merely competing on module efficiency; it is selling regulatory compliance and supply-chain insulation to utility operators desperate to qualify for federal investment tax credit adders.
Derivatives Plumbing and the 200 Resistance Pin
In the options market, positioning indicates immediate upside tension clashing with structural dealer inventory. The put/call open interest ratio sits at a low 0.59, reflecting an aggressively bullish institutional options skew.
Total call open interest stands at 58,237 contracts versus 34,383 puts. However, near-term upward momentum faces a formidable technical ceiling: the $200 Call Wall, which holds 13,036 open contracts, followed by secondary resistance at the $195 strike. With implied volatility at 54.68% and the 30-day expected move calculated at plus or minus $30.50 (15.68%), dealer gamma hedging will likely suppress runaway spot price expansion above $200 through immediate weekly expirations.
The Max Pain strike rests down at $182.50, roughly 6.2% below spot. While market makers will attempt to pull the shares toward that pin into contract settlement, robust Put Wall support at $165 and $162.50 limits catastrophic downside. Any post-election options volatility crush will force dealers to buy back underlying stock to balance negative vanna exposures, providing an algorithmic bid beneath $190.
The Capital Allocation Takeaway
Wall Street often prices political events through vague sentiment rather than audited financial plumbing. In the case of First Solar, the market has handed investors a rare mispricing: a debt-free market leader possessing a 44% operating margin, an 18% ROIC, and fully de-risked statutory subsidies, priced at single-digit forward earnings.
As utility power demand accelerates to meet artificial intelligence data center interconnects, domestic solar procurement is no longer an environmental luxury; it is a critical infrastructure priority. First Solar remains the premier domestic tollbooth on that buildout.
First Solar, Inc. (FSLR)
Trailing P/E
Marcus Wolfe Screen
Leverage Profile
30D Channel
Pristine cash flow conversion (1.35x) and healthy accrual ratio (-3.97%). Zero accounting anomalies detected (LOW ANOMALY RISK).
Fortress Balance Sheet (Net Cash Position; zero net refinancing distress).
Negative yield spread (-1.60% vs 5.10% Treasury); equity requires robust multiple expansion or growth.
Max Pain: $182.50 (-6.17%) | P/C Ratio: 0.59 | 30D Channel: $164.01 – $225.01. Dealer gamma bounded between $165 Put Wall and $200 Call Wall.
FSLR operates with negligible index gravitational pull. Sell-side ratings reflect pure idiosyncratic fundamental consensus without passive indexing distortion.
$161.70 – $168.30 (Options Support Pinning)
Sustained weekly close below $165.00 (Put Wall) or gross margin compression below 49.25%.
Sources & References
- Official SEC Form 10-K Annual Report (Filed 2026-02-24)
- Official SEC Form 10-Q Quarterly Report (Filed 2026-10-29)
- SEC EDGAR Official Filings: First Solar, Inc. (CIK: 0001274494), Form 10-Q and Form 10-K disclosures: https://www.sec.gov/edgar/browse/?CIK=0001274494
- First Solar, Inc. Investor Relations: https://www.firstsolar.com
- Internal Revenue Service: Section 45X Advanced Manufacturing Production Credit Regulatory Guidelines.
Regulatory Disclaimer: This analysis is provided strictly for informational and educational purposes only and does not constitute personalized investment advice, financial guidance, or an offer to purchase securities. AllWallSt and its contributors maintain independent analytical positions based on primary regulatory filings. Always conduct independent due diligence and consult a licensed fiduciary before committing investment capital.