
The thing about the American housing market right now is that it is essentially a game of musical chairs where the music stopped three years ago and everyone decided to just bolt their chairs to the floor. With mortgage rates hovering in a range that makes 2021 look like a clerical error, homeowners have collectively realized that moving is a luxury they can no longer afford. This has turned The Home Depot, Inc. (HD) into something much more interesting than a retail store: it is now the primary maintenance department for a nation of people who are staying put.
If you look at the recent price action, The Home Depot, Inc. (HD) closed up 3.60 percent on October 29, a move that seems to defy the gravity of a 4.93 percent 10-Year Treasury yield. On paper, a company yielding 3.28 percent in free cash flow should not be outperforming when Uncle Sam is paying nearly 5 percent for the privilege of doing nothing. Yet, the market is pricing in a specific kind of resilience. The bull case, as discussed in recent filings and market chatter, rests on the idea that even if you aren’t building a new deck, your existing roof will eventually leak. Maintenance is non-discretionary, and Home Depot has spent the last decade turning that necessity into a high-margin compounding machine.
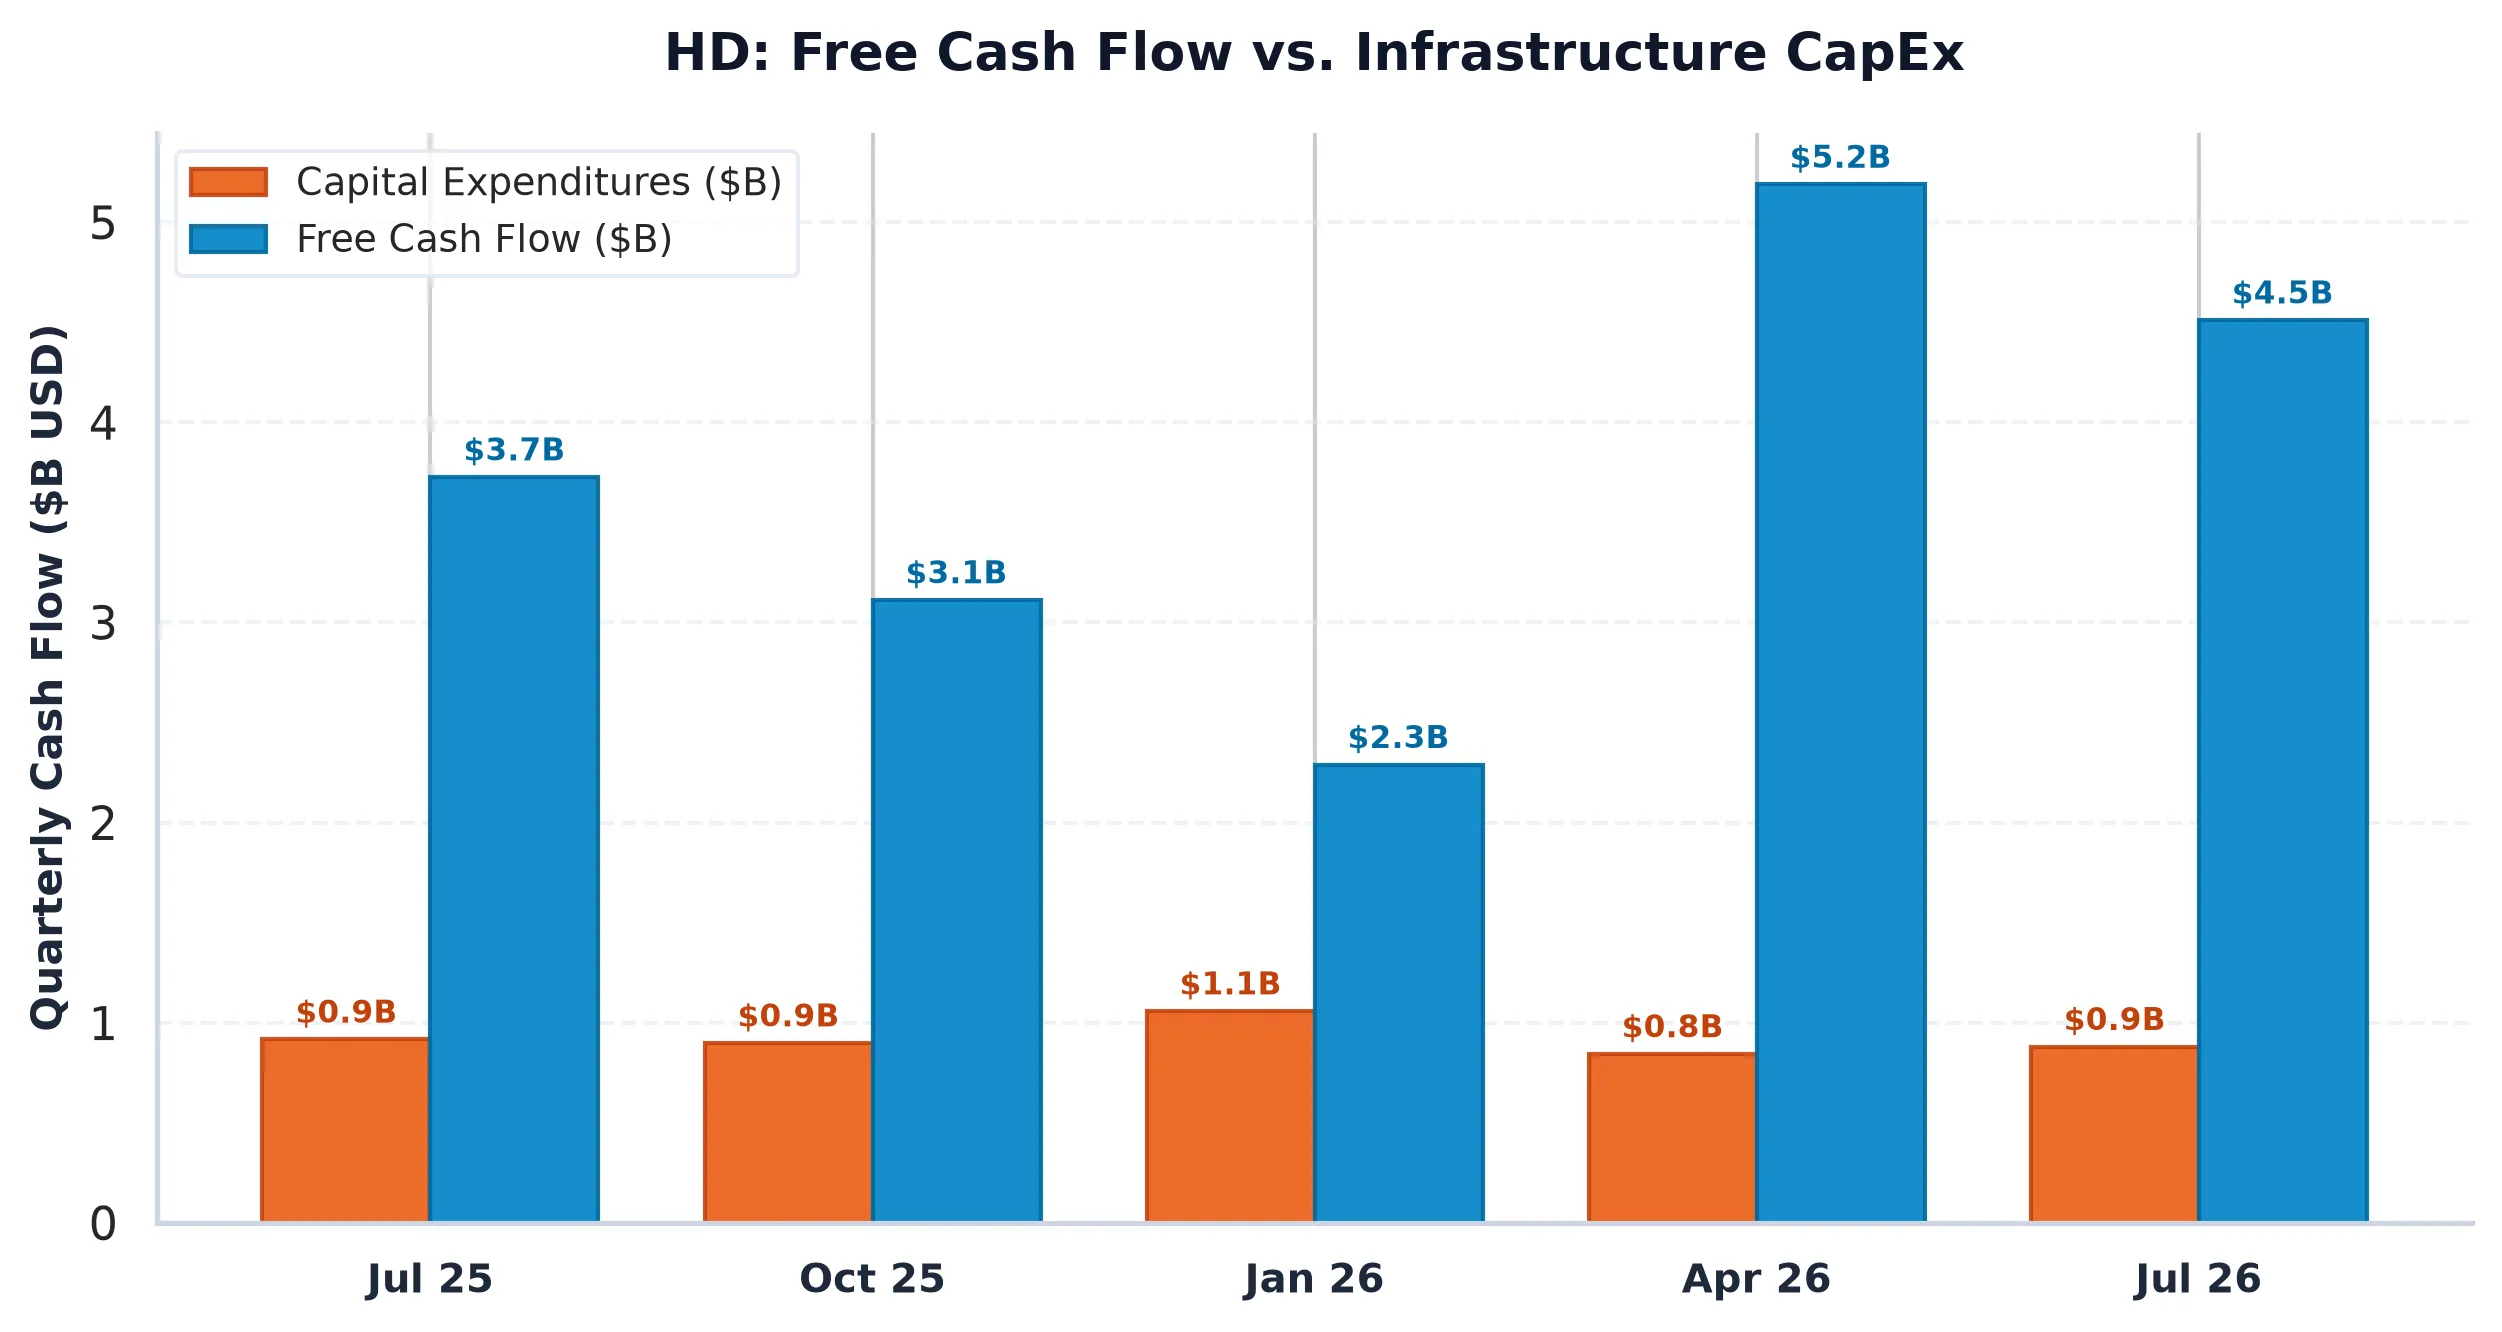
The Capital Allocation Engine and the ROIC Spread
To understand The Home Depot, Inc. (HD), you have to look past the orange aprons and into the plumbing of the balance sheet. The company currently boasts a Return on Invested Capital (ROIC) of 22.11 percent. In the world of retail, that is an elite number. For context, the weighted average cost of capital (WACC) for a firm with HD’s credit profile is roughly 8.5 percent. This means that for every dollar the company reinvests into its business, it is generating nearly 14 cents of pure economic value above its cost of carry.
However, the forensic reality is a bit more nuanced when we look at the multi-year trajectory. Between FY2023 and FY2026, revenue grew from $157.40 billion to $164.68 billion, but operating margins have been on a slow, persistent slide, dropping from 15.3 percent to 12.7 percent. This compression is the sound of inflation and labor costs eating into the efficiency gains of the pandemic era.
Then there is the matter of Stock-Based Compensation (SBC). The Home Depot, Inc. (HD) issued $0.52 billion in SBC recently, which represents about 2.8 percent of its operating cash flow. While this is modest compared to the tech sector, where SBC often functions as a secondary currency, it still dilutes the “real” free cash flow. When you strip out the stock grants, the Real FCF Yield drops to 3.12 percent. In a world where the 10-Year Treasury yield sits at 4.93 percent, the equity risk premium for HD is technically negative. You are paying a premium for the certainty of the “repair and remodel” cycle, betting that the company’s ability to compound capital at 22 percent will eventually outrun the headwind of high interest rates.
The leverage profile also warrants a look. With $61.10 billion in net debt and a Net Debt / EBITDA ratio of 2.48x, Home Depot is not exactly “light” on the balance sheet. They have used debt to fund a massive share repurchase program over the last decade, essentially swapping equity for lower-cost (at the time) debt. Now that the cost of debt is rising, the mathematics of that trade are getting harder. The company is currently prioritizing its 2.83 percent dividend yield over aggressive buybacks, which is a prudent pivot in a 5 percent rate environment.
Peer Realities and the Premium Moat
When you compare The Home Depot, Inc. (HD) to its peers, you see why it commands a 20.6x forward P/E multiple. It sits in a strange middle ground: it is more expensive than its direct rival Lowe’s, but significantly cheaper than a “pure” compounder like Sherwin-Williams or a diversified behemoth like Walmart.
| Company (Ticker) | Market Cap | Forward P/E | EV/EBITDA | Rev Growth (YoY) | Operating Margin | FCF Yield |
|---|---|---|---|---|---|---|
| The Home Depot (HD) | $328.4B | 20.6x | 15.8x | 5.70% | 12.86% | 3.28% |
| Lowe’s Companies (LOW) | $117.3B | 16.1x | 12.3x | 8.3% | 13.4% | 3.93% |
| Sherwin-Williams (SHW) | $80.4B | 25.1x | 19.8x | 7.9% | 17.6% | 3.08% |
| Walmart (WMT) | $982.9B | 38.3x | 23.8x | 5.9% | 3.5% | 0.73% |
Lowe’s Companies (LOW) currently trades at 16.1x forward earnings, a notable discount to HD despite having slightly higher year-over-year revenue growth and better operating margins (13.4 percent vs 12.86 percent). Why does the market give Home Depot the premium? The answer usually lies in the “Pro” customer segment. Home Depot has spent years building a logistics and supply chain moat specifically designed for contractors and professional builders, who tend to be stickier and spend more than the average DIY homeowner.
Sherwin-Williams (SHW) trades at 25.1x earnings because it is essentially a specialty chemical company disguised as a paint store, with margins that retail can only dream of. Walmart (WMT), meanwhile, is being priced like a tech utility at 38.3x earnings, largely due to its e-commerce and advertising growth. In this context, Home Depot looks like a reasonably priced industrial-retail hybrid. It offers better growth than Walmart at a much lower multiple, and while it is pricier than Lowe’s, its 22.1 percent ROIC suggests that its internal reinvestment is more efficient over the long term.
Options Plumbing and the $330 Ceiling
While the fundamentals tell a story of a steady compounder, the options market structure for The Home Depot, Inc. (HD) suggests a more constrained near-term path. The current Put/Call Open Interest ratio is 0.75, which indicates a slight bullish tilt, but the “Max Pain” strike sits at $310.00. This is nearly 6 percent below the current price, suggesting that as we approach monthly expiration, there is a mechanical gravitational pull toward the downside as dealers adjust their hedges.
The primary Call Wall is sitting at $330, which is exactly where the stock is currently struggling. There are over 3,000 contracts at this strike, creating a formidable ceiling. For the stock to break significantly higher, it would need a catalyst strong enough to force dealers out of their short call positions, which usually triggers a gamma squeeze. Without that, the stock is likely to remain pinned between the $310 support (the Put Wall) and the $330 resistance.
The implied volatility (IV) of 38.57 percent suggests the market is pricing in a 30-day move of approximately plus or minus $36.41. This is a wide envelope for a blue-chip retailer, reflecting the uncertainty of the broader macro environment. If the 10-Year Treasury yield continues to climb toward 5.25 percent, the “expected move” is likely to be to the downside as the FCF yield spread becomes even more unattractive.
The Investment Verdict
Despite the margin compression and the negative spread against sovereign yields, The Home Depot, Inc. (HD) remains one of the highest-quality operators in the consumer cyclical space. Its ability to generate a 22 percent ROIC in a volatile environment is a testament to its scale and its grip on the professional contractor market. While Wall Street consensus is often biased toward an “Overweight” rating to avoid index tracking error, the fundamental reality here supports a constructive view. The company is successfully navigating a period of lower transaction volumes by leaning into its pricing power and maintenance-driven demand. We view the current valuation as a fair entry point for a long-term compounder that has proven it can fix its own roof even when the weather is bad.
Investment Verdict: BUY
The Home Depot, Inc. (HD)
Trailing P/E
Marcus Wolfe Screen
Leverage Profile
30D Channel
Pristine cash flow conversion (1.15x) and healthy accrual ratio (-2.06%). Zero accounting anomalies detected (LOW ANOMALY RISK).
Moderate Leverage (2.48x Net Debt/EBITDA); manageable through operating cash generation.
Negative yield spread (-1.65% vs 5.10% Treasury); equity requires robust multiple expansion or growth.
Max Pain: $310.00 (-5.83%) | P/C Ratio: 0.75 | 30D Channel: $292.79 – $365.61. Dealer gamma bounded between $300 Put Wall and $330 Call Wall.
HD represents a core ~0.6% index pillar. Institutional managers face persistent benchmark drag if under-allocated during sector rallies, biasing sell-side consensus toward institutional overweight.
$294.00 – $306.00 (Options Support Pinning)
Sustained weekly close below $300.00 (Put Wall) or gross margin compression below 32.80%.
Sources & References
- Official SEC Form 10-K Annual Report (Filed 2026-03-18)
- Official SEC Form 10-Q Quarterly Report (Filed 2026-08-25)
- The Home Depot, Inc. Investor Relations: https://www.homedepot.com
- SEC EDGAR Filings (CIK 0000354950): https://www.sec.gov/edgar/browse/?CIK=0000354950
- SEC Form 10-K (Annual Report) Filed March 18, 2026.
- SEC Form 10-Q (Quarterly Report) Filed August 25, 2026.
Regulatory Disclaimer: This report is for informational purposes only and does not constitute financial, legal, or investment advice. The analysis is based on primary SEC filings and market data available at the time of writing. Investing in public equities involves significant risk, and past performance is not indicative of future results. AllWallSt and its contributors are not registered investment advisors. Consult with a qualified financial professional before making any investment decisions.