
The financial press has a favorite ghost story right now: the 16-year low in American home sales. The narrative is as intuitive as it is terrifying. If nobody is moving, nobody is buying a new kitchen. If the 30-year mortgage is essentially a velvet-lined prison cell for anyone with a 3% rate, then the aisles of The Home Depot, Inc. (HD) should be as quiet as a library. This is the consensus view currently being broadcast across the major wires as we head into the November 17 earnings report. It assumes that Home Depot is a simple derivative of the housing turnover rate.
But the consensus often forgets that houses, much like the people living in them, do not stop aging just because the Federal Reserve made moving expensive. There is a fundamental difference between a “housing market” (the buying and selling of deeds) and a “housing stock” (the actual physical piles of wood and copper that require maintenance). While the headlines obsess over the lack of “For Sale” signs, the real story is found in the Pro-contractor backlog and the quiet transformation of Home Depot into a massive logistics and credit engine for the people who actually do the fixing.
The Logistics Machine Disguised as a Retailer
The market is currently hyper-focused on whether Home Depot can beat its margins tomorrow. The skepticism is grounded in the recent historical trajectory. If you look at the last four years, you see a business that has successfully grown its top line from $157.40B in FY2023 to $164.68B in FY2026. However, operating margins have compressed from 15.3% down to 12.7% over that same period. In the world of simple arithmetic, rising revenue and falling margins usually signal a company that is running faster just to stay in the same place.
But the margin compression isn’t just “inflation” or “labor costs.” It is the cost of a deliberate pivot toward the “Pro” customer. In its recent SEC filings, the company noted it now operates over 1,280 SRS locations. SRS is the massive specialty distributor Home Depot acquired to win over professional roofers and landscapers. Building a logistics network that can deliver 40,000 pounds of shingles to a job site is much more expensive than letting a weekend warrior buy a single screwdriver.
This shift is reflected in the Return on Invested Capital (ROIC), which currently sits at a remarkable 21.74%. To put that in plain English: for every dollar of capital the company puts to work, it generates nearly 22 cents of profit. When your ROIC is more than double your Weighted Average Cost of Capital (WACC), which we estimate around 8.5%, you are creating massive economic value. The consensus is worried about the “frozen” homeowner, but the business is actually being re-tooled to serve the professional who is busy fixing the homes those people are staying in.
The Multi-Year Financial Trajectory
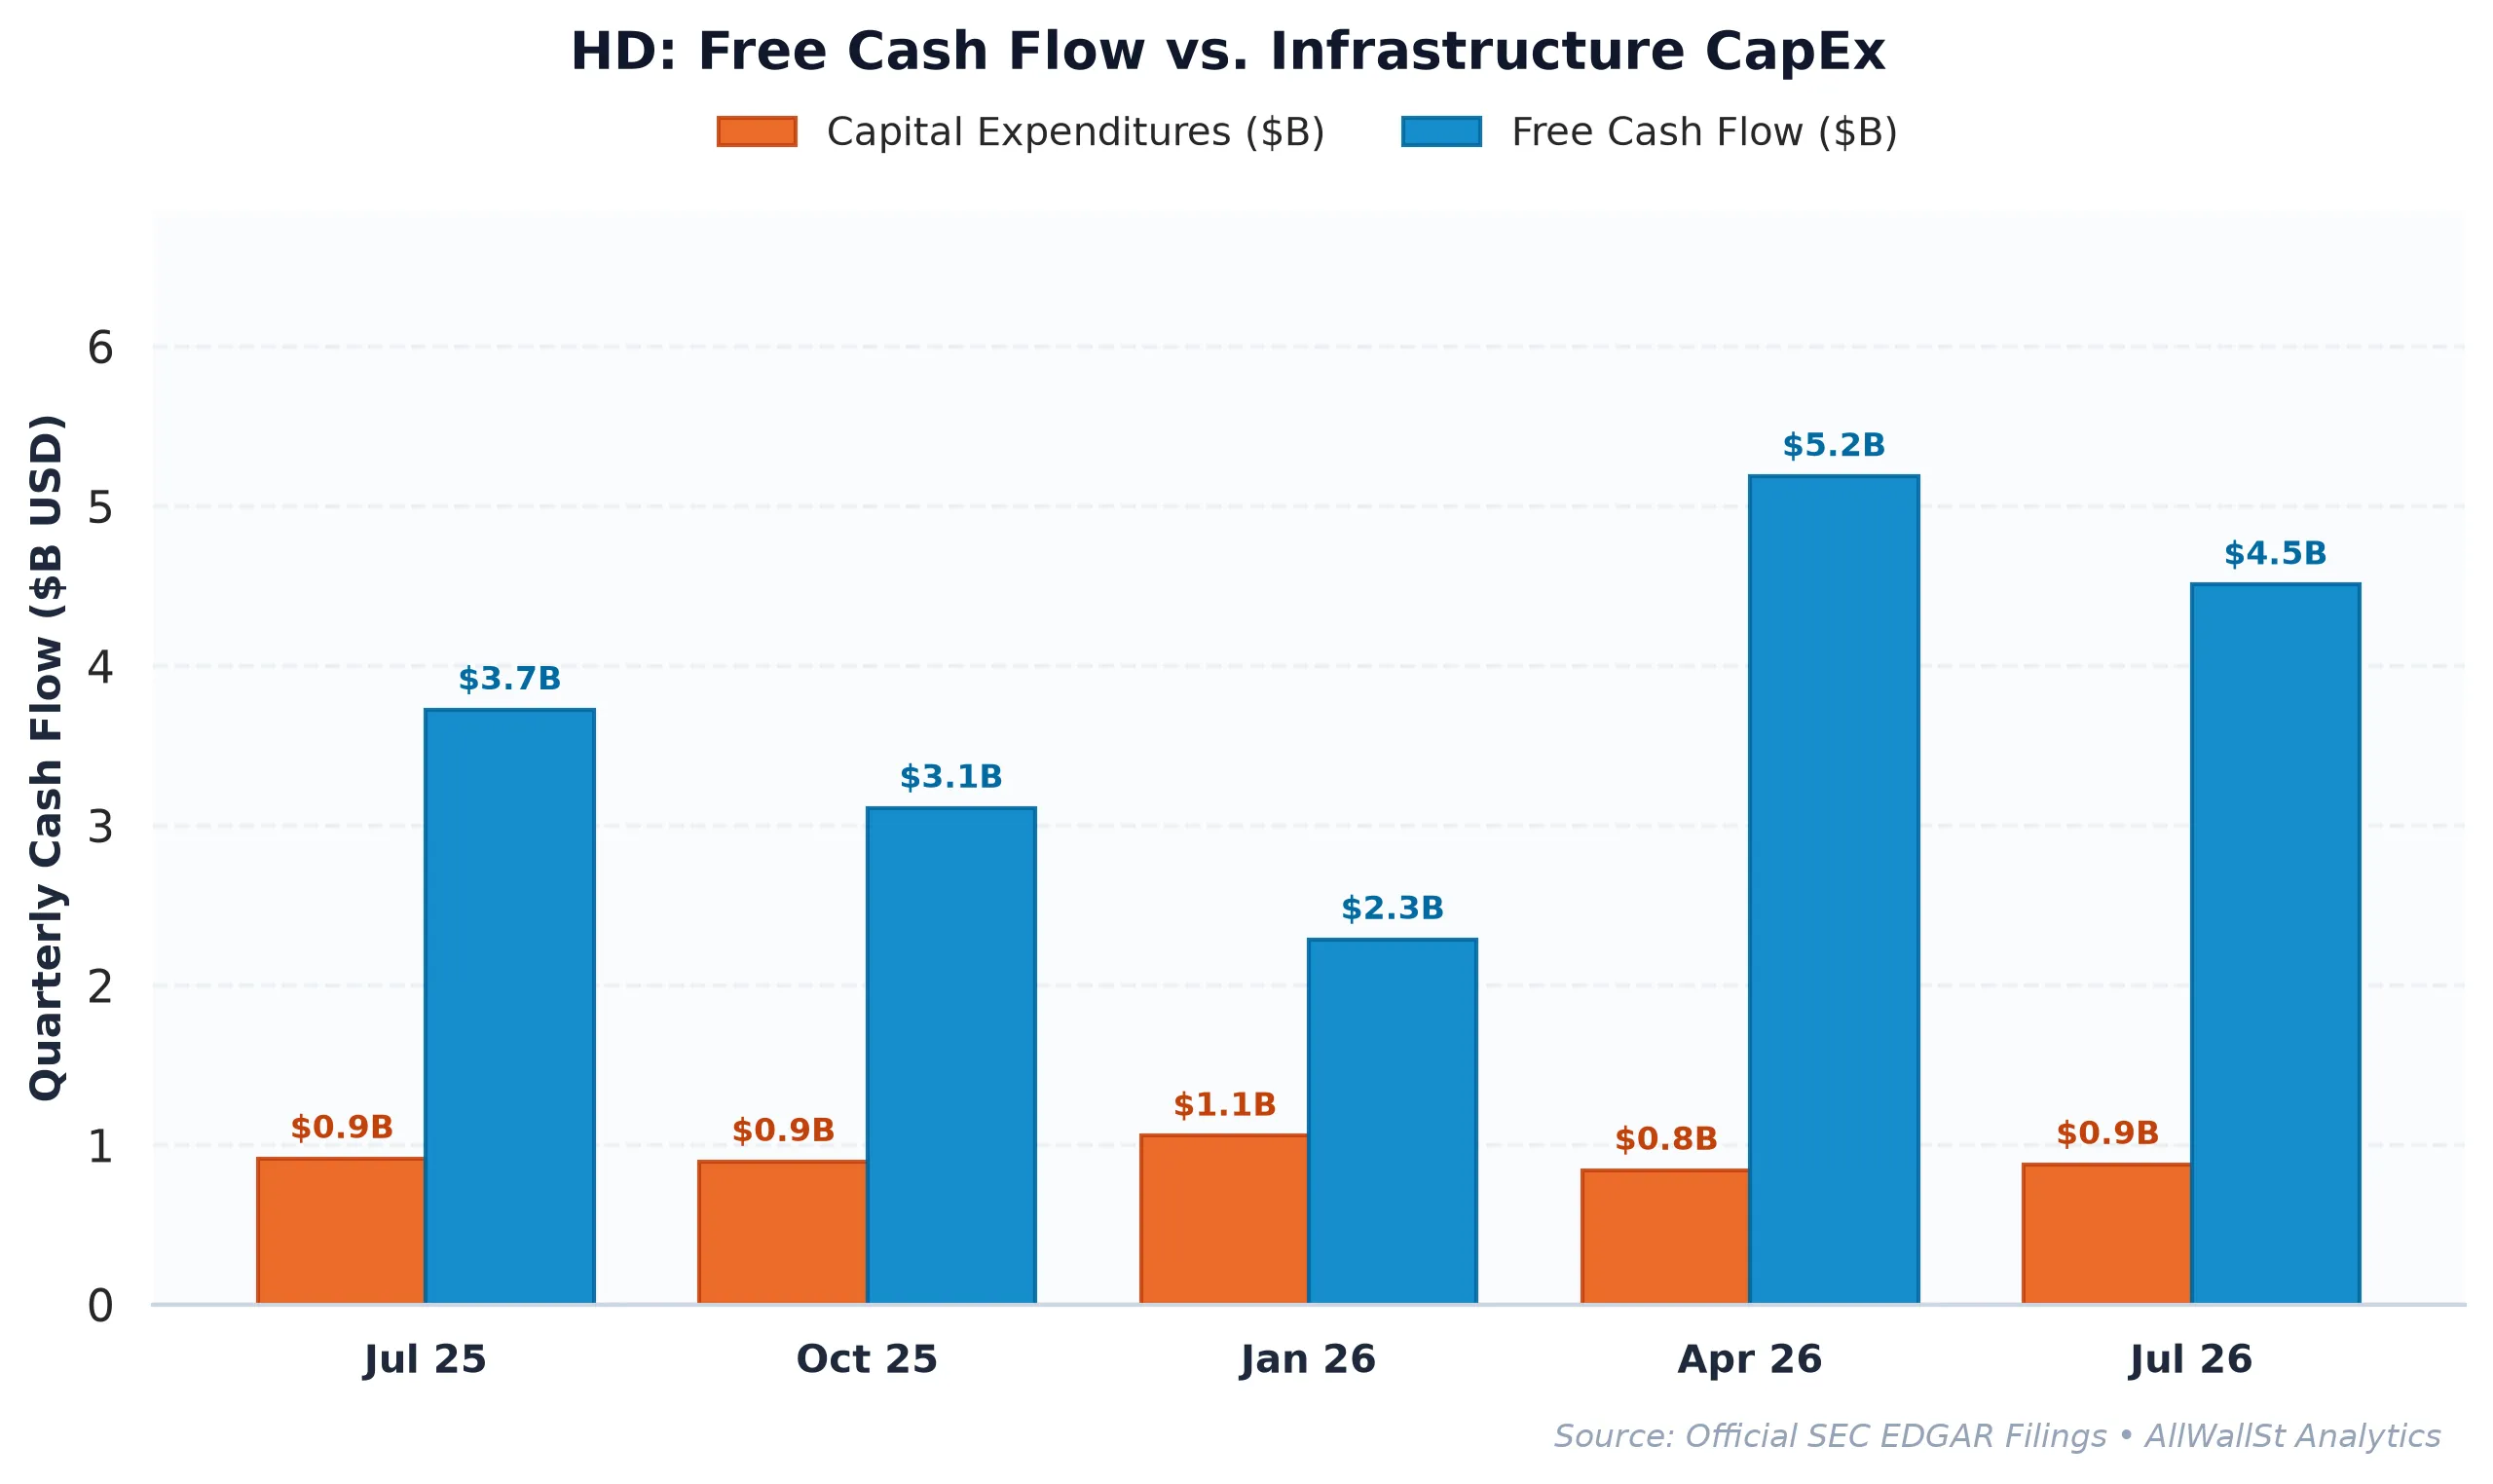
To understand why the “Buy” conviction remains high despite the macro gloom, we have to look at how the cash actually flows through the orange-tinted pipes. Home Depot is a Free Cash Flow (FCF) machine, generating $10.76B in the most recent period. Even after accounting for Stock-Based Compensation (SBC), which is the practice of paying employees in shares rather than cash, the “Real” FCF Yield stands at 2.95%.
| Period | Revenue | Operating Income | Operating Margin | Free Cash Flow | SBC Expense |
|---|---|---|---|---|---|
| FY2023 | $157.40B | $24.04B | 15.3% | $11.50B | $366.0M |
| FY2024 | $152.67B | $21.69B | 14.2% | $17.95B | $380.0M |
| FY2025 | $159.51B | $21.53B | 13.5% | $16.32B | $442.0M |
| FY2026 | $164.68B | $20.89B | 12.7% | $12.65B | $522.0M |
The table above shows a business that is remarkably stable. Even during FY2024, when revenue dipped slightly, the company managed to produce $17.95B in Free Cash Flow. This is not a business that breaks just because mortgage rates are at 7%. It is a business that adjusts. Management recently emphasized their confidence in the leadership of Ann-Marie Campbell and Richard McPhail while Ted Decker is away, suggesting that the operational playbook is well-drilled and doesn’t rely on a single visionary founder.
The Premium Price of Institutional Efficiency
When we compare Home Depot to its peers, the “Consensus Trap” becomes even more apparent. People look at Lowe’s (LOW) and see a cheaper stock. Lowe’s trades at a forward price-to-earnings (P/E) multiple of 17.5x, while Home Depot commands 21.9x. In the stock market, you usually get what you pay for. The four-turn premium for Home Depot exists because its operating margins of 12.02% consistently outpace Lowe’s at 11.4%, and its scale in the Pro segment is vastly superior.
| Company (Ticker) | Market Cap | Forward P/E | EV/EBITDA | Rev Growth (YoY) | Operating Margin | FCF Yield |
|---|---|---|---|---|---|---|
| The Home Depot (HD) | $346.7B | 21.9x | 16.6x | 5.70% | 12.02% | 3.10% |
| Lowe’s Companies (LOW) | $127.1B | 17.5x | 13.1x | 8.3% | 11.4% | 3.63% |
| Sherwin-Williams Compa (SHW) | $84.8B | 26.6x | 20.6x | 7.9% | 16.2% | 2.92% |
| Walmart (WMT) | $1.02T | 39.7x | 24.6x | 5.9% | 3.9% | 0.70% |
The comparison to Sherwin-Williams (SHW) is also instructive. Sherwin-Williams trades at a much higher 26.6x multiple because the market loves its high operating margins (16.2%) and its specialized niche. Home Depot is effectively trying to “Sherwin-Williams-ify” its business by moving deeper into specialty distribution through the SRS acquisition. While the 10-Year Treasury Yield at 5.14% makes the 3.10% FCF yield of Home Depot look thin on the surface, the growth-adjusted valuation is reasonable. The PEG ratio (Price/Earnings to Growth) of 1.84 suggests you are paying a fair price for a company that is growing its top line at nearly 6% in a “bad” housing market.
The Options Magnet and the Earnings Envelope
As we head into tomorrow’s report, the options market is doing what it always does: pricing in a minor catastrophe that rarely happens. The Implied Volatility (IV) is surging, suggesting an expected 30-day move of roughly +/- 8.8%. This means the market thinks the stock could swing by about $30 in either direction.
The “Max Pain” strike price is currently sitting at $325.00. Max Pain is the theoretical price level where the most options contracts expire worthless, acting as a magnetic anchor for the stock price as market makers hedge their positions. With the stock currently at $347.50, there is a clear pull toward the downside if the earnings report is merely “fine” rather than “spectacular.” However, the “Put Wall” at $300 provides a massive structural floor. A Put Wall is a price level where institutional investors have bought so much protection that dealers are forced to buy the stock to hedge their own risk, effectively creating a safety net.
The consensus is looking for a reason to sell the “housing slowdown.” We think they are looking at the wrong numbers. Home Depot’s balance sheet carries $61.10B in net debt, but with a Net Debt to EBITDA ratio of 2.48x, it is well within the bounds of safety for a business with such predictable cash flows. The real story isn’t the person who isn’t moving: it is the person who is staying put and finally decided that the 20-year-old roof can’t wait for another interest rate cut.
Investment Committee Steelman Dissent
The bear case rests on the “Equity Risk Premium” being effectively negative: why own a retail stock with a 3.1% cash yield when you can get 5.14% from a risk-free Treasury bond? If the SRS acquisition integration falters or if the Pro-contractor backlog finally evaporates due to a broader recession, the 21.9x multiple could quickly de-rate toward the Lowe’s level of 17x, implying a 20% downside.
AllWallSt Investment Verdict: BUY
(Initiation)
The Home Depot, Inc. (HD)
Trailing P/E
Marcus Wolfe Screen
Leverage Profile
30D Channel
Dealer Gamma Pinning & Max Pain Alignment (HD)
🎯 Max Pain: $325.00
Spot $347.50
Ceiling $370C Resistance ▲
Pristine cash flow conversion (1.15x) and healthy accrual ratio (-2.06%). Zero accounting anomalies detected (LOW ANOMALY RISK).
Moderate Leverage (2.48x Net Debt/EBITDA); manageable through operating cash generation.
Negative yield spread (-2.04% vs 5.14% Treasury); equity requires robust multiple expansion or growth.
Max Pain: $325.00 (-6.47%) | P/C Ratio: 0.92 | 30D Channel: $316.71 – $378.29. Dealer gamma bounded between $300 Put Wall and $370 Call Wall.
HD represents a core ~0.6% index pillar. Institutional managers face persistent benchmark drag if under-allocated during sector rallies, biasing sell-side consensus toward institutional overweight.
$294.00 – $306.00 (Options Support Pinning)
Sustained weekly close below $300.00 (Put Wall) or gross margin compression below 32.80%.
Bearish IC Dissent: At 24.3x trailing earnings and 3.10% FCF yield against a 5.14% 10-year risk-free hurdle, The Home Depot, Inc. (HD) leaves limited cushion for top-line deceleration or margin compression (2.48x Net Debt/EBITDA). If institutional flows break below the $300 put wall, dealer de-hedging can accelerate multiple contraction before fundamental buyers step in.
Sources & References
- Official SEC Form 10-K Annual Report (Filed 2026-03-18)
- SEC Form 8-K Primary Filing Body (2026-08-21)
- SEC Form 8-K Exhibit 99.1 (Press Release / Earnings) (2026-08-12)
- SEC DEF 14A Proxy / M&A Filing (2026-04-07)
- The Home Depot, Inc. Investor Relations
- SEC EDGAR: Home Depot, Inc. (CIK 0000354950)
- SEC Form 10-Q Filed August 25, 2026
Regulatory Disclaimer: This report is for informational purposes only and does not constitute investment advice, financial guidance, or an offer to buy or sell any securities. AllWallSt is a financial news and analysis publisher, not a registered investment advisor. Investing in equities involves substantial risk, including the potential loss of principal. All data is sourced from primary regulatory filings and market feeds; however, accuracy cannot be guaranteed. Past performance is not indicative of future results. Please consult with a qualified financial professional before making any investment decisions.