
When an activist investor like Elliott Investment Management shows up at a legacy technology firm, the script usually involves a lot of shouting about “unlocking value” and perhaps a few public letters suggesting the CEO should spend more time on golf and less time on expensive acquisitions. But at Hewlett Packard Enterprise Company (HPE), the relationship has entered a curiously polite phase.
On Wednesday, Hewlett Packard Enterprise Company (HPE) filed an 8-K disclosing a second amendment to its cooperation agreement with Elliott. In the world of corporate governance, a cooperation agreement is essentially a peace treaty: the activist agrees to stop throwing stones, and the company agrees to listen to their advice (and often grants them a board seat or two). The fact that they are extending this deal suggests that Elliott is quite happy with how the company is currently being managed, which is a rare endorsement for a hardware giant.
The timing is notable because Hewlett Packard Enterprise is currently in the middle of a fundamental identity shift. It is trying to move from being the company that sells you a server rack that sits in a dusty basement to being the company that sells you the high-performance cooling systems and AI infrastructure that keeps the modern internet from melting.
The Valuation Gap and the AI Hardware Premium
The market has a long memory, and it usually remembers Hewlett Packard Enterprise as a low-margin hardware business. However, the numbers in the most recent filings tell a different story. The company reported revenue growth of 33.70% year over year in its latest quarter, a figure that actually outpaces the 18.8% growth seen at Microsoft (MSFT) and the 29.6% growth at Oracle (ORCL).
Despite this, the valuation remains stuck in the bargain bin. Hewlett Packard Enterprise trades at a forward P/E of just 9.7x, compared to 21.0x for Microsoft and 10.3x for Oracle. For an investor, the question is whether you are buying a legacy hardware business that is having a lucky quarter, or an AI infrastructure play that the market hasn’t re-rated yet.
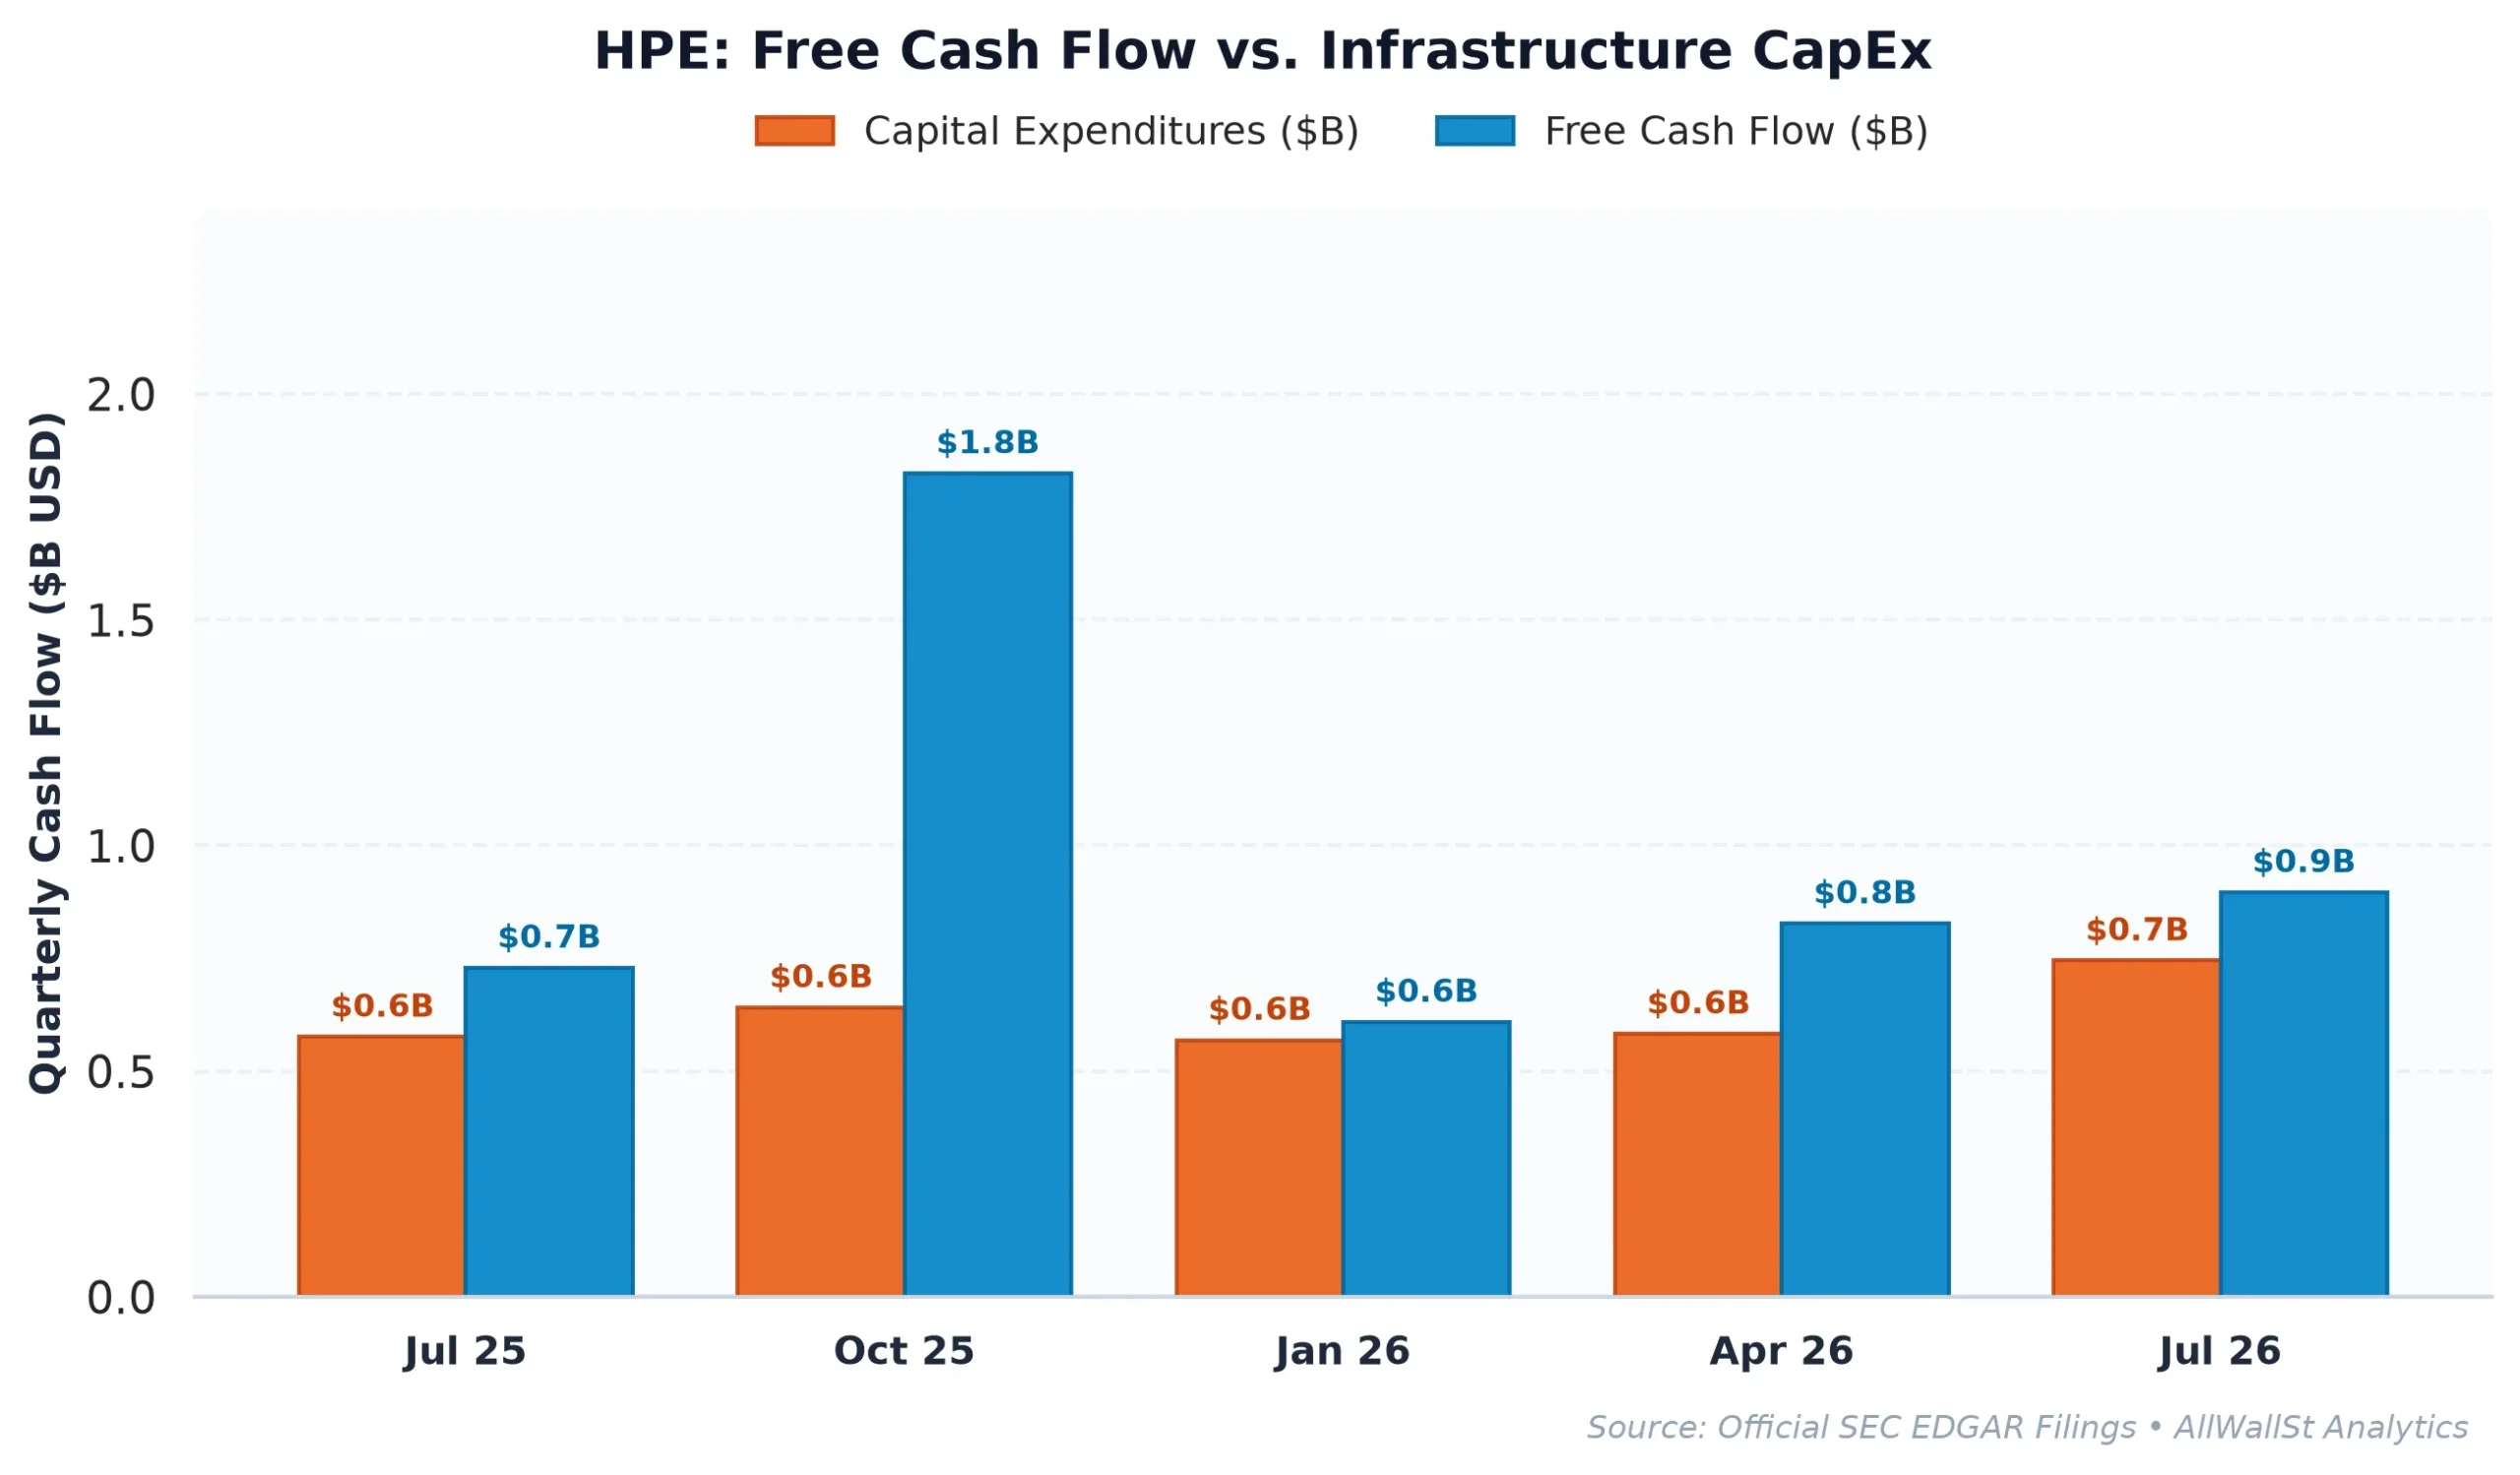
The company is currently generating a Free Cash Flow (FCF) yield of 7.80%. Even when you account for the $0.64 billion in stock-based compensation (SBC), the real FCF yield sits at a healthy 6.74%. Compare that to the US 10-Year Treasury yield of 5.07%, and you are getting a significant risk premium for owning the equity.
Operational Discipline and the Elliott Influence
The extension of the Elliott agreement, alongside the appointment of new directors under Item 5.02 of the 8-K, signals that the focus remains on capital discipline. Activists love two things: margin expansion and share buybacks. Hewlett Packard Enterprise has been delivering on at least one of those, with GAAP operating profit up massively in the third quarter of fiscal 2026.
The company has also committed to returning at least 75% of its free cash flow to shareholders. While the current buyback yield is a modest 0.33%, the high FCF yield suggests there is plenty of room for that to scale if the AI-driven demand for server hardware remains durable.
The strategic dilemma for CEO Antonio Neri is balancing this “capital return” mandate with the massive CapEx required to stay relevant in the AI cooling and liquid-cooled server space. The company’s CapEx intensity sits at 6.06%, which is high for a traditional hardware firm but necessary to build the labs that solve “AI’s power problem,” as recent company news suggests.
Market Structure and the Gamma Magnet
While the fundamentals look cheap, the options market is currently leaning into a speculative long skew. The Put/Call Open Interest ratio is 0.64, indicating that traders are heavily favoring call options. This creates a specific kind of mechanical tension: dealers who sold those calls are likely long the stock to hedge their exposure.
The “Max Pain” strike price, which is the level where the most options expire worthless, currently sits at $51.00. This is roughly 11% above the current spot price of $45.78. In a market where call volume is high, this $51.00 level can act as a magnetic pull as dealers adjust their hedges leading into expiration.
However, there is a risk of a “long liquidation” air pocket if the stock fails to move higher. If the upside momentum stalls, dealers will no longer need to hold as many shares to hedge those calls, which can lead to mechanical selling. The primary put support (the “Put Wall“) is currently at $46.00, meaning we are trading right at a structural floor.
Peer Valuation & Margin Comparison Table
| Company (Ticker) | Market Cap | Forward P/E | EV/EBITDA | Rev Growth (YoY) | Operating Margin | FCF Yield |
|---|---|---|---|---|---|---|
| Hewlett Packard Enterp (HPE) | $60.8B | 9.7x | 10.9x | 33.70% | 8.12% | 7.80% |
| Microsoft (MSFT) | $3.77T | 21.0x | 18.6x | 18.8% | 47.1% | 0.08% |
| Alphabet (GOOGL) | $3.47T | 18.6x | 18.0x | 24.7% | 33.3% | -0.03% |
| Oracle (ORCL) | $355.1B | 10.3x | 14.1x | 29.6% | 34.3% | -12.91% |
The disparity in operating margins is the primary reason for the valuation gap. While Microsoft and Oracle enjoy margins above 30%, Hewlett Packard Enterprise operates at 8.12%. This is the classic hardware-versus-software divide. But if the company can use its AI momentum to shift more of its revenue toward high-margin software and services (like its GreenLake platform), that 9.7x multiple becomes very difficult to justify.
Investment Committee Steelman Dissent
The bear case rests on the fact that Hewlett Packard Enterprise still operates with a Return on Invested Capital (ROIC) of 6.92%, which is lower than its estimated 8.5% cost of capital, suggesting the company is technically destroying economic value despite the AI hype. Furthermore, if the current hyperscaler CapEx boom enters a “digestion phase,” the low-margin hardware providers will be the first to see their order backlogs evaporate.
AllWallSt Investment Verdict: BUY
Hewlett Packard Enterprise Company (HPE)
Sources & References
- Official SEC Form 10-K Annual Report (Filed 2025-12-18)
- Official SEC Form 10-Q Quarterly Report (Filed 2026-09-03)
- SEC Form 8-K Exhibit 99.1 (Press Release / Earnings) (2026-11-18)
- SEC Form 8-K Exhibit 99.1 (Press Release / Earnings) (2026-09-02)
- SEC DEF 14A Proxy / M&A Filing (2026-02-11)
- Federal Register (2026-09-25): Certain Dynamic Random Access Memory (DRAM) Devices, Products Containing the Same, and…
- Federal Register (2026-08-17): Notice of Receipt of Complaint; Solicitation of Comments Relating to the Public Interest
- USASpending Federal Contract Award ($30.4M, Department of Defense)
- SEC EDGAR: Hewlett Packard Enterprise Co (CIK 0001645590)
- Investor Relations: HPE Investor Relations
- SEC Form 8-K (Filed 2026-11-18): Entry into Material Definitive Agreement & Board Changes
Disclaimer: This report is for informational purposes only and does not constitute financial, legal, or investment advice. The author and publisher are not responsible for any financial losses resulting from the use of this information. All investments involve risk, and past performance is not indicative of future results.