
If you spend enough time looking at corporate balance sheets, you eventually realize that some companies are not really operating businesses in the traditional sense. They are sovereign debt issuers that happen to sell medical devices and oncology drugs on the side.
Johnson & Johnson (JNJ) is the undisputed king of this genre. It has a market capitalization of $649.8 billion, a triple-A credit rating trajectory, and a stock price that currently sits at $269.91. If you ask an equity analyst why it trades at a forward earnings multiple of 23.2x while risk-free 10-Year U.S. Treasuries yield 4.93%, they will tell you about defensive growth, high returns on invested capital, and secular healthcare demand. If you ask an options trader, they will tell you that the stock is currently pinned to the floor by options market makers defending a massive $270 Call Wall.
Both perspectives are correct, but they are looking at two different parts of the same machine.
The Core Thesis & Market Dislocation
The fundamental narrative surrounding Johnson & Johnson right now is driven by its MedTech division. Recent clinical trial presentations in coronary intravascular lithotripsy, along with accelerating clinical data for the Impella heart pump platform and pulsed field ablation (PFA) updates, have reminded Wall Street that the company is not just a legacy pharmaceutical conglomerate surviving on legal settlements. It is actively expanding its high-margin cardiovascular footprint.
Yet, despite this operational momentum, the equity price appears trapped in a narrow corridor. The stock’s current Free Cash Flow (FCF) yield sits at 2.85%, creating a negative spread of 2.09% against the sovereign 10-Year Treasury benchmark. In a standard discounted cash flow model, paying a high multiple for an equity yielding less than risk-free paper looks like duration risk.
However, equity markets do not price Johnson & Johnson as a speculative growth duration asset. They price it as an inflation-protected compounding engine. Institutional portfolio managers view the company as a core 1.2% benchmark pillar in the S&P 500, creating persistent structural buying pressure that prevents the equity from de-rating even when sovereign rates spike.
Metrics calculated from primary SEC EDGAR filings and official exchange feeds show that while macro yields create a theoretical headwind, cross-sector equity capital is actively rotating into Healthcare (XLV, up 0.37%), fleeing lower-margin defensive sectors like Consumer Staples (XLP, down 1.52%). Institutional capital is paying up for true margin durability.
Multi-Year Financial Trajectory, ROIC & Cash-Flow Mechanics
To understand why institutional asset managers accept a low immediate cash flow yield on Johnson & Johnson, one must look at the structural quality of its income statement across recent fiscal periods.
Between FY2022 and FY2025, total revenue expanded from $79.99 billion to $94.19 billion, reflecting a consistent organic compound growth trajectory. Operating margins have remained exceptionally stable, moving from 26.3% in FY2022 to 27.2% in FY2025. Annual free cash flow expanded from $17.18 billion to $19.31 billion over the same window.
| Period | Revenue | Operating Income | Operating Margin | Free Cash Flow | SBC Expense |
|---|---|---|---|---|---|
| FY2022 | $79.99B | $21.01B | 26.3% | $17.18B | $1.14B |
| FY2023 | $85.16B | $22.01B | 25.8% | $17.78B | $1.16B |
| FY2024 | $88.82B | $21.25B | 23.9% | $18.06B | $1.18B |
| FY2025 | $94.19B | $25.60B | 27.2% | $19.31B | $1.35B |
A key component of this compounding efficiency is Return on Invested Capital (ROIC). Johnson & Johnson generates an ROIC of 18.54%, vastly outperforming its weighted average cost of capital (WACC) hurdle of roughly 8.5%. When a enterprise earns 18.54% on its invested capital, every dollar of retained earnings generates substantial economic value, justifying a high Price-to-Book multiple of 7.97x.
Furthermore, corporate governance and cash allocation remain disciplined. Stock-Based Compensation (SBC) stood at $1.35 billion over the trailing twelve months, representing just 5.2% of operating cash flow. Unlike high-flying tech companies that use share buybacks merely to offset massive executive dilution, Johnson & Johnson deployed $5.95 billion in annual share repurchases alongside its 1.98% dividend yield. Net of SBC, the company delivers a real FCF yield of 2.64%.
According to recent disclosures in Form 10-Q and 10-K filings, net debt sits at a modest $27.42 billion, translating to a Net Debt to EBITDA ratio of just 0.79x. Capital expenditures totaled $7.66 billion (a CapEx intensity of 7.71%), directly feeding the rapid deployment of next-generation surgical and cardiovascular devices. The operational foundation is pristine.
Peer Relative Valuation & Competitive Moat
When evaluating Johnson & Johnson relative to its mega-cap healthcare peers, the rationale for its valuation premium becomes immediately apparent.
| Company (Ticker) | Market Cap | Forward P/E | EV/EBITDA | Rev Growth (YoY) | Operating Margin | FCF Yield |
|---|---|---|---|---|---|---|
| Johnson & Johnson (JNJ) | $649.8B | 23.2x | 19.7x | 5.90% | 25.74% | 2.85% |
| Merck & Company (MRK) | $359.3B | 16.1x | 25.9x | 4.7% | 41.2% | N/A |
| AbbVie (ABBV) | $511.5B | 17.9x | 18.1x | 10.3% | 39.5% | N/A |
| Pfizer (PFE) | $176.0B | 10.7x | 8.9x | 2.6% | 27.9% | 7.09% |
Pfizer trades at a discounted forward P/E of 10.7x and offers a 7.09% FCF yield, but its top-line revenue growth has slowed to 2.6% as post-pandemic product revenues normalize. Merck and AbbVie boast higher operating margins above 39%, but both carry acute single-asset patent cliff risks over the medium term.
Johnson & Johnson commands a 23.2x forward multiple because its revenue stream is uniquely bifurcated. It combines steady pharmaceutical cash flows with high-growth medical device franchises like intravascular lithotripsy and cardiac ablation. While pure-play drugmakers face binary loss-of-exclusivity cliffs, Johnson & Johnson operates as a diversified medical tech platform with lower operational volatility. This earnings stability is precisely what risk-conscious institutional capital demands.
Options Gamma Pinning, Risk Bounds & Verdict
While long-term fundamental drivers point to steady economic compounding, near-term price action in Johnson & Johnson is heavily dictated by options market structure and market maker inventory positioning.
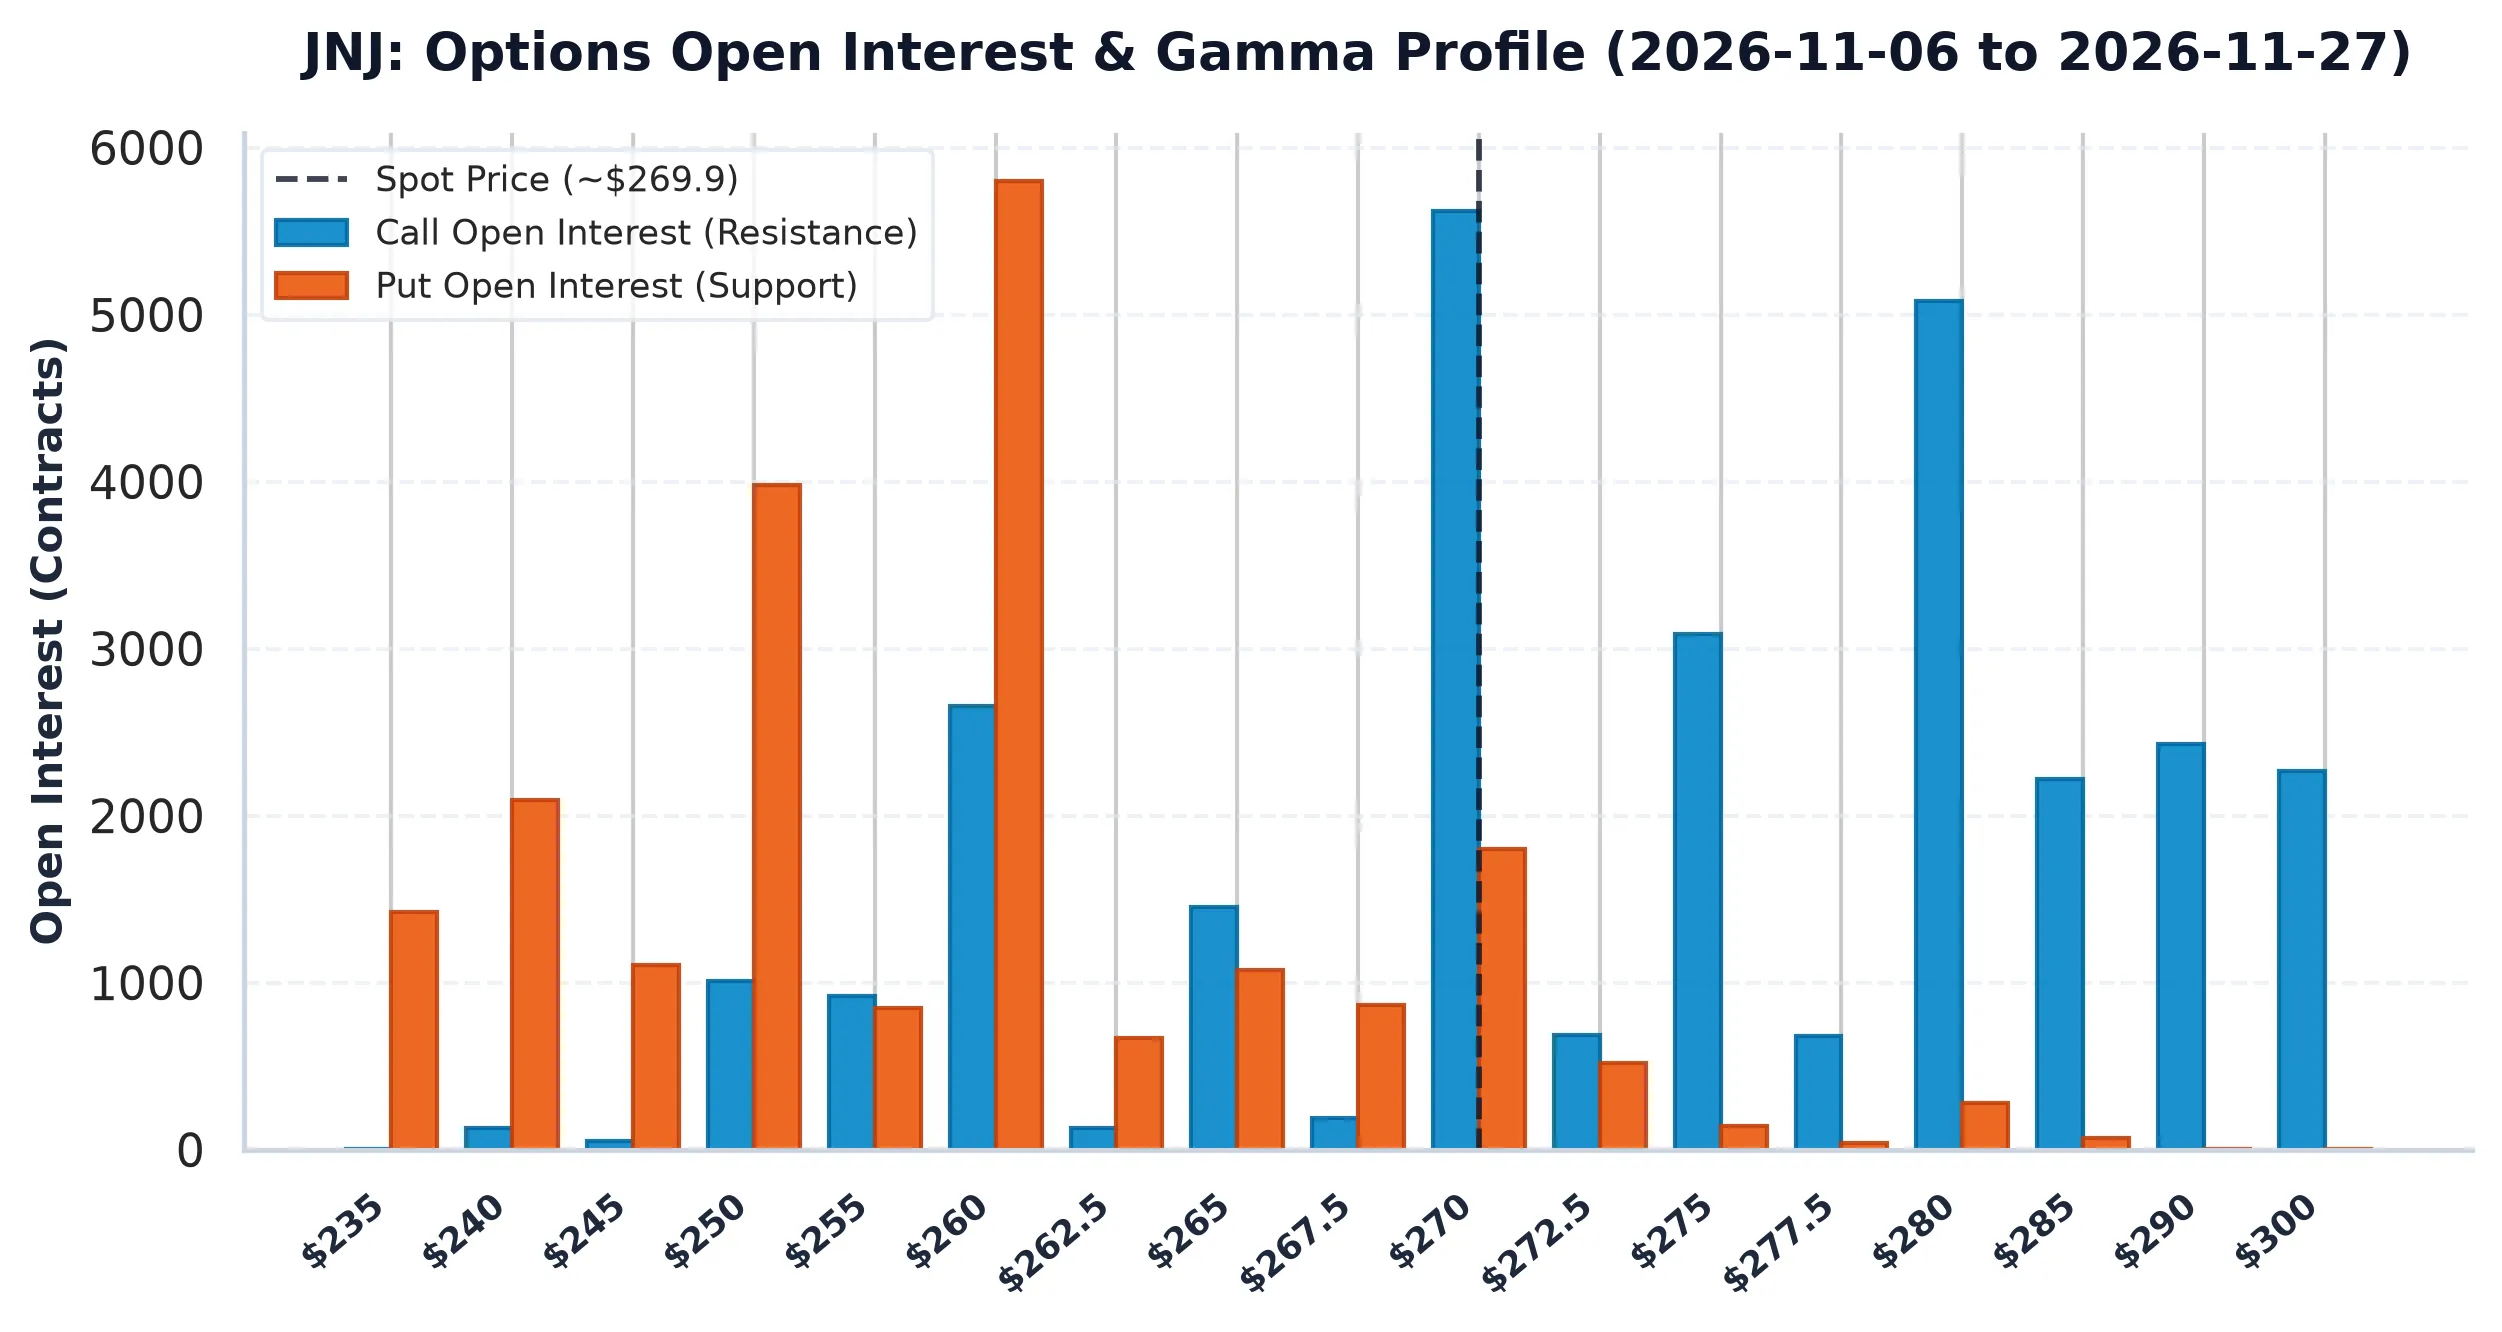
The current Put/Call Open Interest ratio stands at 0.80, reflecting a mild call skew across front-month options expirations. Total call open interest sits at 29,929 contracts against 23,966 puts. The Max Pain strike is calculated at $262.50, sitting approximately 2.75% below spot.
Options Open Interest & Strike Walls:
-----------------------------------------------------------------
Primary Call Resistance Walls:  $270 (5,474 contracts) | $280 (4,791 contracts)
Current Spot Price:            $269.91
Primary Put Support Walls:     $260 (5,614 contracts) | $250 (3,288 contracts)
-----------------------------------------------------------------
Max Pain Strike:               $262.50 (-2.75% from spot)
ATM Implied Volatility:        34.58%
30-Day Expected Move Envelope: +/- $26.75 (+/- 9.91%)
The options market has established a formidable Call Wall at the $270 strike, holding 5,474 contracts. As spot price approaches $270, options market makers who sold those calls must short underlying shares to maintain delta neutrality, effectively capping near-term upside. Conversely, a major Put Wall sits at $260 (5,614 contracts), providing strong mechanical bid support.
With an At-The-Money (ATM) Implied Volatility of 34.58%, the options market is pricing a 30-day expected move envelope of +/- $26.75 (or +/- 9.91%). This places the expected trading range between roughly $243.16 and $296.66.
Given the balanced dealer gamma inventory and the proximity to the $270 Call Wall, short-term traders might expect range-bound consolidation. However, for long-term equity investors, this technical pinning creates an attractive entry window.
Johnson & Johnson represents an elite blend of 18.54% ROIC, 25.74% operating margins, pristine balance sheet leverage (0.79x Net Debt/EBITDA), and accelerating clinical adoption across its MedTech pipeline. Wall Street consensus maintains an index-mandated Overweight rating, and our fundamental conviction agrees. The stock is a high-quality compounder capable of outperforming over a multi-year horizon.
AllWallSt Investment Verdict: BUY
Johnson & Johnson (JNJ)
Trailing P/E
Marcus Wolfe Screen
Leverage Profile
30D Channel
Pristine cash flow conversion (0.92x) and healthy accrual ratio (1.14%). Zero accounting anomalies detected (LOW ANOMALY RISK).
Prudent Leverage (0.79x Net Debt/EBITDA); well within investment-grade covenant headroom.
Negative yield spread (-2.09% vs 5.10% Treasury); equity requires robust multiple expansion or growth.
Max Pain: $262.50 (-2.75%) | P/C Ratio: 0.8 | 30D Channel: $243.17 – $296.67. Dealer gamma bounded between $260 Put Wall and $270 Call Wall.
JNJ represents a core ~1.2% index pillar. Institutional managers face persistent benchmark drag if under-allocated during sector rallies, biasing sell-side consensus toward institutional overweight.
$254.80 – $265.20 (Options Support Pinning)
Sustained weekly close below $260.00 (Put Wall) or gross margin compression below 67.77%.
Sources & References
- Official SEC Form 10-K Annual Report (Filed 2026-02-11)
-
SEC EDGAR Gateway & Filings: Johnson & Johnson SEC Filings (CIK 0000200406)
- Corporate Investor Relations: Johnson & Johnson Investor Relations
- Form 10-K Annual Report (Filed Feb 11, 2026) & Form 10-Q Quarterly Report (Filed Oct 21, 2026)
Financial Journalism & Regulatory Disclaimer: The research, analysis, and opinions expressed in this dispatch are strictly for educational and informational purposes only. Nothing contained herein constitutes financial advice, investment recommendations, or an offer to buy or sell securities. Multi-year fundamental trajectories and options market metrics represent historical data and quantitative estimates derived from primary exchange feeds and public SEC EDGAR filings. Readers should consult a licensed financial advisor before executing capital allocation decisions.