
The Core Thesis & Market Dislocation
There is an ongoing philosophical debate on Wall Street about whether McDonald’s Corporation (MCD) sells hamburgers or collects rent. The financial results recorded in its latest Form 8-K disclosure suggest the answer is overwhelmingly the latter, and business has rarely been better.
In its recent third-quarter earnings report, McDonald’s posted a clean profit beat even as customer traffic across its domestic restaurants softened. Headline market commentators immediately focused on the drop in guest counts, pointing out that inflation-weary consumers are pulling back on fast-food visits. Yet, the equity market pushed the stock higher. The apparent paradox of declining store visits alongside expanding corporate profitability is precisely where Wall Street’s sell-side consensus gets confused. Wall Street currently carries a cautious Market Weight gravity rating on the company, treating it as an index rider vulnerable to consumer belt-tightening.
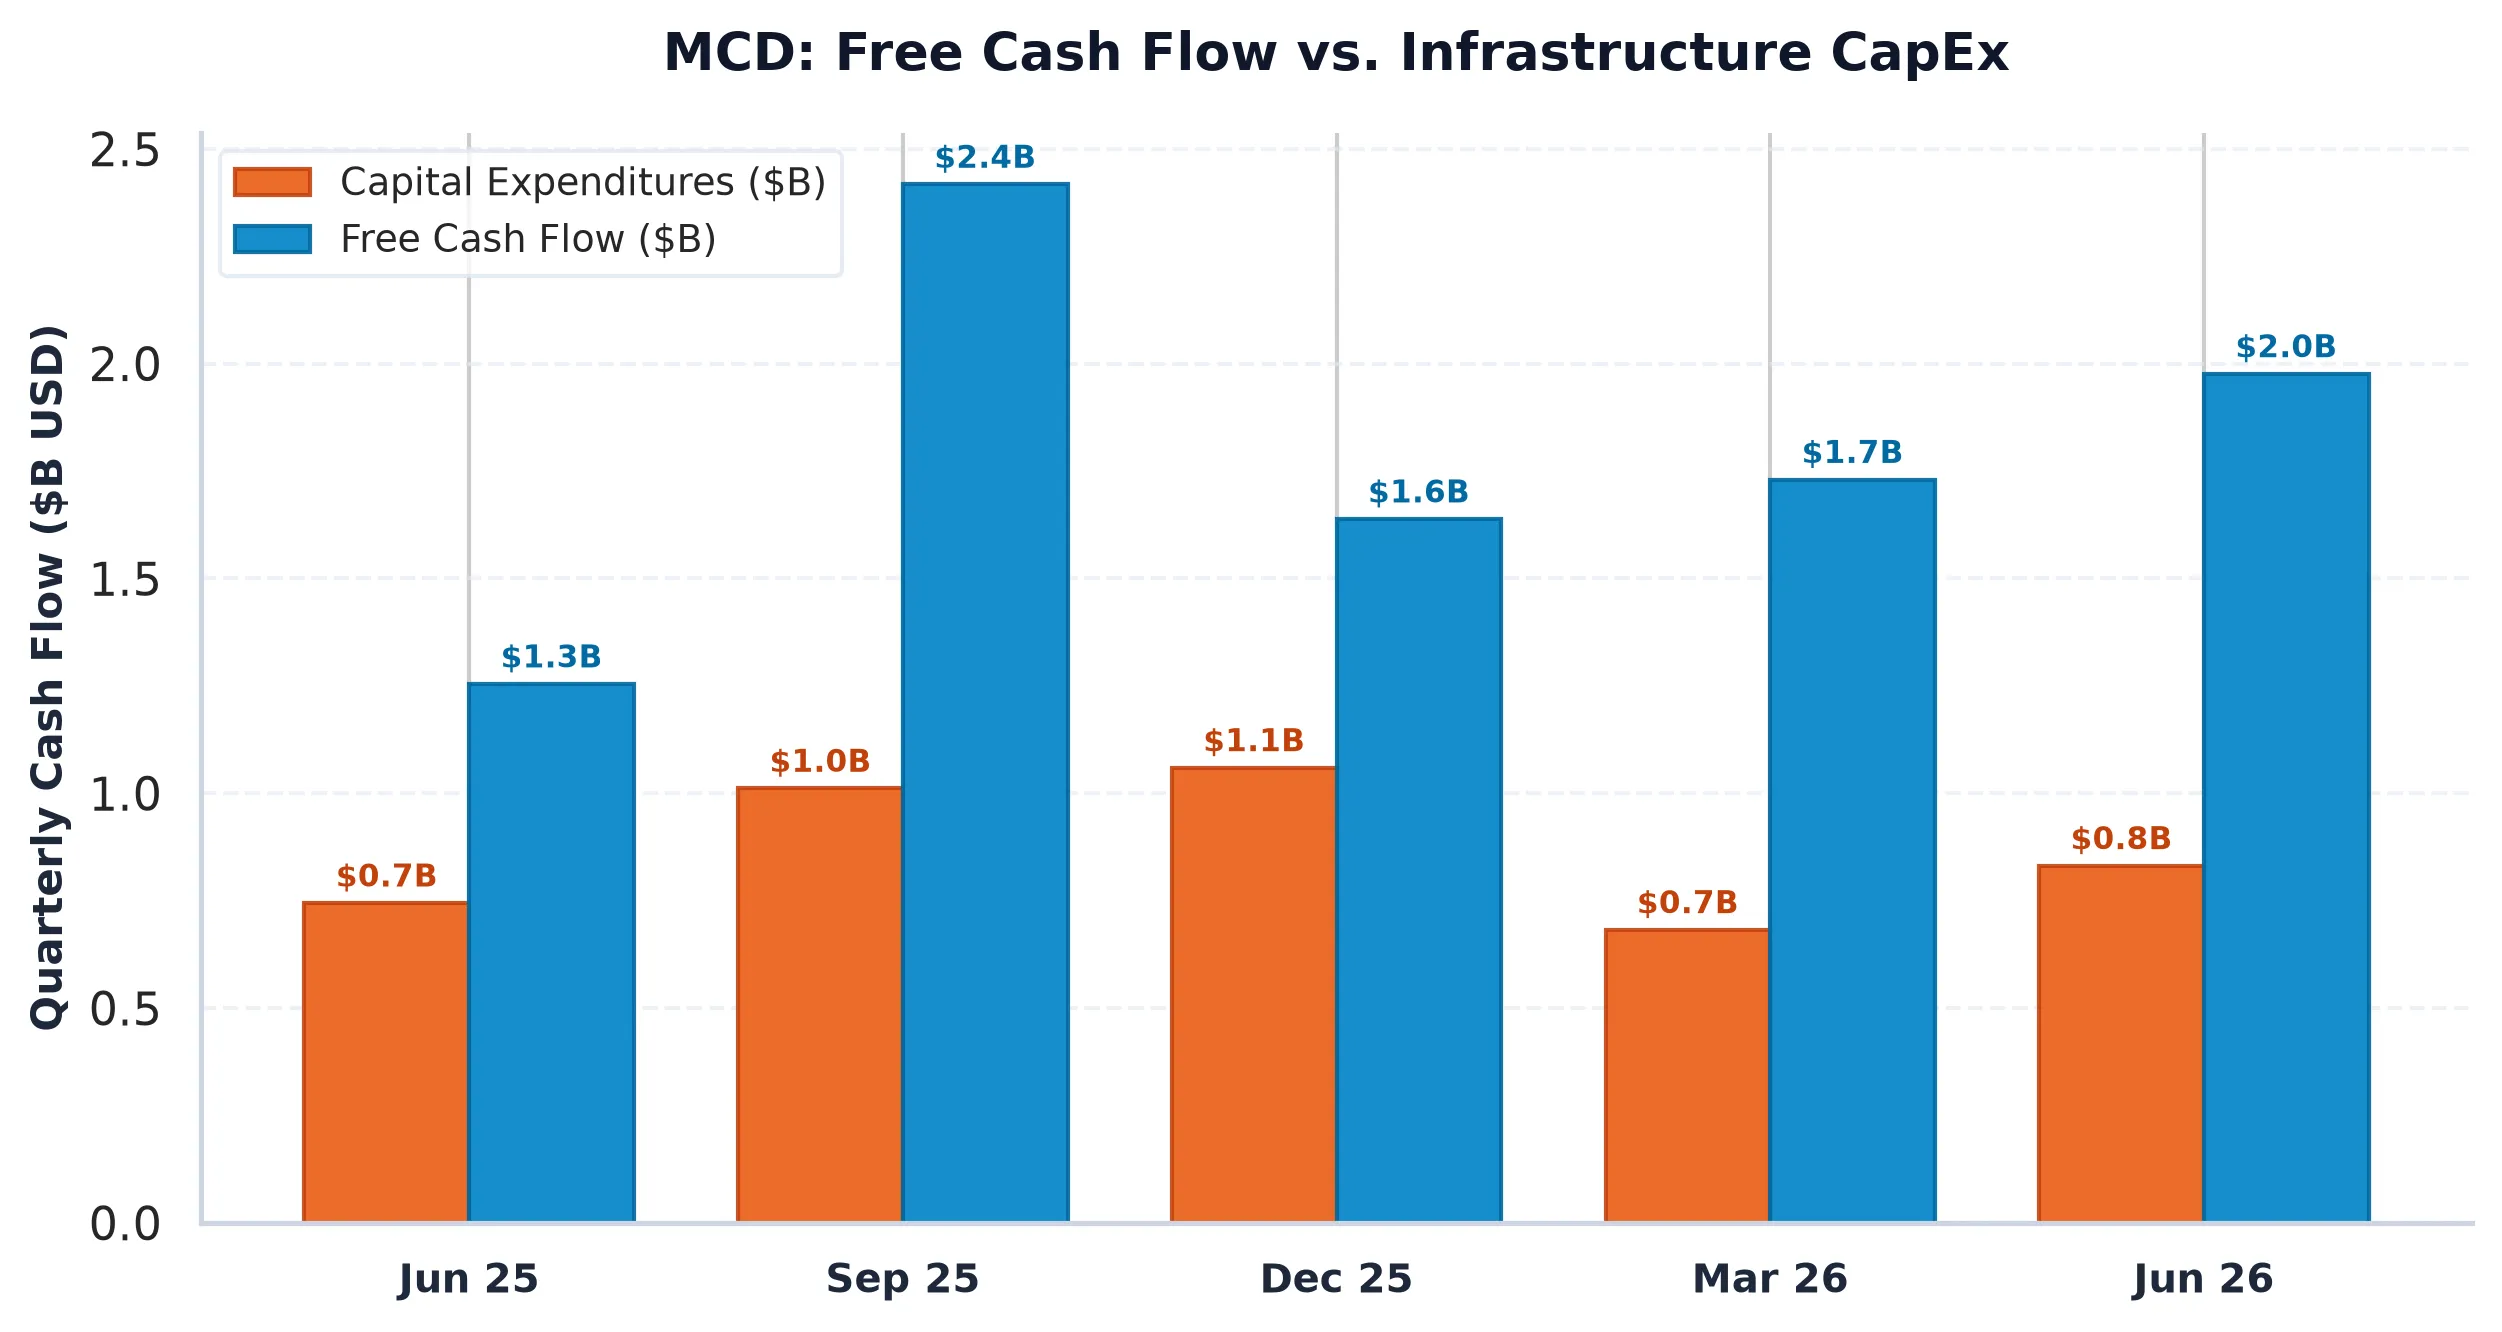
The operational reality is that McDonald’s does not operate as a traditional restaurant operator subject to everyday food cost volatility and store-level labor pressure. Instead, the company operates as a tollbooth. Over 95% of its global footprint is run by independent franchisees who pay McDonald’s upfront rent (often structured as a fixed percentage of gross sales) alongside ongoing monthly royalty fees.
When food prices rise or traffic drops, store-level margins for individual operators may tighten, but corporate parent revenue remains protected by minimum rent clauses and top-line royalty structures. In a macroeconomic climate where the US 10-Year Treasury yield floats around 4.93%, equity investors demand real cash conversion rather than aspirational unit growth. McDonald’s delivers exactly that through structural capital protection.
Multi-Year Financial Trajectory, ROIC & Cash-Flow Mechanics
To appreciate why McDonald’s maintains an operating margin above 46%, one must examine its historical financial trajectory over the past four fiscal years. The business model consistently transforms incremental system revenue into pure corporate cash flow.
| Period | Revenue | Operating Income | Operating Margin | Free Cash Flow | SBC Expense |
|---|---|---|---|---|---|
| FY2022 | $23.18B | $10.35B | 44.6% | $5.49B | $167.0M |
| FY2023 | $25.50B | $11.75B | 46.1% | $7.25B | $175.0M |
| FY2024 | $25.92B | $11.85B | 45.7% | $6.67B | $172.0M |
| FY2025 | $26.89B | $12.39B | 46.1% | $7.19B | $165.0M |
Across this multi-year stretch, revenue grew from $23.18 billion in FY2022 to $26.89 billion in FY2025. Over the same period, operating income expanded from $10.35 billion to $12.39 billion, lifting operating margins from 44.6% to 46.1%. Currently, the company boasts a overall operating margin of 46.48% and a net profit margin of 31.72%.
This margin superiority drives an impressive Return on Invested Capital (ROIC) of 19.28%, easily eclipsing the company’s weighted average cost of capital (WACC) hurdle rate of roughly 8.5%. The engine behind this high return profile is capital discipline. McDonald’s requires its franchisees to fund individual restaurant build-outs, equipment packages, and local labor costs. Corporate capital expenditure, which totaled $5.08 billion over the trailing twelve months (representing an 18.35% CapEx intensity ratio), is directed into high-return digital infrastructure, strategic land purchases, and system-wide technology upgrades under its NEXT strategy.
A forensic look at the balance sheet reveals $54.60 billion in total debt offset by $822 million in cash, producing net debt of $53.78 billion. While a Net Debt to EBITDA ratio of 3.60x might raise flags for a capital-intensive manufacturer, it is exceptionally manageable for McDonald’s. The debt is primarily long-term, fixed-rate obligation backed by an irrepressible global real estate portfolio.
Equally important for common shareholders is the quality of reported earnings. Annual stock-based compensation (SBC) stands at a modest $170 million, representing just 1.5% of operating cash flow. Subtracting SBC from reported free cash flow yields a real FCF of $6.10 billion (a 3.12% real FCF yield). Combined with a 2.93% dividend yield and $2.06 billion in annual share repurchases (a 1.05% buyback yield), the total shareholder yield reaches 3.98%. Unlike tech compounders that use share repurchases merely to absorb heavy executive options dilution, McDonald’s buyback program actively shrinks net share count while returning tangible cash.
Peer Relative Valuation & Competitive Moat
When evaluating consumer discretionary and dining giants, Wall Street often lumps McDonald’s into the same basket as traditional restaurant chains. This classification creates a valuation disconnect that savvy allocators can exploit.
| Company (Ticker) | Market Cap | Forward P/E | EV/EBITDA | Rev Growth (YoY) | Operating Margin | FCF Yield |
|---|---|---|---|---|---|---|
| McDonald’s (MCD) | $195.3B | 20.1x | 16.1x | 3.70% | 46.48% | 3.21% |
| Starbucks (SBUX) | $122.8B | 28.9x | 24.1x | -4.5% | 12.8% | 2.60% |
| Chipotle Mexican Grill (CMG) | $43.9B | 26.2x | 20.7x | 9.6% | 14.1% | 2.70% |
| Yum! Brands (YUM) | $43.8B | 24.1x | 18.1x | 12.2% | 32.8% | 1.90% |
A direct peer comparison shows why McDonald’s stands out on a risk-adjusted basis:
- Valuation Discount: McDonald’s trades at 20.1x forward earnings and 16.1x EV/EBITDA. By contrast, Starbucks trades at 28.9x forward earnings despite negative top-line revenue growth (-4.5%), while Chipotle commands a 26.2x multiple.
- Margin Superiority: McDonald’s operating margin of 46.48% is more than three times that of Starbucks (12.8%) and Chipotle (14.1%). Even Yum! Brands, which also utilizes a heavily franchised model, trails McDonald’s by nearly 1,400 basis points with an operating margin of 32.8%.
- Cash Flow Durability: McDonald’s generates a 3.21% FCF yield, topping Starbucks (2.60%), Chipotle (2.70%), and Yum! Brands (1.90%).
While Chipotle achieves faster top-line sales growth (9.6% YoY), its company-owned store model exposes it to food cost inflation, wage pressures, and store-level operating risks. Starbucks faces structural margin erosion from shifting consumer preferences and labor reorganization efforts. McDonald’s, on the other hand, insulates its earnings power behind long-term commercial lease contracts and scalable digital app engagement.
With a Rule of 40 score of 26.3% (3.7% revenue growth plus a 22.6% FCF margin), McDonald’s delivers steady compounding that institutional benchmark huggers consistently undervalue during economic transitions.
Options Gamma Pinning, Risk Bounds & Verdict
While long-term value is driven by cash flow returns, short-term price action is moderated by options market structure. Current derivatives positioning indicates clean structural support around current trading levels.
The front-month options series displays a Put/Call Open Interest ratio of 0.67, indicating a healthy call bias among institutional traders. The current price of $275.95 sits directly on primary call resistance at the $275 strike (4,968 contracts), with secondary call walls situated at $280 and $300. Downside risk is anchored by heavy put support at $250 (5,642 contracts) and $235 (4,242 contracts).
The options market prices in an At-The-Money (ATM) Implied Volatility of 20.09%, establishing a deterministic 30-day expected move of +/- $15.89 (or +/- 5.76%). The Max Pain strike is currently positioned at $250.00 (-9.40% below spot price). Overall dealer inventory reflects a balanced gamma profile.
This option setup suggests that near-term upside may experience temporary consolidation around the $275 to $280 call accumulation zone. However, any temporary dip toward put support at $250 offers an attractive entry window for long-term equity capital.
McDonald’s represents a masterclass in capital efficiency. It combines premier operating margins (46.5%), a strong ROIC (19.3%), and an attractive shareholder return profile (3.98% total yield) with a valuation discount relative to its dining peers. While consensus remains distracted by temporary traffic statistics, the company continues to collect high-margin cash flow through its global fast-food tollbooth.
McDonald's Corporation (MCD)
Trailing P/E
Marcus Wolfe Screen
Leverage Profile
30D Channel
Pristine cash flow conversion (1.23x) and healthy accrual ratio (-3.34%). Zero accounting anomalies detected (LOW ANOMALY RISK).
Elevated Leverage (3.60x Net Debt/EBITDA); balance sheet requires structural deleveraging.
Negative yield spread (-1.73% vs 5.10% Treasury); equity requires robust multiple expansion or growth.
Max Pain: $250.00 (-9.40%) | P/C Ratio: 0.67 | 30D Channel: $260.06 – $291.84. Dealer gamma bounded between $250 Put Wall and $275 Call Wall.
MCD carries standard index weighting (< 0.6% SPY footprint); sell-side consensus reflects standard earnings momentum rather than index-tracking mandates.
$245.00 – $255.00 (Options Support Pinning)
Sustained weekly close below $250.00 (Put Wall) or gross margin compression below 57.38%.
Sources & References
- Official SEC Form 10-K Annual Report (Filed 2026-02-24)
-
Official SEC EDGAR Filings: McDonald’s Corporation SEC Filings (CIK 0000063908)
- Corporate Investor Relations: McDonald’s Corporation Investor Portal
- Form 8-K Earnings Release: Filed November 4, 2026 via SEC EDGAR.
Disclaimer: This research article is published strictly for informational and educational purposes and does not constitute individual investment advice or financial recommendations. Figures and metrics are derived from SEC filings and primary exchange feeds.