
The thing about being a prominent Wall Street bear is that you eventually have to stop being one if you want to keep your job or at least your audience. For years, Mike Wilson, Chief U.S. Equity Strategist & Wealth Management CIO at Morgan Stanley (MS), has been the personification of institutional caution. He was the guy telling you the party was over while everyone else was still looking for the punch bowl. But this week, the weather changed. Morgan Stanley has officially reset its S&P 500 target for 2027, projecting a 15% upside. When the most famous bear in the building decides it is time to buy, you should probably look at what the building itself is doing.
What the building is doing is making an incredible amount of money by being less of a traditional bank and more of a giant, fee-collecting machine. In its latest regulatory filings, Morgan Stanley reported third quarter 2026 net revenues of $20.3 billion, up from $18.2 billion a year ago. This is not just a rounding error. It is the result of a decade-long pivot away from the volatile world of bond trading and toward the steady, recurring embrace of wealth management. The market likes steady. It pays a premium for steady.
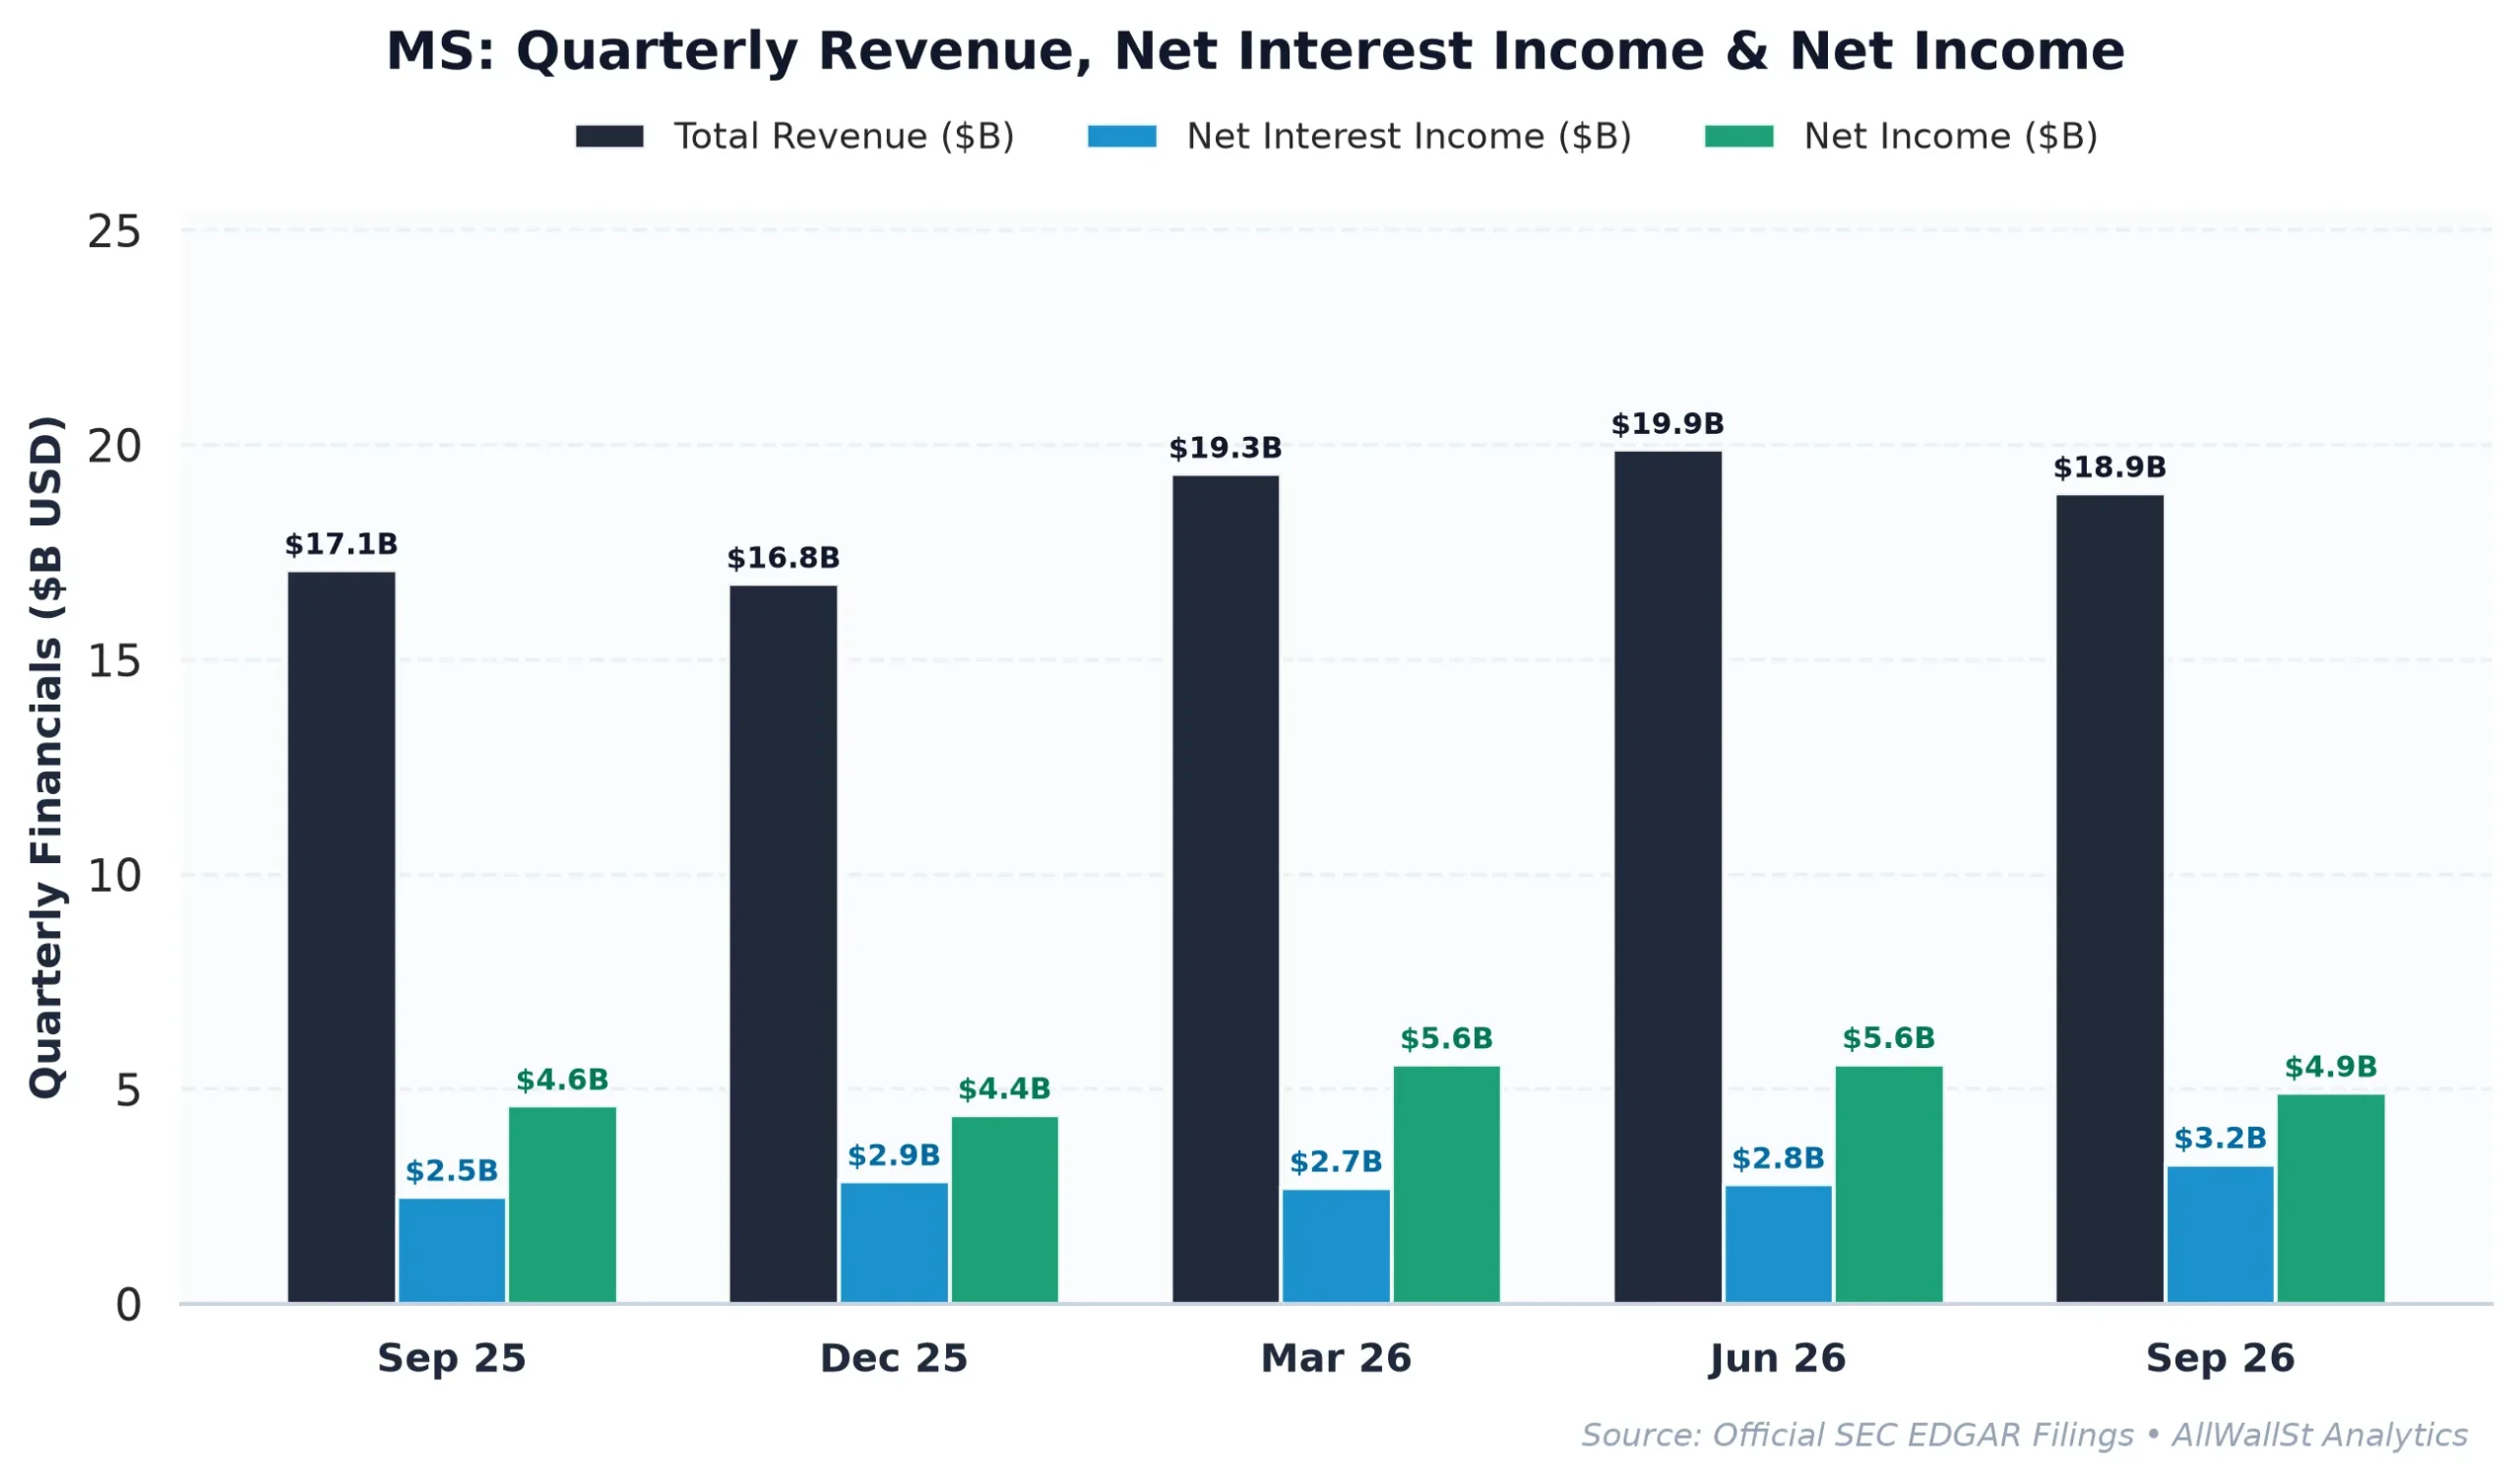
The Wealth Management Moat and the 18% Return
To understand Morgan Stanley, you have to look at Return on Equity (ROE). This is a simple measure of how much profit a bank generates with the money shareholders have actually plugged into the business. While many regional lenders are struggling to keep their heads above water in a 5.12% interest rate environment, Morgan Stanley is sporting an ROE of 18.04%. For context, that is significantly higher than the typical cost of capital for a bank of this size, meaning they are creating real economic value rather than just moving piles of cash around.
The engine behind this is the Wealth Management division, which provides a cushion when the investment banking side gets quiet. However, the investment banking side is no longer quiet. The firm’s SEC Form 10-Q shows that Institutional Securities reported record net revenues earlier this year, driven by a surge in equity capital markets and strategic activity. They are even finding ways to monetize the AI boom without actually being a chip company, acting as a key advisor for firms like CoreWeave, where they recently set a $70 price target.
| Period | Revenue | Net Interest Income | Pretax Income | Net Income | Net Margin | SBC Expense |
|---|---|---|---|---|---|---|
| FY2022 | $50.21B | $9.33B | $14.09B | $10.54B | 21.0% | $1.88B |
| FY2023 | $50.67B | $8.23B | $11.81B | $8.53B | 16.8% | $1.71B |
| FY2024 | $57.62B | $8.61B | $17.60B | $12.80B | 22.2% | $1.62B |
| FY2025 | $65.97B | $10.05B | $21.95B | $16.25B | 24.6% | $1.93B |
This trajectory is what institutional investors call a “clean story.” Revenue has climbed from $50.21 billion in 2022 to $65.97 billion in audited FY2025 results. More importantly, the net margin has expanded from 21% to nearly 25%. In the world of high finance, getting bigger and more profitable at the same time is the ultimate flex. It suggests that the fixed costs of their massive wealth platform are now being covered by a growing base of assets, allowing more of every new dollar to drop straight to the bottom line.
The Valuation Gap: Why MS Wins the Beauty Contest
When you compare Morgan Stanley to its peers, you see why it trades at a premium. It currently carries a Price-to-Book (P/B) ratio of 2.71x. In banking, P/B compares the market’s valuation of the company to the actual value of the assets on its books. A 2.71x multiple is quite high: Goldman Sachs (GS) trades at 2.43x and JPMorgan Chase (JPM) is at 2.56x. Usually, a higher P/B means the market expects you to generate higher returns on those assets, and Morgan Stanley is delivering exactly that.
| Company (Ticker) | Market Cap | Forward P/E | P/B | ROE | Rev Growth (YoY) | Dividend Yield |
|---|---|---|---|---|---|---|
| Morgan Stanley (MS) | $290.1B | 13.6x | 2.71x | 18.04% | 10.80% | 2.48% |
| Goldman Sachs Group (GS) | $257.2B | 12.0x | 2.43x | 17.71% | 23.3% | 2.24% |
| JPMorgan Chase & Co. (JPM) | $898.2B | 13.2x | 2.56x | 18.01% | 10.2% | 1.95% |
| Charles Schwab (SCHW) | $160.4B | 11.9x | 3.55x | 21.11% | 16.9% | 1.38% |
The forward P/E of 13.6x is reasonable for a company growing revenue at double digits (10.8% YoY). While Charles Schwab (SCHW) has a higher ROE, it also carries a much higher P/B multiple of 3.55x, making Morgan Stanley look like a relative bargain for investors who want exposure to capital markets without paying top-of-the-market prices. Furthermore, Morgan Stanley is a capital return machine. Between dividends and share buybacks, the total shareholder yield is 4.49%. That is a lot of cash being funneled back to owners while the underlying business continues to scale.
The recent litigation in East Texas (Nearby Systems LLC v. Morgan Stanley) regarding patent issues is the kind of routine legal noise that large financial institutions eat for breakfast. It rarely impacts the long term earnings power of a global bank holding $767 billion in gross cash and regulated balance-sheet liquidity. What matters more is the “IPO Halo” we discussed 21 days ago. Since then, the firm has proven that its role in the next wave of tech IPOs is not just about prestige: it is about generating the kind of institutional engagement that keeps the ROE near 18%.
Options Plumbing and the $185 Magnet
If you want to know where the stock is going in the next few weeks, you have to look at the market makers. In the options market, there is a concept called “Max Pain.” This is the strike price where the largest number of options contracts expire worthless, causing the least amount of financial payout for dealers. Currently, the Max Pain strike for Morgan Stanley is $185.00. With the stock trading at $185.57, the price is effectively pinned to this level as we approach expiration.
The options structure is remarkably balanced. The Put/Call Open Interest ratio is 0.95, which means there is almost an equal amount of hedging and speculation on both sides. We see a significant “Put Wall” at $170. This is a level where dealers have sold a large number of protective puts and would be forced to buy the underlying stock to hedge their position if the price fell that far, creating a mechanical floor. On the upside, there is a “Call Wall” at $200, which acts as a ceiling where sellers will likely defend their strikes.
The implied volatility suggests an expected 30 day move of roughly 9.42%. This means the market expects the stock to stay within a range of roughly $168 to $203 over the next month. Given the fundamental strength, any move toward that $170 put wall should be viewed as a buying opportunity rather than a reason to panic. The dealer gamma is neutral, meaning there is no massive imbalance forcing the stock to move violently in one direction or the other without a fresh catalyst.
Investment Committee Steelman Dissent: The primary risk to this thesis is a “higher for longer” interest rate environment that finally triggers a significant credit event in commercial real estate, forcing Morgan Stanley to take larger than expected loan loss provisions. Additionally, if the 2027 bull case from Mike Wilson proves premature, the stock could suffer from multiple compression as investors rotate out of capital markets and back into defensive “risk free” Treasuries.
AllWallSt Investment Verdict: BUY
(Upgrade from HOLD)
Morgan Stanley (MS)
Trailing P/E
Marcus Wolfe Screen
Leverage Profile
30D Channel
Dealer Gamma Pinning & Max Pain Alignment (MS)
🎯 Max Pain: $185.00
Spot $185.57
Ceiling $200C Resistance ▲
Banking liquidity & regulatory capital compliant (Basel III / CET1 governed); deposit & trading settlement flows normalized.
Tier 1 Regulatory Capital & Liquidity Coverage Ratio (LCR) compliant; balance sheet governed by Basel III capital buffers.
Evaluated against 5.12% US 10-Yr Benchmark; bank net interest margins sensitive to yield curve slope (2s10s spread) and deposit beta.
Max Pain: $185.00 (-0.31%) | P/C Ratio: 0.95 | 30D Channel: $168.09 – $203.05. Dealer gamma bounded between $170 Put Wall and $200 Call Wall.
MS carries standard index weighting (< 0.6% SPY footprint); sell-side consensus reflects standard earnings momentum rather than index-tracking mandates.
$166.60 – $173.40 (Options Support Pinning)
Sustained weekly close below $170.00 (Put Wall) or compression in ROE and net interest margins.
Bearish IC Dissent: At 14.7x trailing earnings and 18.04% ROE (2.71x P/B) against a 5.12% 10-year risk-free hurdle, Morgan Stanley (MS) leaves limited cushion for top-line deceleration or net interest margin and credit quality compression. If institutional flows break below the $170 put wall, dealer de-hedging can accelerate multiple contraction before fundamental buyers step in.
Investigative Reporting & Public Record Sourcing: Dispatches published under Word on Wall St constitute financial news reporting, investigative journalism, and market commentary on matters of public and economic interest. Information is synthesized from publicly available regulatory filings (including SEC Form 8-K, Form 10-K, and Form 10-Q disclosures), official corporate press communications, verified news reports, and discussions with institutional market participants.
Presumption of Innocence & Unadjudicated Allegations: Any references to executive conduct, personal relationships, workplace misconduct, whistleblower claims, espionage inquiries, internal governance reviews, or government investigations represent reported allegations and active inquiries as of the publication date. They do not constitute formal judicial determinations, legal verdicts, or findings of guilt, civil liability, or statutory wrongdoing unless expressly identified as adjudicated final court judgments.
Protected Editorial Commentary & Non-Investment Counsel: All quantitative scenario analyses, key-person risk haircuts, forward valuation estimates, dealer gamma pinning levels, and investment conviction ratings reflect protected analytical opinion, editorial commentary, and financial modeling under the First Amendment. Nothing herein constitutes legal counsel, personal tax advice, or individualized investment advice. AllWallSt and its contributors assume no liability for trading, investment, or commercial decisions taken on the basis of this report.
Sources & References
- Official SEC Form 10-K Annual Report (Filed 2026-02-19)
- SEC Form 8-K Exhibit 99.1 (Press Release / Earnings) (2026-10-14)
- SEC Form 8-K Exhibit 99.1 (Press Release / Earnings) (2026-07-15)
- SEC SCHEDULE 13D/A Beneficial Ownership Disclosure (2026-07-15)
- SEC DEF 14A Proxy / M&A Filing (2026-04-02)
- Federal Register (2026-07-06): Combined Notice of Filings #2
- Federal Register (2026-10-09): Combined Notice Of Filings
- Morgan Stanley Investor Relations: https://www.morganstanley.com/about-us/investor-relations
- SEC EDGAR Filings (CIK 0000895421): https://www.sec.gov/edgar/browse/?CIK=0000895421
- Federal Court Docket (Nearby Systems LLC v. Morgan Stanley): https://www.courtlistener.com/docket/75126779/nearby-systems-llc-v-morgan-stanley-co-llc/
- SEC Form 10-Q (Filed Nov 5, 2026): https://www.sec.gov/Archives/edgar/data/895421/000089542126000293/ms-20260930.htm
Regulatory Disclaimer: AllWallSt is a financial publisher, not an investment advisor. This analysis is for informational purposes only and does not constitute a recommendation to buy or sell any security. Financial markets involve significant risk, and past performance is not indicative of future results. Always consult with a certified financial professional before making investment decisions. All data is sourced from primary SEC filings and exchange feeds as of November 17, 2026.