
⚡ Executive Morning Takeaways
- Overnight Futures & Rates Impulse: Equity futures are sharply bifurcated heading into the Friday cash open, with E-Mini Nasdaq contracts sliding 2.39% while Russell 2000 futures advance 0.97%. The 10-Year Treasury yield eases 1.11% to 4.99%, yet elevated capital hurdles continue to punish speculative duration assets in favor of balance-sheet cash generators.
- Sector Rotation Leaders & Laggards: Capital is pivoting aggressively into defensive cash compounders. Healthcare (XLV) surges 2.40% alongside Consumer Staples (XLP, +1.54%), while high-multiple Technology (XLK, -1.18%) and Communication Services (XLC, -1.87%) absorb persistent liquidation.
- Primary Corporate Catalyst: AbbVie Inc. (ABBV) jumps 2.44% pre-market to $298.00 ahead of its Q3 earnings release. The market is pricing in accelerated volume ramp across Skyrizi and Rinvoq to decisively eclipse legacy Humira biosimilar erosion.
🌐 Pre-Market Macro, Futures & Rates Dashboard
| Asset / Benchmark | Ticker | Current Price / Level | Change (%) | 52-Week Low | 52-Week High |
|---|---|---|---|---|---|
| E-Mini S&P 500 Futures (ES=F) | ES=F | $7671.25 | -1.07% | $6353.25 | $7897.50 |
| E-Mini Nasdaq 100 Futures (NQ=F) | NQ=F | $28856.75 | -2.39% | $22961.50 | $31616.50 |
| S&P 500 (SPY) | SPY | $769.36 | -0.38% | $629.28 | $781.62 |
| Nasdaq 100 (QQQ) | QQQ | $715.34 | -1.42% | $555.60 | $762.86 |
| Russell 2000 (IWM) | IWM | $284.01 | +0.97% | $228.90 | $305.18 |
| 20+ Year Treasury (TLT) | TLT | $81.49 | +0.62% | $76.43 | $90.97 |
| High Yield Corporate (HYG) | HYG | $77.58 | -0.01% | $76.39 | $81.24 |
| Gold (GLD) | GLD | $368.57 | -1.32% | $361.39 | $509.70 |
| WTI Crude Oil (CL=F) | CL=F | $104.23/bbl | +2.19% | $54.98 | $119.48 |
| US Dollar Index Bullish (UUP) | UUP | $29.04 | -0.07% | $26.40 | $29.25 |
| CBOE Volatility Index (^VIX) | ^VIX | 18.50 | +7.56% | 13.38 | 35.30 |
| 2-Yr US Treasury Yield (2YY=F) | 2YY=F | 4.75% | +0.00% | 3.38% | 4.88% |
| 10-Yr US Treasury Yield (^TNX) | ^TNX | 4.99% | -1.11% | 3.96% | 5.36% |
The cross-asset tape reflects a classic defensive rotation triggered by heightened volatility and persistent cost-of-capital gravity. With the CBOE Volatility Index spiking 7.56% to 18.50 and WTI crude pushing above $104 per barrel, institutional desks are de-grossing high-beta tech exposure. The 2.39% tumble in E-Mini Nasdaq futures highlights how quickly multiple compression hits equities when the risk-free benchmark hovers near 5.0%.
Although the 10-Year Treasury yield pulled back slightly to 4.99%, the sovereign hurdle remains formidable. When risk-free paper offers 5%, equities must demonstrate authentic pricing power and immediate cash conversion. The modest bid in long-dated Treasuries (TLT +0.62%) paired with resilient high-yield spreads (HYG flat at $77.58) indicates orderly portfolio rebalancing rather than broad liquidity panic, channeling capital directly toward balance sheets with fortress margins.
📊 Sector Rotation Leaders & Laggards
| Rotation Rank | Sector ETF | Ticker | Price | Change (%) | Trailing P/E | Dividend Yield | 52-Week Low | 52-Week High |
|---|---|---|---|---|---|---|---|---|
| Leader (#1) | Healthcare (XLV) | XLV | $184.04 | +2.40% | 32.8x | 1.52% | $141.97 | $184.85 |
| Leader (#2) | Consumer Staples (XLP) | XLP | $88.18 | +1.54% | 26.2x | 2.73% | $75.16 | $90.14 |
| Leader (#3) | Utilities (XLU) | XLU | $43.14 | +1.53% | 19.5x | 3.07% | $39.03 | $47.80 |
| Laggard (#8) | Energy (XLE) | XLE | $68.71 | +0.38% | 19.6x | 2.48% | $43.19 | $69.86 |
| Laggard (#9) | Technology (XLK) | XLK | $188.74 | -1.18% | 30.9x | 0.43% | $126.68 | $203.25 |
| Laggard (#10) | Communication Services (XLC) | XLC | $101.21 | -1.87% | 14.8x | 1.24% | $100.13 | $120.41 |
Leadership across equity sectors this morning belongs strictly to non-cyclical cash generators. Healthcare (XLV) leads the tape with a 2.40% advance, closely tracked by Consumer Staples (XLP) and Utilities (XLU). Institutional investors are paying up for visible earnings durability and dependable dividend streams, systematically rotating out of crowded mega-cap communications and semiconductor holdings.
This dispersion underscores an institutional flight to stability. While Technology trades at 30.9 times trailing earnings with an anaemic 0.43% dividend yield, Healthcare offers structural insulation against consumer demand fatigue. As macroeconomic uncertainty widens, asset allocators are treating pharmaceutical and medical balance sheets as primary equity proxies for corporate credit.
📅 Today’s Earnings & Economic Radar
Imminent Corporate Earnings Releases
| Company / Ticker | Timing | Consensus EPS | Consensus Revenue | Key Strategic Theme |
|---|---|---|---|---|
| AbbVie (ABBV) | Today (BMO / AMC) | $3.77 | $17.34B | Skyrizi/Rinvoq Immunology Ramp vs Humira Biosimilar Erosion |
| ExxonMobil (XOM) | Today (BMO / AMC) | $4.04 | $105.24B | Permian & Guyana Upstream Production vs Pioneer Synergies |
| Chevron (CVX) | Today (BMO / AMC) | $4.87 | $62.01B | Permian Free Cash Flow Breakeven & Share Repurchase Pace |
| Amazon (AMZN) | Yesterday (Reported) | $1.99 | $202.26B | AWS AI CapEx Intensity vs North America Retail Margin |
| Eli Lilly (LLY) | Yesterday (Reported) | $11.12 | $24.50B | Zepbound/Mounjaro GLP-1 Manufacturing Scale & Payor Coverage |
High-Impact Economic Data & Central Bank Actions
| Time (ET) | Event | Impact | Key Institutional Focus |
|---|---|---|---|
| 08:30 AM | Core PCE Price Index (Fed Preferred Inflation Gauge) & Personal Income | CRITICAL | Real Disposable Income vs Core PCE Trajectory |
| 10:00 AM | Univ. of Michigan Consumer Sentiment & 5-Yr Inflation Expectations | HIGH | Long-Run Inflation Anchoring |
| 01:00 PM | Baker Hughes Weekly Rig Count & Weekly OPEX Pinning | MEDIUM | 0DTE / Weekly Options Dealer Gamma Unwind |
Institutional desks are laser-focused on the 08:30 AM Core PCE inflation print. With the 10-Year yield resting uncomfortably close to 5.0%, any hotter-than-expected reading on personal consumption expenditures threatens to cement higher terminal rate expectations, putting further valuation pressure on equities into the weekly options expiration close.
🎯 Pre-Market Spotlight: AbbVie Inc. (ABBV)
AbbVie Inc. (ABBV) enters the pre-market session trading up 2.44% at $298.00, defying broader index weakness as investors position for third-quarter numbers. For years, the standard bear case on AbbVie was simple: when Humira, the biggest pharmaceutical blockbuster in history, lost exclusivity, the company’s free cash flow machine would inevitably stall. Instead, the biopharmaceutical giant has engineered one of the most successful commercial pipeline handoffs in pharmaceutical history. Skyrizi and Rinvoq have scaled rapidly across immunology indications, returning corporate revenue to double-digit growth (+10.2% year-over-year) and lifting operating margins back to 40.03%.
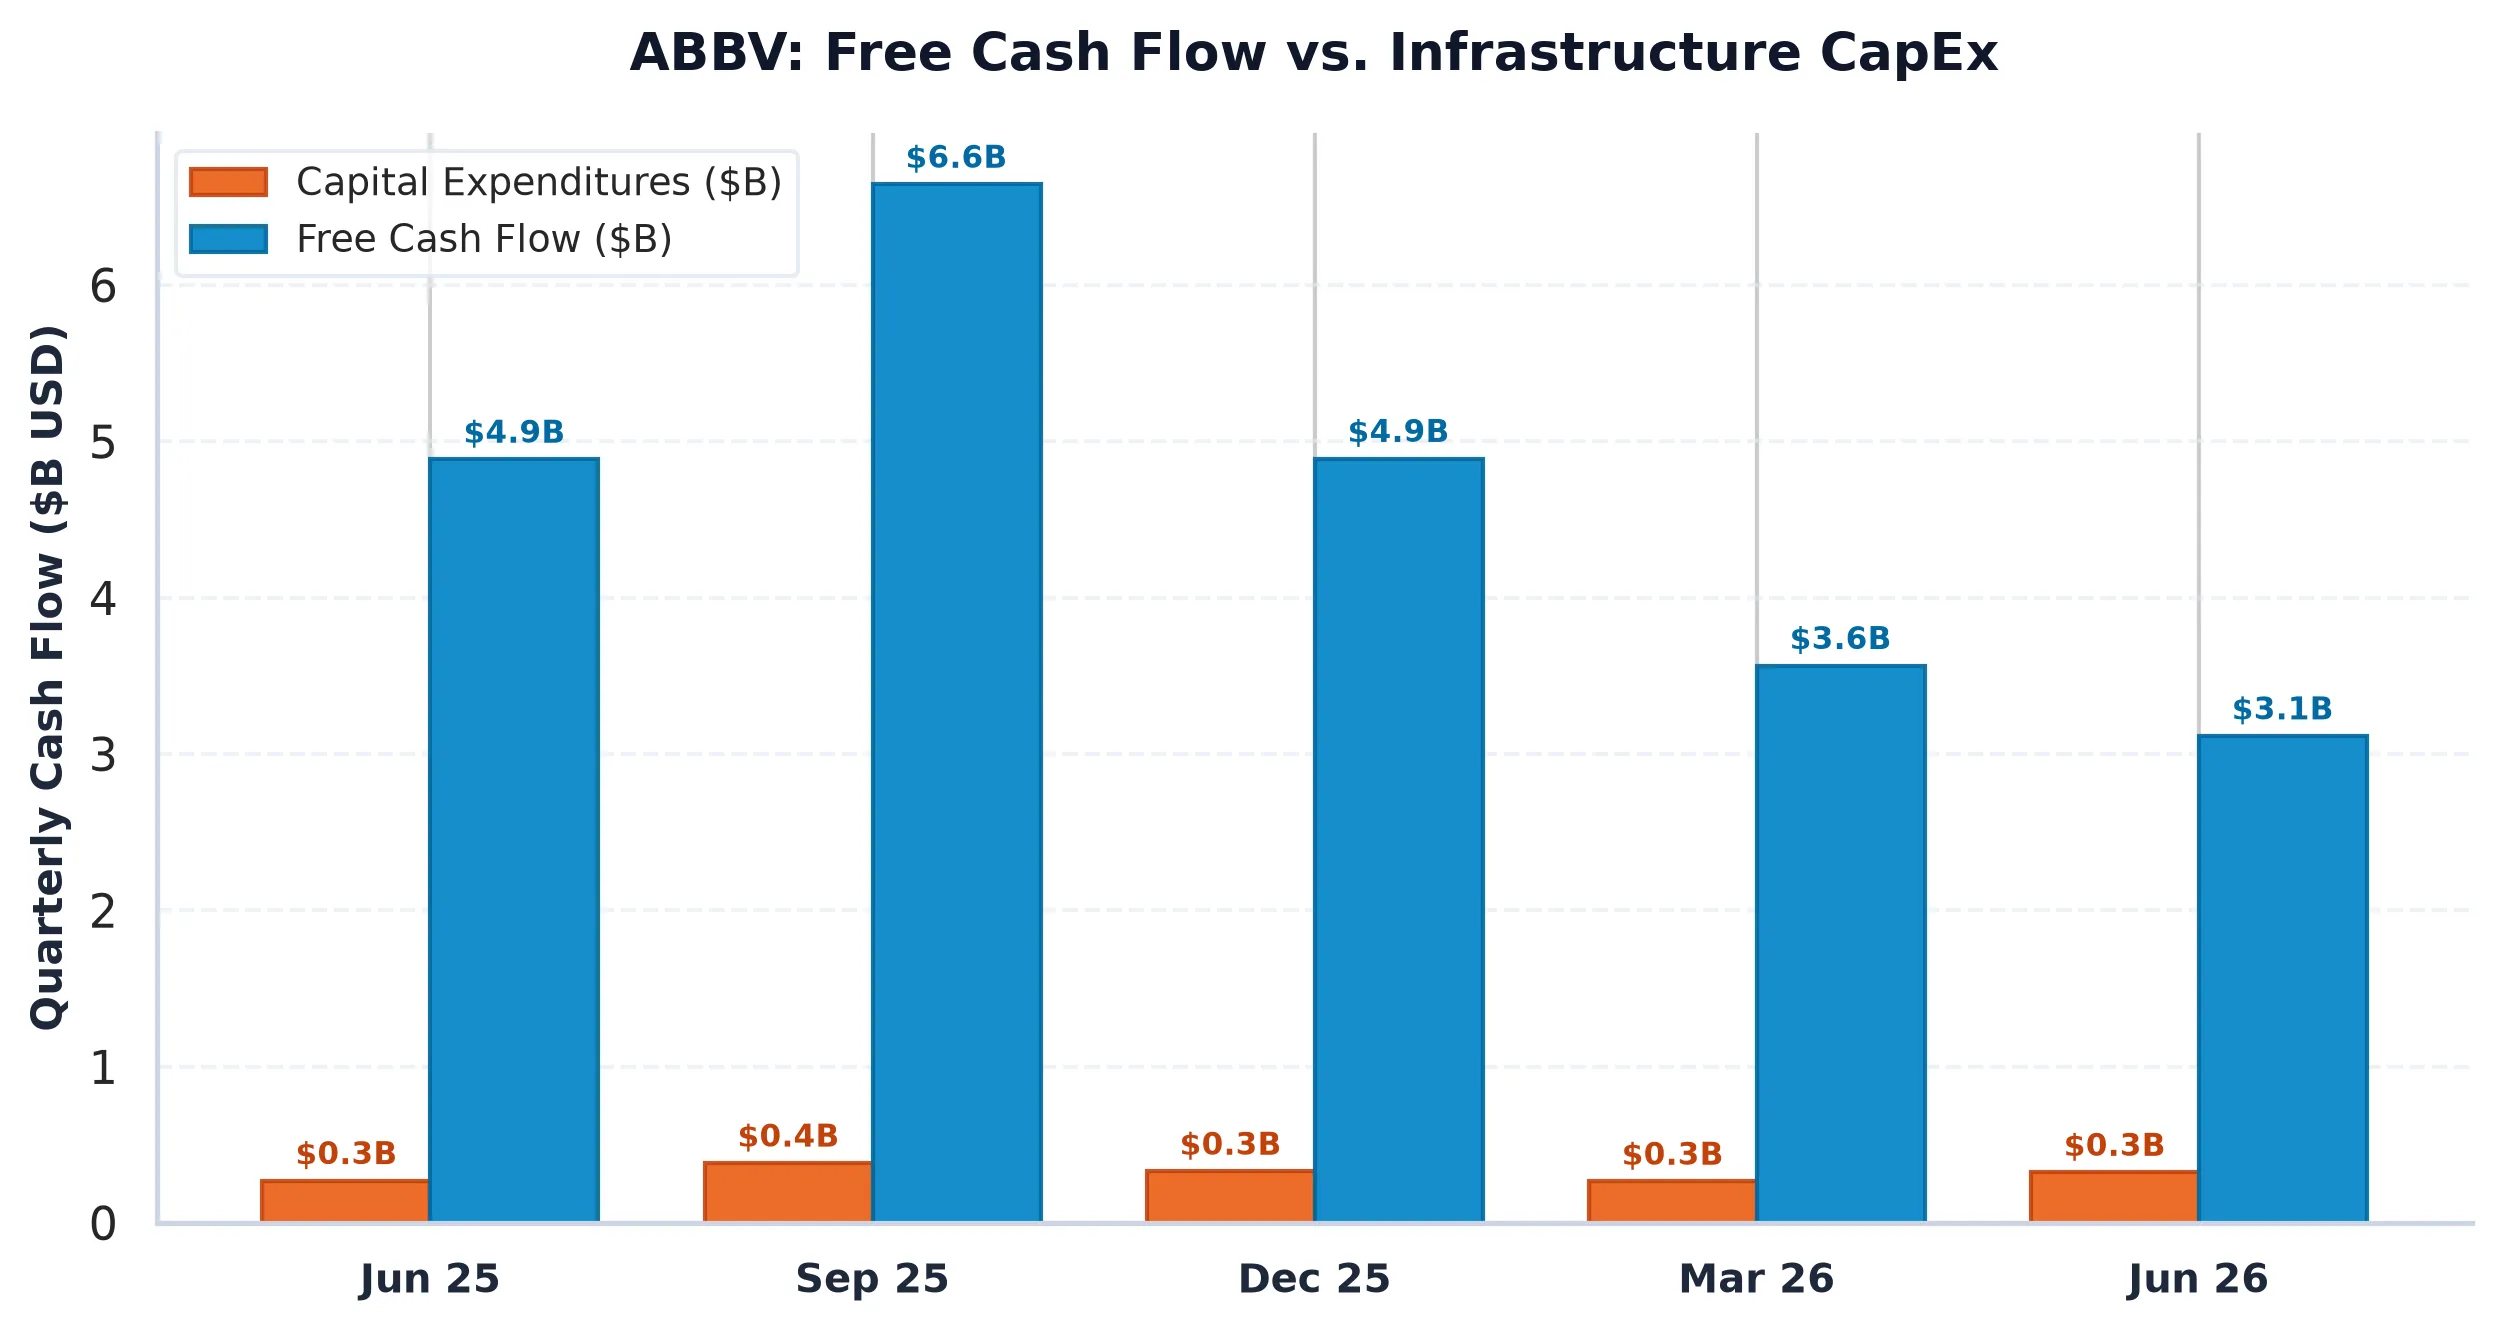
A forensic review of the capital structure reinforces the strength behind the narrative. Over the trailing twelve months, AbbVie generated $16.87 billion in reported free cash flow, translating to $15.92 billion in real cash generation after stripping out $955 million in stock-based compensation. Operating cash flows easily absorb the company’s modest 4.10% CapEx intensity ($2.64 billion). While a static free cash flow yield of 3.28% sits below the risk-free 10-Year Treasury yield of 4.99%, evaluating this business purely on an equity risk premium spread misses its compounding engine. AbbVie generates an exceptional 34.88% return on invested capital (ROIC) against an estimated 8.5% cost of capital, reflecting durable economic rents that generic erosion has failed to disrupt.
When benchmarked against sector peers, the valuation setup remains compelling. AbbVie trades at an attractive 18.0 times forward earnings with an EV/EBITDA of 18.8x, compared to Eli Lilly (LLY) trading at 28.0 times forward earnings. Amgen (AMGN) commands 18.8 times forward earnings while delivering slower top-line expansion at 9.5%, and Bristol-Myers Squibb (BMY), despite a single-digit 9.3x multiple, generates only 6.9% revenue growth with lower operational margins (33.7%). AbbVie’s Rule of 40 score of 36.4% sits at the top tier of large-cap pharma, supported by a healthy 2.57% total shareholder yield through sustainable quarterly distributions and programmatic debt retirement. Leverage sits comfortably managed at 2.09 times Net Debt to EBITDA.
Market plumbing adds near-term tactical fuel. Options market structure reveals heavy defensive positioning, with a put/call open interest ratio of 36.0 and primary call resistance establishing a wall at $292.50 to $295.00. With spot shares breaking out to $298.00 in pre-market trade, options dealers who sold upside calls are forced into mechanical delta hedging, buying underlying stock to maintain neutrality. The 30-day expected move prices in a tight plus-or-minus $10.41 band, reflecting muted 12.5% implied volatility. Wall Street maintains an index-mandated Overweight consensus, driven by AbbVie’s ~0.9% weighting in the S&P 500, but our independent conviction rests on cold fundamental reality: premier operating margins, expanding immunology market share, and superior reinvestment returns.
AbbVie Inc. (ABBV)
Trailing P/E
Marcus Wolfe Screen
Leverage Profile
30D Channel
Pristine cash flow conversion (4.50x) and healthy accrual ratio (-11.05%). Zero accounting anomalies detected (LOW ANOMALY RISK).
Moderate Leverage (2.09x Net Debt/EBITDA); manageable through operating cash generation.
Negative yield spread (-1.71% vs 5.10% Treasury); equity requires robust multiple expansion or growth.
Max Pain: $190.00 (-34.66%) | P/C Ratio: 36.0 | 30D Channel: $280.38 – $301.20. Dealer gamma bounded between $290 Put Wall and $292.5 Call Wall.
ABBV represents a core ~0.9% index pillar. Institutional managers face persistent benchmark drag if under-allocated during sector rallies, biasing sell-side consensus toward institutional overweight.
$284.20 – $295.80 (Options Support Pinning)
Sustained weekly close below $290.00 (Put Wall) or gross margin compression below 72.79%.
Sources & References
- SEC EDGAR Filings Archive: AbbVie Inc. (CIK 0001551152)
- AbbVie Inc. Form 10-K Annual Report (Filed February 20, 2026): SEC EDGAR 10-K
- AbbVie Inc. Form 10-Q Quarterly Report (Filed August 3, 2026): SEC EDGAR 10-Q
- Official Corporate & Investor Relations: AbbVie Inc. Portal
Regulatory Disclaimer: This publication is produced strictly for informational, educational, and institutional research purposes. Nothing contained herein constitutes investment, legal, or tax advice, nor should any statement be construed as an endorsement or solicitation to buy or sell any security. Past performance is no guarantee of future results.