
⚡ Executive Morning Takeaways
- Macro & Rates Impulse: The 10-Year Treasury yield has ascended to 5.04%, creating a restrictive valuation ceiling for long-duration equities. While the US Dollar Index (UUP) shows a slight cooling at 29.06, the cost of capital remains the primary gravity well for growth multiples.
- Sector Rotation & Dispersion: Technology (XLK) continues to lead with a 0.80% gain despite a 31.3x trailing multiple. Defensive rotation is stalling in Utilities (XLU), as capital gravitates toward high-margin balance sheets that can withstand the 5% risk-free hurdle.
- Primary Corporate Catalyst: Amazon.com, Inc. (AMZN) reports earnings tonight against a backdrop of massive capital intensity. With annual CapEx reaching $158.18 billion, institutional desks are scrutinizing whether cloud and advertising margins can offset the massive hardware spend required for the AI arms race.
🌐 Pre-Market Macro & Rates Dashboard
| Asset / Benchmark | Ticker | Current Price / Level | Change (%) | 52-Week Low | 52-Week High |
|---|---|---|---|---|---|
| S&P 500 (SPY) | SPY | $772.31 | +0.34% | $629.28 | $781.62 |
| Nasdaq 100 (QQQ) | QQQ | $725.61 | +0.60% | $555.60 | $762.86 |
| Russell 2000 (IWM) | IWM | $281.29 | +0.40% | $228.90 | $305.18 |
| 20+ Year Treasury (TLT) | TLT | $80.99 | -0.78% | $76.43 | $91.89 |
| High Yield Corporate (HYG) | HYG | $77.59 | -0.01% | $76.39 | $81.24 |
| Gold (GLD) | GLD | $373.51 | +0.33% | $361.36 | $509.70 |
| WTI Crude Oil (CL=F) | CL=F | $101.45/bbl | -1.29% | $54.98 | $119.48 |
| US Dollar Index Bullish (UUP) | UUP | $29.06 | -0.21% | $26.40 | $29.25 |
| CBOE Volatility Index (^VIX) | ^VIX | 17.04 | +0.77% | 13.38 | 35.30 |
| 2-Yr US Treasury Yield (2YY=F) | 2YY=F | 4.75% | +0.00% | 3.38% | 4.88% |
| 10-Yr US Treasury Yield (^TNX) | ^TNX | 5.04% | +1.04% | 3.96% | 5.36% |
The 10-Year Treasury yield hitting 5.04% is the only number that truly matters this morning. When the risk-free rate provides a 5% yield, the equity risk premium for high-multiple technology stocks essentially evaporates. We are currently seeing a market where the S&P 500 is struggling to justify its valuation spread, especially as the 20+ Year Treasury (TLT) continues to bleed out, down 0.78% today.
Crude oil is providing a slight disinflationary tailwind, dropping 1.29% to $101.45 per barrel, but this is cold comfort when the discount rate is this high. The VIX remains in a state of nervous complacency at 17.04. It is high enough to suggest concern but low enough to imply that the market has not yet priced in a genuine volatility shock from the upcoming earnings deluge.
📊 Sector Rotation Leaders & Laggards
| Rotation Rank | Sector ETF | Ticker | Price | Change (%) | Trailing P/E | Dividend Yield | 52-Week Low | 52-Week High |
|---|---|---|---|---|---|---|---|---|
| Leader (#1) | Technology (XLK) | XLK | $191.00 | +0.80% | 31.3x | 0.43% | $126.68 | $203.25 |
| Leader (#2) | Financials (XLF) | XLF | $56.13 | +0.45% | 16.0x | 1.55% | $47.67 | $58.60 |
| Leader (#3) | Energy (XLE) | XLE | $68.45 | +0.35% | 19.5x | 2.48% | $43.19 | $69.86 |
| Spotlight Sector | Consumer Discretionary (XLY) | XLY | $115.33 | -0.10% | 25.4x | 0.86% | $105.19 | $125.01 |
| Laggard (#8) | Consumer Staples (XLP) | XLP | $86.84 | -0.36% | 25.8x | 2.73% | $75.16 | $90.14 |
| Laggard (#9) | Communication Services (XLC) | XLC | $103.14 | -0.42% | 15.1x | 1.24% | $102.62 | $120.41 |
| Laggard (#10) | Utilities (XLU) | XLU | $42.49 | -0.84% | 19.2x | 3.07% | $39.03 | $47.80 |
Sector dispersion is widening as the market separates the cash-flow generators from the dreamers. Technology (XLK) is the clear outlier, trading at a 31.3x multiple, which is a bold stance in a 5% rate environment. Meanwhile, Communication Services (XLC) looks almost neglected at 15.1x, reflecting a massive valuation gap between pure software plays and ad-supported platforms.
We are seeing a notable retreat from Utilities (XLU), which fell 0.84% this morning. In a world where you can get 5.04% from a Treasury note, the 3.07% dividend yield from a utility company is no longer the defensive haven it once was. Capital is rotating into Financials (XLF) and Healthcare (XLV), seeking a balance between reasonable multiples and earnings stability.
📅 Today’s Earnings & Economic Radar
Imminent Corporate Earnings Releases
| Company / Ticker | Timing | Consensus EPS | Consensus Revenue | Key Strategic Theme |
|---|---|---|---|---|
| Amazon (AMZN) | Today (AMC) | $1.99 | $202.26B | AWS AI CapEx Intensity vs North America Retail Margin |
| Intel (INTC) | Today (AMC) | $0.40 | $16.49B | Turnaround Progress & Foundry Load |
| Mastercard (MA) | Today (BMO) | $5.17 | $9.66B | Consumer Spending Resilience |
| Eli Lilly (LLY) | Today (BMO) | $6.61 | $22.62B | GLP-1 Supply Chain Capacity |
| Merck (MRK) | Today (BMO) | $2.09 | $17.33B | Oncology Growth & Pipeline |
High-Impact Economic Data & Central Bank Actions
| Time (ET) | Event | Impact | Key Institutional Focus |
|---|---|---|---|
| 08:30 AM | US GDP Growth Rate & Core PCE Quarterly Price Index | CRITICAL | Real Final Sales to Private Domestic Purchasers |
| 08:30 AM | Initial Jobless Claims & Continuing Claims | HIGH | Labor Market Resilience vs Fed Rate Path |
| 10:00 AM | NAR Pending Home Sales Index | MEDIUM | Contract Signings Under 5%+ Treasury Yields |
| 10:30 AM | EIA Weekly Natural Gas Storage Report | MEDIUM | Data-Center & Utility Baseload Pricing |
Institutional desks are hyper-focused on the 30-Year Treasury Bond auction at 1:00 PM. After the 10-Year yield breached 5%, the appetite for long-dated duration will be the ultimate signal for equity sentiment. If the auction “tails” (meaning yields come in higher than expected), expect a sharp liquidation in high-multiple tech names before the closing bell.
🎯 Pre-Market Spotlight: Amazon.com, Inc. (AMZN)
Amazon.com, Inc. (AMZN) is currently a logistics company that moonlights as a cloud provider and is increasingly becoming a massive, hungry machine for semiconductors. To understand Amazon today, you have to look past the brown boxes and focus on the $158.18 billion in capital expenditures. That is a staggering 20.39% of revenue being plowed back into the business. For context, that is roughly equivalent to buying the entire market capitalization of a major blue-chip company every single year just to keep the servers humming and the AI bots training.
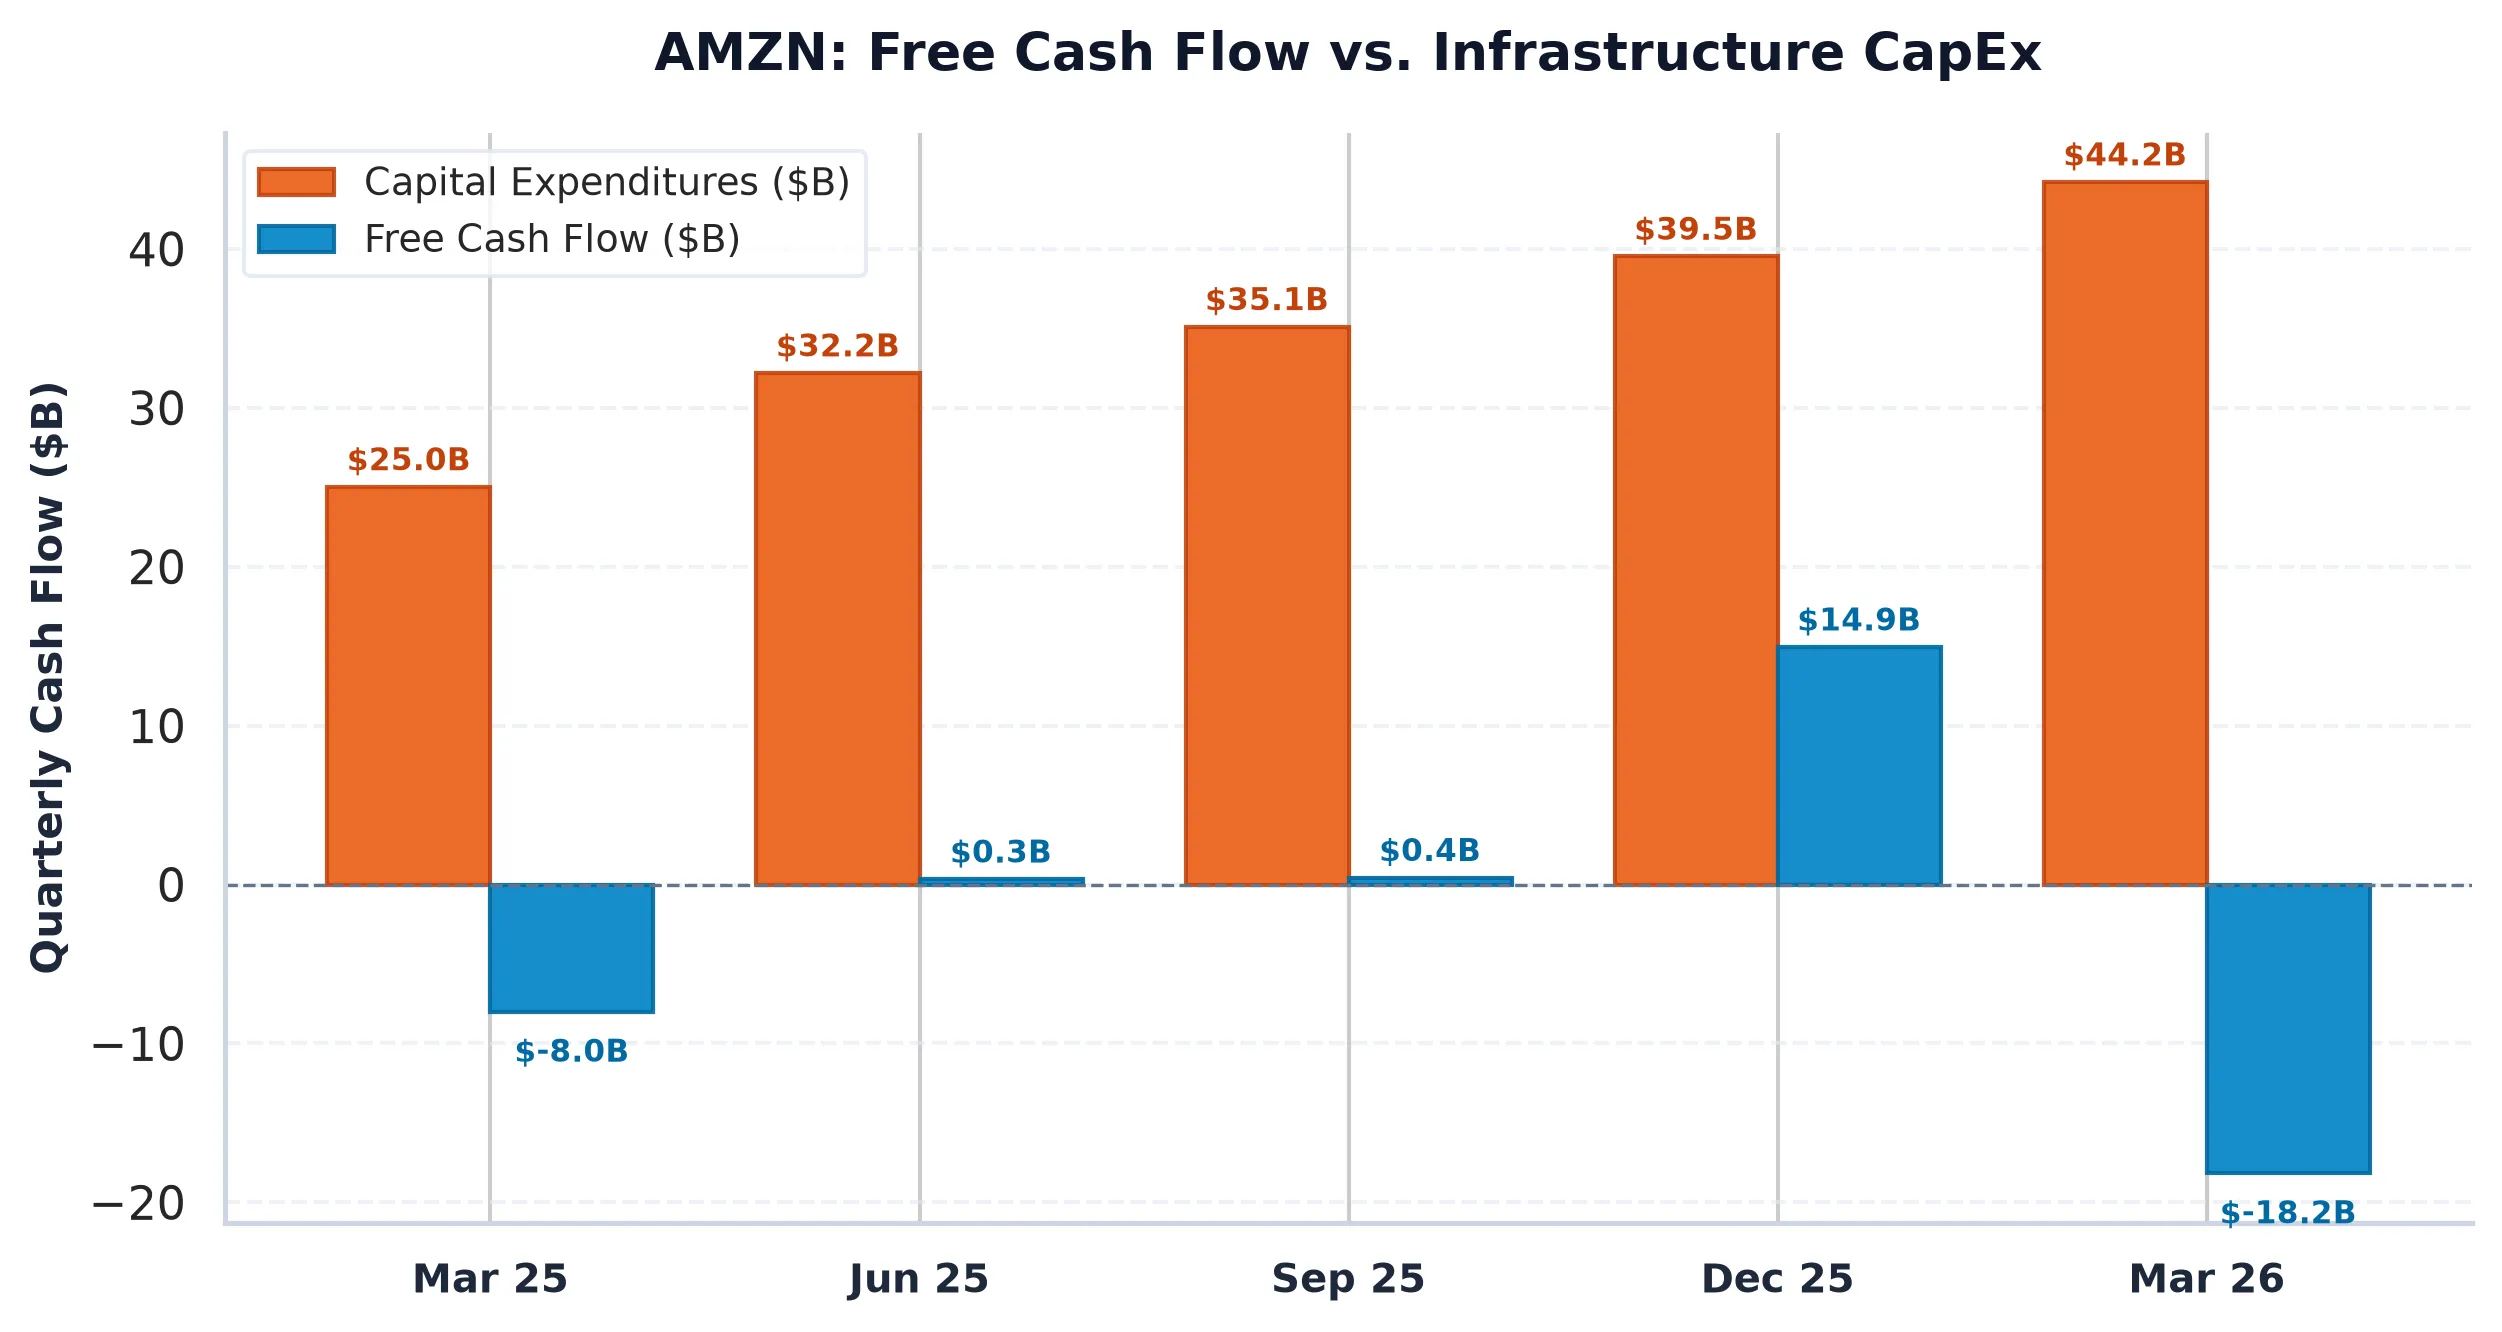
The fundamental problem for Amazon right now is the math of the risk-free rate. The company currently generates a Free Cash Flow (FCF) yield of just 0.12%. When you compare that to the 5.04% yield on a 10-Year Treasury, the spread is a negative 4.93%. In the language of institutional finance, this is known as “extreme duration risk.” You are essentially paying a massive premium for cash flows that might arrive in the distant future, while Uncle Sam is offering to pay you 5% today for doing absolutely nothing.
From a market structure perspective, the options desk shows a Put/Call Open Interest ratio of 0.4, with dealer gamma anchored around a Max Pain strike of $250.00 (+0.55% from current spot). Upside call resistance is heavily concentrated at $280 (54,470 contracts), $320 (26,726 contracts), $265 (26,685 contracts), while institutional downside put protection is stacked at $225 (14,778 contracts), $230 (9,829 contracts), $240 (9,664 contracts). With the options market pricing a 30-day expected move of +/-$63.10 (+/-25.38%), dealers are bracing for a decisive post-earnings volatility expansion while passive index funds remain locked into Amazon’s ~5.5% S&P 500 Benchmark Gravity footprint.
If Amazon reports tonight and shows that the $158 billion in CapEx is finally starting to squeeze operating margins, that -4.93% FCF spread will become very difficult to defend. Institutional investors are willing to tolerate low current yields if the growth is explosive, but with Gene Munster and other analysts warning that AI bots could threaten the core search and shopping moats, the “trust me” phase of the investment cycle is nearing its end.
Amazon.com, Inc. (AMZN)
Trailing P/E
Marcus Wolfe Screen
Leverage Profile
30D Channel
Pristine cash flow conversion (1.80x) and healthy accrual ratio (-7.56%). Zero accounting anomalies detected (LOW ANOMALY RISK).
Manageable liability structure relative to institutional cash flow.
Evaluated against 5.10% US 10-Yr Benchmark (FCF Spread: -4.86% (vs 10Y Yield of 4.98%)).
Max Pain: $250.00 (+0.55%) | P/C Ratio: 0.4 | 30D Channel: $230.81 – $266.45.
AMZN commands a massive ~4.9% S&P 500 benchmark footprint. Wall Street sell-side consensus reflects structural career-risk defense: institutional funds face severe benchmark tracking penalties for underweighting mega-cap heavyweights, forcing mandatory allocations regardless of current Free Cash Flow yield.
$228.74 – $238.68 (-4% to -8% Pullback Accumulation)
Sustained weekly close below $223.77 (-10.0% structural stop) or fundamental cash flow deterioration.
Sources & References
- Official SEC Form 10-K Annual Report (Filed 2026-02-06)
- Official SEC Form 10-Q Quarterly Report (Filed 2026-07-31)
- Official SEC EDGAR Filings: https://www.sec.gov/edgar/browse/?CIK=0001018724
- Amazon Investor Relations: https://www.amazon.com
- Market Data via Primary Exchange Feeds and Deterministic Quantitative Models.
Regulatory Disclaimer: This report is for informational purposes only and does not constitute investment advice, financial analysis, or a recommendation regarding any securities transaction. The analysis provided reflects the institutional views of AllWallSt based on primary market data and regulatory filings. Investing in public equities involves significant risk, including the potential loss of principal. Past performance is not indicative of future results. AllWallSt and its analysts may hold positions in the securities mentioned. Consult with a qualified financial advisor before making any investment decisions.