
⚡ Executive Morning Takeaways
- Overnight Futures & Rates Impulse: Nasdaq 100 futures are underperforming (-0.54%) relative to a flat S&P 500 (+0.15%), as the 10-Year Treasury yield softens slightly to 4.89%. Risk appetite remains bifurcated between secular growth and defensive rotation.
- Sector Rotation Leaders & Laggards: Consumer Discretionary (XLY) is the clear leader with a 4.26% surge, while Energy (XLE) remains the primary laggard, dropping 4.74% as institutional capital shifts toward high-margin hyperscalers and financials.
- Primary Corporate Catalyst: Amazon.com, Inc. (AMZN) is catching a post-election bid, trading up 1.45% in the pre-market to $269.88. This follows a 6% rally yesterday as investors look past a recent earnings miss to focus on the accelerating hyperscaler growth cycle.
🌐 Pre-Market Macro, Futures & Rates Dashboard
| Asset / Benchmark | Ticker | Current Price / Level | Change (%) | 52-Week Low | 52-Week High |
|---|---|---|---|---|---|
| E-Mini S&P 500 Futures (ES=F) | ES=F | $7732.00 | +0.15% | $6353.25 | $7897.50 |
| E-Mini Nasdaq 100 Futures (NQ=F) | NQ=F | $28412.00 | -0.54% | $22961.50 | $31616.50 |
| S&P 500 (SPY) | SPY | $766.81 | +1.65% | $629.28 | $781.62 |
| Nasdaq 100 (QQQ) | QQQ | $691.95 | +0.97% | $555.60 | $762.86 |
| Russell 2000 (IWM) | IWM | $284.02 | +1.51% | $228.90 | $305.18 |
| 20+ Year Treasury (TLT) | TLT | $81.76 | +0.80% | $76.43 | $90.86 |
| High Yield Corporate (HYG) | HYG | $77.52 | +0.70% | $76.39 | $81.24 |
| Gold (GLD) | GLD | $372.49 | +3.68% | $354.67 | $509.70 |
| WTI Crude Oil (CL=F) | CL=F | $88.81/bbl | +0.78% | $54.98 | $119.48 |
| US Dollar Index Bullish (UUP) | UUP | $28.90 | -0.38% | $26.40 | $29.25 |
| CBOE Volatility Index (^VIX) | ^VIX | 16.80 | +1.14% | 13.38 | 35.30 |
| 2-Yr US Treasury Yield (2YY=F) | 2YY=F | 4.75% | +0.00% | 3.38% | 4.88% |
| 10-Yr US Treasury Yield (^TNX) | ^TNX | 4.89% | -1.17% | 3.96% | 5.36% |
The macro backdrop is currently defined by a delicate dance with the 10-Year Treasury yield, which sits at 4.89%. In a world where risk-free government paper pays nearly 5 percent, the hurdle rate for equity duration is exceptionally high. Gold is acting as a peculiar outlier, surging 3.68%, which suggests a underlying current of institutional hedging against currency debasement or geopolitical tail risks despite the nominal rally in equities.
Equity risk premiums are compressed, particularly in the technology sector where Nasdaq futures are showing some fatigue. However, the move in the US Dollar Index (UUP) suggests a slight easing of liquidity tightening, providing a narrow window for multinationals to recapture some currency-related margin. The VIX at 16.80 indicates a market that is not exactly panicked, but certainly no longer complacent.
📊 Sector Rotation Leaders & Laggards
| Rotation Rank | Sector ETF | Ticker | Price | Change (%) | Trailing P/E | Dividend Yield | 52-Week Low | 52-Week High |
|---|---|---|---|---|---|---|---|---|
| Leader (#1) | Consumer Discretionary (XLY) | XLY | $122.33 | +4.26% | 25.6x | 0.81% | $105.19 | $125.01 |
| Leader (#2) | Financials (XLF) | XLF | $59.20 | +3.51% | 16.0x | 1.46% | $47.67 | $59.20 |
| Leader (#3) | Communication Services (XLC) | XLC | $104.96 | +3.47% | 16.7x | 1.38% | $99.33 | $120.41 |
| Laggard (#8) | Technology (XLK) | XLK | $176.50 | -0.01% | 31.1x | 0.47% | $126.68 | $203.25 |
| Laggard (#9) | Industrials (XLI) | XLI | $169.46 | -1.09% | 27.2x | 1.13% | $147.14 | $188.19 |
| Laggard (#10) | Energy (XLE) | XLE | $63.52 | -4.74% | 15.9x | 2.18% | $43.55 | $70.15 |
The sector dispersion is striking. Consumer Discretionary (XLY) is benefiting from a massive relief rally, likely fueled by expectations of domestic demand resilience. Meanwhile, Energy (XLE) has become a source of funds, dropping nearly 5 percent as capital rotates into more growth-oriented or interest-rate sensitive areas like Financials (XLF).
Institutional money is clearly favoring sectors with pricing power and secular tailwinds. Financials are enjoying the prospect of a steeper yield curve, while Communication Services (XLC) and Discretionary are being treated as the primary engines of the current momentum regime. The relative weakness in Technology (XLK) suggests some profit-taking in the most crowded AI names, though hyperscalers like Amazon are managing to decouple from this broader tech drag.
📅 Today’s Earnings & Economic Radar
Imminent Corporate Earnings Releases
| Company / Ticker | Timing | Consensus EPS | Consensus Revenue | Key Strategic Theme |
|---|---|---|---|---|
| ConocoPhillips (COP) | Today (BMO / AMC) | $3.05 | $18.96B | LNG & Lower-48 Capital Efficiency vs Variable Return of Cash |
| McDonald’s (MCD) | Yesterday (Reported) | $3.28 | $7.23B | Value-Menu Traffic Elasticity vs Franchisee Cash Flow |
High-Impact Economic Data & Central Bank Actions
| Time (ET) | Event | Impact | Key Institutional Focus |
|---|---|---|---|
| 08:30 AM | US GDP Growth Rate & Core PCE Quarterly Price Index | CRITICAL | Real Final Sales to Private Domestic Purchasers |
| 08:30 AM | Initial Jobless Claims & Continuing Claims | HIGH | Labor Market Resilience vs Fed Rate Path |
| 10:00 AM | NAR Pending Home Sales Index | MEDIUM | Contract Signings Under 5%+ Treasury Yields |
| 10:30 AM | EIA Weekly Natural Gas Storage Report | MEDIUM | Data-Center & Utility Baseload Pricing |
The 8:30 AM data dump is the primary event for institutional desks. The GDP and Core PCE print will either validate the current “higher for longer” narrative or suggest that the economy is finally beginning to cool under the weight of 5 percent rates. Jobless claims will serve as the secondary confirmation of labor market health, which remains the Fed’s primary excuse for maintaining its restrictive stance.
🎯 Pre-Market Spotlight: Amazon.com, Inc. (AMZN)
Amazon.com, Inc. (AMZN) is currently a company that exists in two dimensions. In one dimension, it is a retail behemoth that manages the logistics of shipping millions of items to doorstep. In the other, more profitable dimension, it is a massive landlord for the internet, operating AWS. The market is currently obsessed with the latter, particularly as the post-election landscape suggests a deregulation tailwind for hyperscalers. The pre-market quote of $269.88 represents a 1.45% extension, as investors seem willing to overlook the -1.21% Free Cash Flow yield in exchange for the 12.1% revenue growth story.
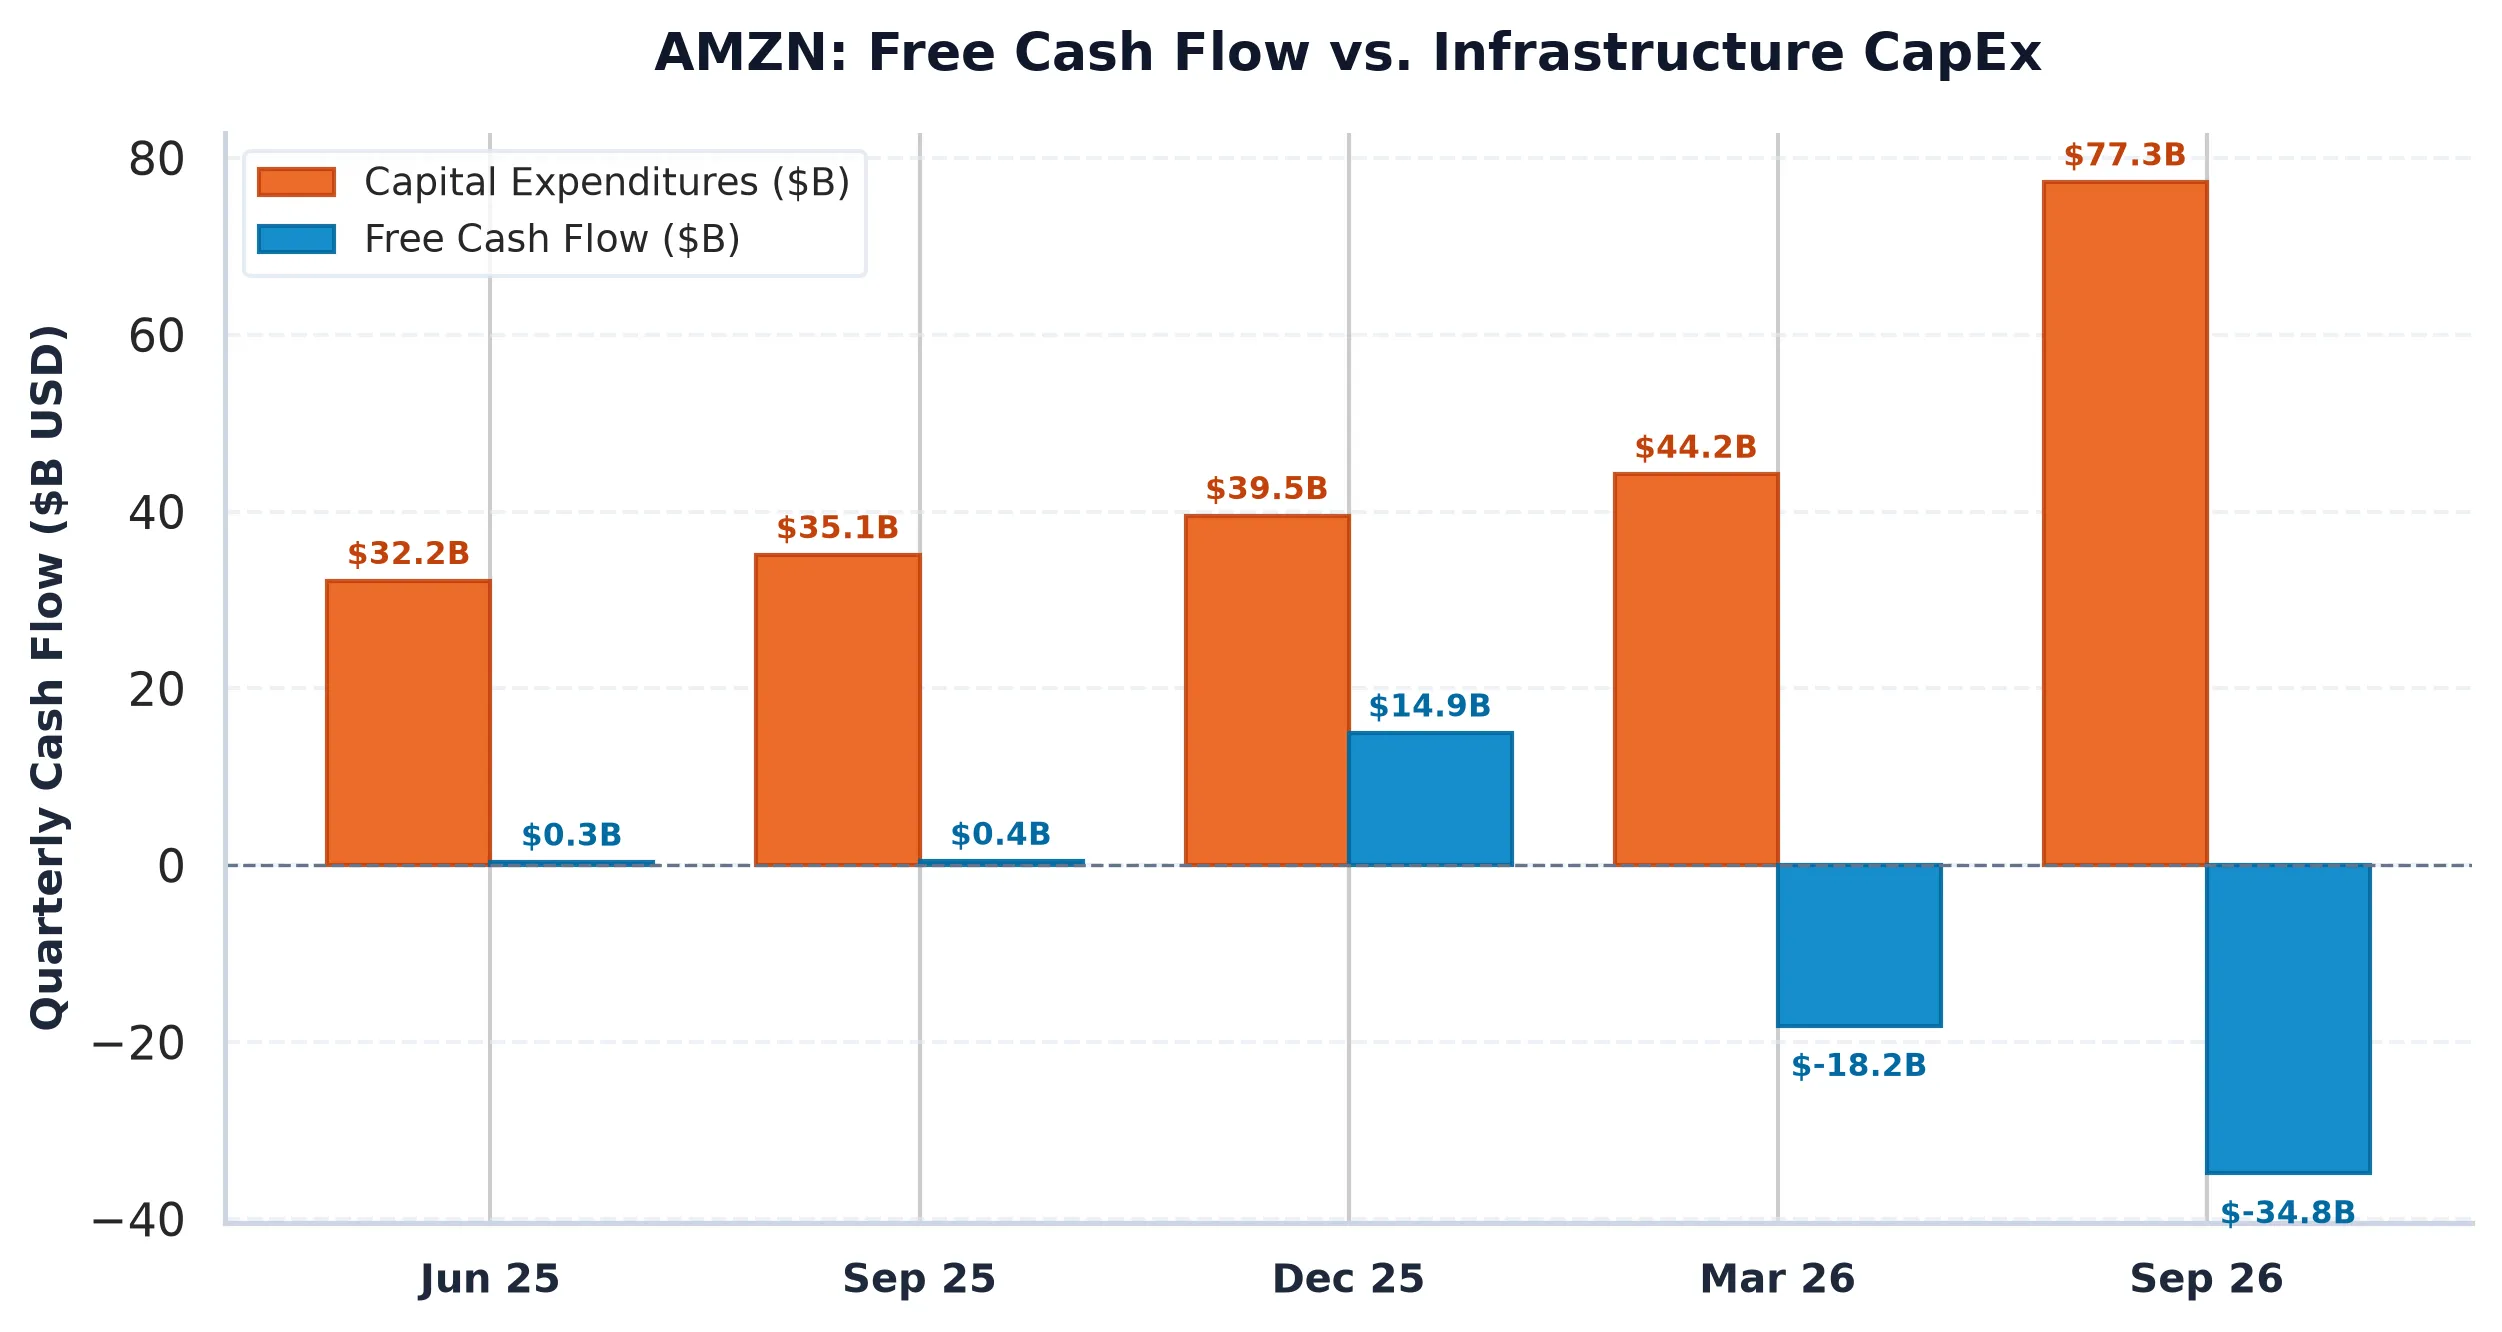
The financial reality at Amazon.com, Inc. is one of staggering capital intensity. The company spent $203 billion on CapEx over the trailing twelve months, which represents roughly 25.4% of its revenue. To put that in perspective, Microsoft (MSFT) and Alphabet (GOOGL) operate with significantly higher operating margins (49.8% and 31.8% respectively) compared to Amazon’s 13.9%. However, Amazon’s forward P/E of 24.4x actually looks disciplined when compared to Walmart (WMT), which trades at a lofty 40.0x forward multiple despite much slower 5.9% growth. The bull case here is that Amazon is building the physical and digital infrastructure that will be impossible to replicate, even if it means running a negative FCF spread of -6.10% against the 10-Year Treasury in the short term.
From a market structure perspective, the plumbing is currently skewed toward the bulls. The Put/Call Open Interest ratio of 0.51 indicates a heavy speculative call bias. There is a massive Call Wall at $270, which acted as a ceiling recently but is now being tested in the pre-market. If Amazon.com, Inc. can clear and hold $270, dealers will be forced to buy the underlying stock to hedge their short call positions, potentially creating a mechanical gamma squeeze toward the next wall at $275. Conversely, the Max Pain strike sits at $260, suggesting that if momentum stalls, there is a magnetic pull downward as options approach expiration. With an expected 30-day move of +/- 3.58%, the market is pricing in a relatively stable climb rather than a volatile breakout.
The tension between Wall Street’s index-mandated “Strong Buy” and our fundamental audit lies in the cash flow. Wall Street analysts cannot afford to be underweight a stock that makes up 5.2% of the S&P 500 without risking their careers. We, however, note that after accounting for $19.47B in stock-based compensation, the real economic free cash flow is deeply negative. Yet, the high ROIC of 10.89% remains above the 8.5% WACC, suggesting that the $203B in CapEx is still creating marginal value. In a world where growth is scarce, the market is happy to pay for the treadmill as long as the speed keeps increasing.
AllWallSt Investment Verdict: BUY
Amazon.com, Inc. (AMZN)
Trailing P/E
Marcus Wolfe Screen
Leverage Profile
30D Channel
Pristine cash flow conversion (1.80x) and healthy accrual ratio (-7.56%). Zero accounting anomalies detected (LOW ANOMALY RISK).
Prudent Leverage (1.04x Net Debt/EBITDA); well within investment-grade covenant headroom.
Negative yield spread (-6.10% vs 5.10% Treasury); equity requires robust multiple expansion or growth.
Max Pain: $260.00 (-2.27%) | P/C Ratio: 0.51 | 30D Channel: $256.51 – $275.55. Dealer gamma bounded between $265 Put Wall and $270 Call Wall.
AMZN commands a massive ~5.2% S&P 500 benchmark footprint. Wall Street sell-side consensus reflects structural career-risk defense: institutional funds face severe benchmark tracking penalties for underweighting mega-cap heavyweights, forcing mandatory allocations regardless of current Free Cash Flow yield.
$259.70 – $270.30 (Options Support Pinning)
Sustained weekly close below $265.00 (Put Wall) or gross margin compression below 51.37%.
Sources & References
Regulatory Disclaimer: This report is for informational purposes only and does not constitute investment, legal, or tax advice. AllWallSt and its analysts are not registered investment advisors. The data provided is sourced from primary regulatory filings and market feeds deemed reliable but not guaranteed for accuracy. Equity investing involves substantial risk, including the potential loss of principal. Past performance is not indicative of future results. Always consult with a qualified financial professional before making any investment decisions. AllWallSt may hold positions in the securities mentioned.