
⚡ Executive Morning Takeaways
- Overnight Futures & Rates Impulse: Equity futures are showing a tentative recovery with E-Mini Nasdaq 100 (NQ=F) up 0.84 percent, though this follows a bruising session for the cash indices. The 10-Year Treasury yield remains the gravitational center at 4.93 percent, keeping the pressure on high-duration equity multiples.
- Sector Rotation Leaders & Laggards: Institutional capital is aggressively retreating into defensive and value silos. Energy (XLE) and Consumer Staples (XLP) are leading the pack, while Technology (XLK) has plummeted nearly 4.9 percent as investors re-evaluate the cost of growth in a 5 percent rate environment.
- Primary Corporate Catalyst: Apple Inc. (AAPL) reports earnings today with a massive $113.35 billion revenue consensus. The options market is heavily skewed toward protection with a 2.33 Put/Call ratio, suggesting a market braced for volatility but primed for a mechanical squeeze if results satisfy the “Max Pain” magnet at $345.
🌐 Pre-Market Macro, Futures & Rates Dashboard
| Asset / Benchmark | Ticker | Current Price / Level | Change (%) | 52-Week Low | 52-Week High |
|---|---|---|---|---|---|
| E-Mini S&P 500 Futures (ES=F) | ES=F | $7654.75 | +0.54% | $6353.25 | $7897.50 |
| E-Mini Nasdaq 100 Futures (NQ=F) | NQ=F | $28775.00 | +0.84% | $22961.50 | $31616.50 |
| S&P 500 (SPY) | SPY | $755.72 | -1.77% | $629.28 | $781.62 |
| Nasdaq 100 (QQQ) | QQQ | $690.49 | -3.47% | $555.60 | $762.86 |
| Russell 2000 (IWM) | IWM | $279.33 | -1.65% | $228.90 | $305.18 |
| 20+ Year Treasury (TLT) | TLT | $81.84 | +0.43% | $76.43 | $90.86 |
| High Yield Corporate (HYG) | HYG | $77.43 | -0.19% | $76.39 | $81.24 |
| Gold (GLD) | GLD | $355.78 | -3.47% | $354.67 | $509.70 |
| WTI Crude Oil (CL=F) | CL=F | $99.31/bbl | -4.62% | $54.98 | $119.48 |
| US Dollar Index Bullish (UUP) | UUP | $29.00 | -0.14% | $26.40 | $29.25 |
| CBOE Volatility Index (^VIX) | ^VIX | 18.92 | -2.57% | 13.38 | 35.30 |
| 2-Yr US Treasury Yield (2YY=F) | 2YY=F | 4.75% | +0.00% | 3.38% | 4.88% |
| 10-Yr US Treasury Yield (^TNX) | ^TNX | 4.93% | -1.20% | 3.96% | 5.36% |
The macro environment is currently defined by a stark divergence between equity futures and the underlying cash market’s recent performance. While the NQ=F is bouncing, the 10-Year Treasury yield at 4.93 percent continues to act as a restrictive ceiling for valuations. When risk-free sovereign debt offers nearly 5 percent, the equity risk premium for the broader S&P 500 becomes uncomfortably thin.
Volatility, as measured by the VIX, has moderated slightly to 18.92, but remains elevated compared to the summer doldrums. The weakness in Gold (GLD) and Crude Oil (CL=F) suggests a cooling of immediate geopolitical risk premiums, yet the persistent strength in the US Dollar Index (UUP) indicates that global liquidity remains tight. For institutional desks, the focus is squarely on whether the 10-Year yield can stabilize below the 5 percent psychological barrier.
📊 Sector Rotation Leaders & Laggards
| Rotation Rank | Sector ETF | Ticker | Price | Change (%) | Trailing P/E | Dividend Yield | 52-Week Low | 52-Week High |
|---|---|---|---|---|---|---|---|---|
| Leader (#1) | Energy (XLE) | XLE | $70.02 | +1.91% | 19.9x | 2.48% | $43.19 | $70.15 |
| Leader (#2) | Consumer Staples (XLP) | XLP | $89.42 | +1.41% | 26.5x | 2.73% | $75.16 | $90.38 |
| Leader (#3) | Utilities (XLU) | XLU | $43.43 | +0.67% | 19.7x | 3.07% | $39.03 | $47.80 |
| Laggard (#8) | Communication Services (XLC) | XLC | $99.90 | -1.29% | 14.7x | 1.24% | $99.33 | $120.41 |
| Laggard (#9) | Industrials (XLI) | XLI | $167.40 | -1.60% | 27.5x | 1.13% | $147.14 | $188.19 |
| Laggard (#10) | Technology (XLK) | XLK | $179.51 | -4.89% | 29.4x | 0.43% | $126.68 | $203.25 |
The sector rotation table reveals a classic defensive posture. Capital is migrating toward the “bond proxies” and inflation hedges: Energy, Staples, and Utilities are the only sectors showing positive momentum. The 3.07 percent yield in Utilities (XLU) is finally starting to look competitive as growth-oriented tech multiples undergo a necessary reset.
Technology (XLK) is the clear laggard, down nearly 5 percent. This is not necessarily a reflection of poor operational performance, but rather a mathematical repricing. At a 29.4x trailing P/E, the technology sector is struggling to justify its premium when the cost of capital has tripled over the last two years. The rotation into Staples (XLP) at a 26.5x multiple suggests that even within “safety,” investors are paying a hefty price for earnings stability.
📅 Today’s Earnings & Economic Radar
Imminent Corporate Earnings Releases
| Company / Ticker | Timing | Consensus EPS | Consensus Revenue | Key Strategic Theme |
|---|---|---|---|---|
| Apple (AAPL) | Today (AMC) | $1.99 | $113.35B | iPhone Upgrade Cycle, Services Gross Margin & China Share |
| Advanced Micro Devices (AMD) | Tomorrow (BMO) | $1.94 | $13.09B | MI300/MI400 Data-Center GPU Ramp vs Client PC Mix |
| Pfizer (PFE) | Tomorrow (BMO) | $0.73 | $15.88B | Oncology Seagen Integration & Post-COVID Cost Realignment |
| Amgen (AMGN) | Tomorrow (BMO) | $5.78 | $10.07B | MariTide Obesity Pipeline Readouts & Horizon Rare Disease Mix |
| Qualcomm (QCOM) | 2026-11-04 (AMC) | $2.16 | $10.15B | Handset Licensing Royalties & Automotive Snapdragon Pipeline |
High-Impact Economic Data & Central Bank Actions
| Time (ET) | Event | Impact | Key Institutional Focus |
|---|---|---|---|
| 09:45 AM | S&P Global US Final Manufacturing PMI | HIGH | New Orders vs Inventory Build |
| 10:00 AM | ISM Manufacturing PMI & Prices Paid | CRITICAL | Industrial Expansion Threshold (50.0) |
| 11:30 AM | US 3-Month & 6-Month Treasury Bill Auctions | MEDIUM | Front-End Bill Demand & Bid-to-Cover |
The 10:00 AM ISM Manufacturing print is the critical macro hurdle today. Markets are looking for signs of industrial stabilization, but the “Prices Paid” component will be scrutinized for any resurgence in inflationary pressure that might embolden a hawkish Fed.
🎯 Pre-Market Spotlight: Apple Inc. (AAPL)
Apple Inc. (AAPL) is currently the most expensive social safety net in the financial world. With a market capitalization exceeding $5 trillion, the company has transcended its status as a consumer electronics firm to become a mandatory sovereign-wealth-like allocation for every index-tracking fund on the planet. This “Benchmark Gravity” creates a floor under the share price that often defies traditional fundamental logic. While Wall Street sell-side analysts maintain a career-defending “Strong Buy” consensus, the cold reality of the cash flow statement suggests a more nuanced story.
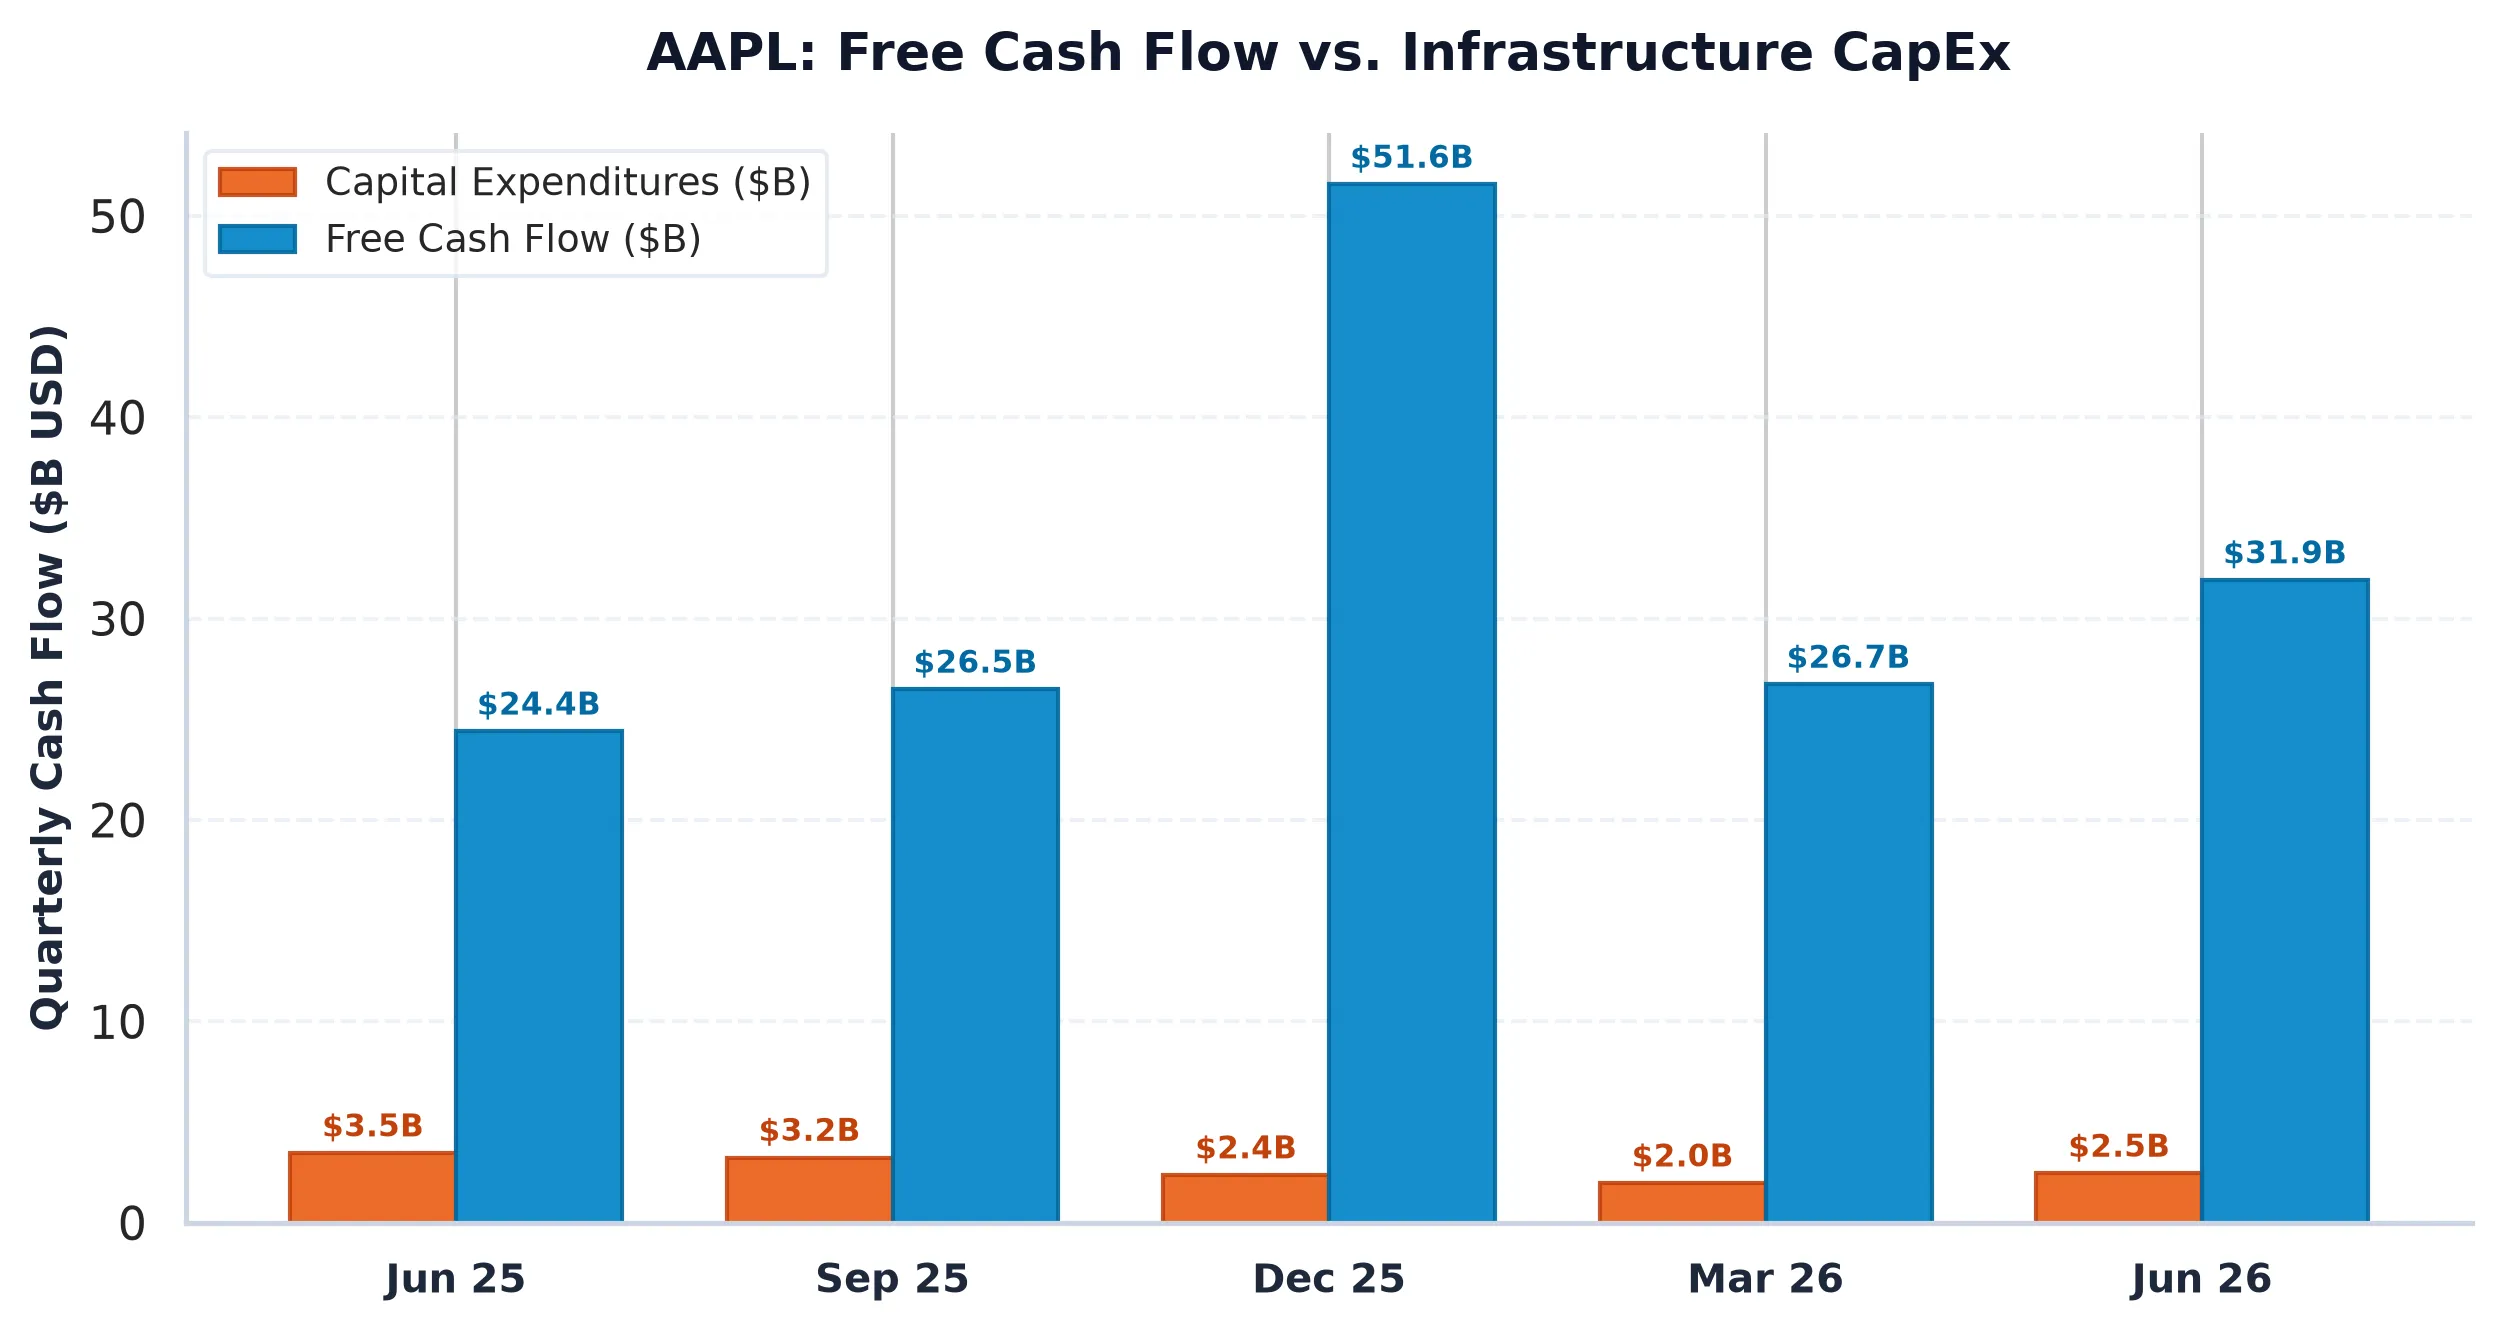
At a current price of $344.63, Apple trades at a forward P/E of 36.1x. For context, Alphabet (GOOGL) trades at 18.4x and Microsoft (MSFT) at 21.6x. Apple is significantly more expensive than its hyperscaler peers despite having lower revenue growth than Alphabet. The company’s Free Cash Flow (FCF) yield of 2.14 percent is particularly striking when compared to the risk-free 10-Year Treasury yield of 4.93 percent. This creates a negative spread of -2.79 percent, meaning investors are effectively paying for the privilege of owning Apple hardware while accepting a yield far below what they could receive from holding government debt.
The options market structure for today’s earnings release is fascinating. We are seeing an incredibly defensive Put/Call Open Interest ratio of 2.33, which is high even for a company of Apple’s size. Institutional managers are clearly paying up for downside protection. However, the “Max Pain” strike is pinned almost exactly at spot: $345.00. Historically, this setup often leads to a mechanical “vanna” rally if the earnings are merely “fine.” As implied volatility crushes after the announcement, dealers who are long puts as hedges will be forced to sell those puts and buy back the underlying stock, providing a structural tailwind regardless of whether the iPhone 16 cycle is a “super” or just “adequate” cycle.
Our audit of the recent SEC filings shows a company that is masterfully managing its capital structure. Apple spent $90.71 billion on share repurchases over the last twelve months, but after accounting for $12.86 billion in Stock-Based Compensation (SBC), the “Real” FCF yield drops to 1.89 percent. When we last reviewed Apple 21 days ago at $339.27, we argued that the “Apple Intelligence” narrative was already fully priced into the 30x+ multiple. At $344.63, the valuation has only become more stretched. While the company’s ROIC of 93 percent is world-class, the lack of an equity risk premium makes it difficult to justify an upgrade. We remain disciplined, waiting for a more attractive entry point that respects the current 5 percent cost of capital regime.
AllWallSt Investment Verdict: REAFFIRMING HOLD
Apple Inc. (AAPL)
Trailing P/E
Marcus Wolfe Screen
Leverage Profile
30D Channel
Pristine cash flow conversion (1.00x) and healthy accrual ratio (0.15%). Zero accounting anomalies detected (LOW ANOMALY RISK).
Prudent Leverage (0.13x Net Debt/EBITDA); well within investment-grade covenant headroom.
Negative yield spread (-2.79% vs 5.10% Treasury); equity requires robust multiple expansion or growth.
Max Pain: $345.00 (+0.11%) | P/C Ratio: 2.33 | 30D Channel: $332.29 – $356.97. Dealer gamma bounded between $320 Put Wall and $355 Call Wall.
AAPL commands a massive ~9.1% S&P 500 benchmark footprint. Wall Street sell-side consensus reflects structural career-risk defense: institutional funds face severe benchmark tracking penalties for underweighting mega-cap heavyweights, forcing mandatory allocations regardless of current Free Cash Flow yield.
$313.60 – $326.40 (Options Support Pinning)
Sustained weekly close below $320.00 (Put Wall) or gross margin compression below 48.65%.
Sources & References
- Official SEC Form 10-Q Quarterly Report (Filed 2026-07-31)
- Apple Inc. Investor Relations
- SEC EDGAR: Apple Inc. (CIK 0000320193)
- Primary Source: Apple Form 10-K (Filed 2025-10-31)
Regulatory Disclaimer: This report is for informational purposes only and does not constitute investment advice, financial analysis, or a recommendation regarding any securities. AllWallSt is a financial journalism outlet, and our analysts are not registered investment advisors. Equities, particularly in the technology sector, carry significant risk. Past performance is not indicative of future results. Always consult with a certified financial professional before making capital allocation decisions. All data is sourced from primary SEC filings and exchange feeds; however, market conditions can change rapidly.