
⚡ Executive Morning Takeaways
- Overnight Futures & Rates Impulse: E-Mini Nasdaq futures are leading the decline with a 0.78% drop as the 10-Year Treasury yield holds firm at 5.15%. This elevated rate regime continues to pressure high-duration equities, forcing a defensive posture across the pre-market session.
- Sector Rotation Leaders & Laggards: Capital is aggressively retreating from Technology (XLK), which is down 2.01%, and seeking shelter in Consumer Staples (XLP) and Communication Services (XLC). This rotation suggests institutional desks are prioritizing cash flow stability and lower valuation multiples over pure growth.
- Primary Corporate Catalyst: The Walt Disney Company (DIS) is in the spotlight following reports of imminent job cuts directed by new CEO Josh D’Amaro. The move appears to be a strategic cost-containment effort designed to protect margins ahead of the November 17 earnings release.
🌐 Pre-Market Macro, Futures & Rates Dashboard
| Asset / Benchmark | Ticker | Current Price / Level | Change (%) | 52-Week Low | 52-Week High |
|---|---|---|---|---|---|
| E-Mini S&P 500 Futures (ES=F) | ES=F | $7560.75 | -0.29% | $6353.25 | $7897.50 |
| E-Mini Nasdaq 100 Futures (NQ=F) | NQ=F | $27816.50 | -0.78% | $22961.50 | $31616.50 |
| S&P 500 (SPY) | SPY | $754.37 | -0.36% | $629.28 | $781.62 |
| Nasdaq 100 (QQQ) | QQQ | $679.89 | -1.20% | $555.60 | $762.86 |
| Russell 2000 (IWM) | IWM | $277.54 | -0.32% | $228.90 | $305.18 |
| 20+ Year Treasury (TLT) | TLT | $79.38 | -0.43% | $76.43 | $90.86 |
| High Yield Corporate (HYG) | HYG | $76.94 | -0.05% | $76.39 | $81.24 |
| Gold (GLD) | GLD | $355.45 | +0.16% | $352.91 | $509.70 |
| WTI Crude Oil (CL=F) | CL=F | $88.17/bbl | -0.44% | $54.98 | $119.48 |
| US Dollar Index Bullish (UUP) | UUP | $29.50 | +0.27% | $26.40 | $29.50 |
| CBOE Volatility Index (^VIX) | ^VIX | 20.06 | +3.94% | 13.38 | 35.30 |
| 2-Yr US Treasury Yield (2YY=F) | 2YY=F | 4.75% | +0.00% | 3.38% | 4.88% |
| 10-Yr US Treasury Yield (^TNX) | ^TNX | 5.15% | +1.00% | 3.96% | 5.36% |
The macro environment this morning is defined by a widening disconnect between equity valuations and the sovereign cost of debt. With the 10-Year Treasury yield standing at 5.15%, the equity risk premium has effectively vanished for many large-cap names. When the risk-free rate is this high, a stock needs to offer either exceptional growth or a significant valuation cushion to justify institutional allocation.
The VIX climbing toward 20 indicates that the period of summer complacency has officially ended. As the dollar index (UUP) hits a 52-week high of $29.50, global liquidity is tightening, which typically acts as a headwind for multinationals that report earnings in dollars but collect revenue in depreciating foreign currencies.
📊 Sector Rotation Leaders & Laggards
| Rotation Rank | Sector ETF | Ticker | Price | Change (%) | Trailing P/E | Dividend Yield | 52-Week Low | 52-Week High |
|---|---|---|---|---|---|---|---|---|
| Leader (#1) | Consumer Staples (XLP) | XLP | $92.35 | +1.42% | 24.9x | 2.46% | $76.23 | $93.40 |
| Leader (#2) | Communication Services (XLC) | XLC | $108.69 | +1.05% | 17.3x | 1.38% | $99.33 | $120.41 |
| Leader (#3) | Energy (XLE) | XLE | $64.96 | +0.98% | 16.2x | 2.18% | $43.77 | $70.15 |
| Laggard (#8) | Industrials (XLI) | XLI | $168.78 | -0.39% | 27.1x | 1.13% | $147.14 | $188.19 |
| Laggard (#9) | Consumer Discretionary (XLY) | XLY | $119.98 | -0.40% | 25.1x | 0.81% | $105.19 | $125.01 |
| Laggard (#10) | Technology (XLK) | XLK | $170.28 | -2.01% | 30.0x | 0.47% | $126.68 | $203.25 |
We are witnessing a classic flight to value. The Technology sector (XLK) is trading at 30 times earnings while offering a negligible 0.47% dividend yield, making it an easy target for profit-taking in a rising rate environment. Conversely, Communication Services (XLC) is leading the charge with a more palatable 17.3x multiple, providing a valuation floor that high-growth tech currently lacks.
This rotation into Energy and Staples suggests that fund managers are bracing for a period of lower realized growth. When the market leaders shift from software to soap and oil, it signals that the institutional appetite for “growth at any price” has been replaced by a mandate for “cash flow at a reasonable price.”
⏱️ Today’s Earnings & Economic Radar
Imminent Corporate Earnings Releases
| Company / Ticker | Timing | Consensus EPS | Consensus Revenue | Key Strategic Theme |
|---|---|---|---|---|
| Walt Disney (DIS) | Tomorrow (Nov 17) | $1.68 | $25.16B | Direct-to-Consumer Streaming Operating Income & Parks DTC Demand |
| Home Depot (HD) | Tomorrow (Nov 17) | $3.84 | $42.78B | Pro-Contractor Backlog vs High-Rate Big-Ticket Remodeling |
| NVIDIA (NVDA) | Tomorrow (Nov 17) | $2.47 | $108.73B | Blackwell/Rubin Rack Shipments & Hyperscaler Gross Margin |
| Palo Alto Networks (PANW) | Nov 18 | $0.97 | $3.31B | Platformization Billings & Next-Gen Security ARR |
| Target (TGT) | Nov 18 | $2.07 | $26.53B | Discretionary Apparel/Home Basket Size & Inventory Shrink |
High-Impact Economic Data & Central Bank Actions
| Time (ET) | Event | Impact | Key Institutional Focus |
|---|---|---|---|
| 08:30 AM | NY Fed Empire State Manufacturing Survey | HIGH | Regional CapEx & Price Paid Diffusion |
| 10:00 AM | NAHB Housing Market Index | MEDIUM | Builder Traffic vs 7% Mortgage Rate Ceiling |
| 11:30 AM | US 3-Month & 6-Month Treasury Bill Auctions | MEDIUM | Short-Duration Liquidity Absorption |
The 11:30 AM Treasury auctions will be the primary liquidity gauge for the day. If the market struggles to absorb this short-duration paper, expect another leg up in yields and further pressure on equity futures heading into the cash close.
🎯 Pre-Market Spotlight: The Walt Disney Company (DIS)
The Walt Disney Company (DIS) enters the week with a sense of urgency that only a new CEO and a looming earnings report can provide. Reports that Josh D’Amaro is planning thousands of job cuts suggest that the magic of the Magic Kingdom is currently being measured in basis points of operating margin. For a company that has spent the last three years trying to convince the market that its streaming business is a viable profit engine rather than a burning pile of cash, these cuts are a signal of institutional discipline.
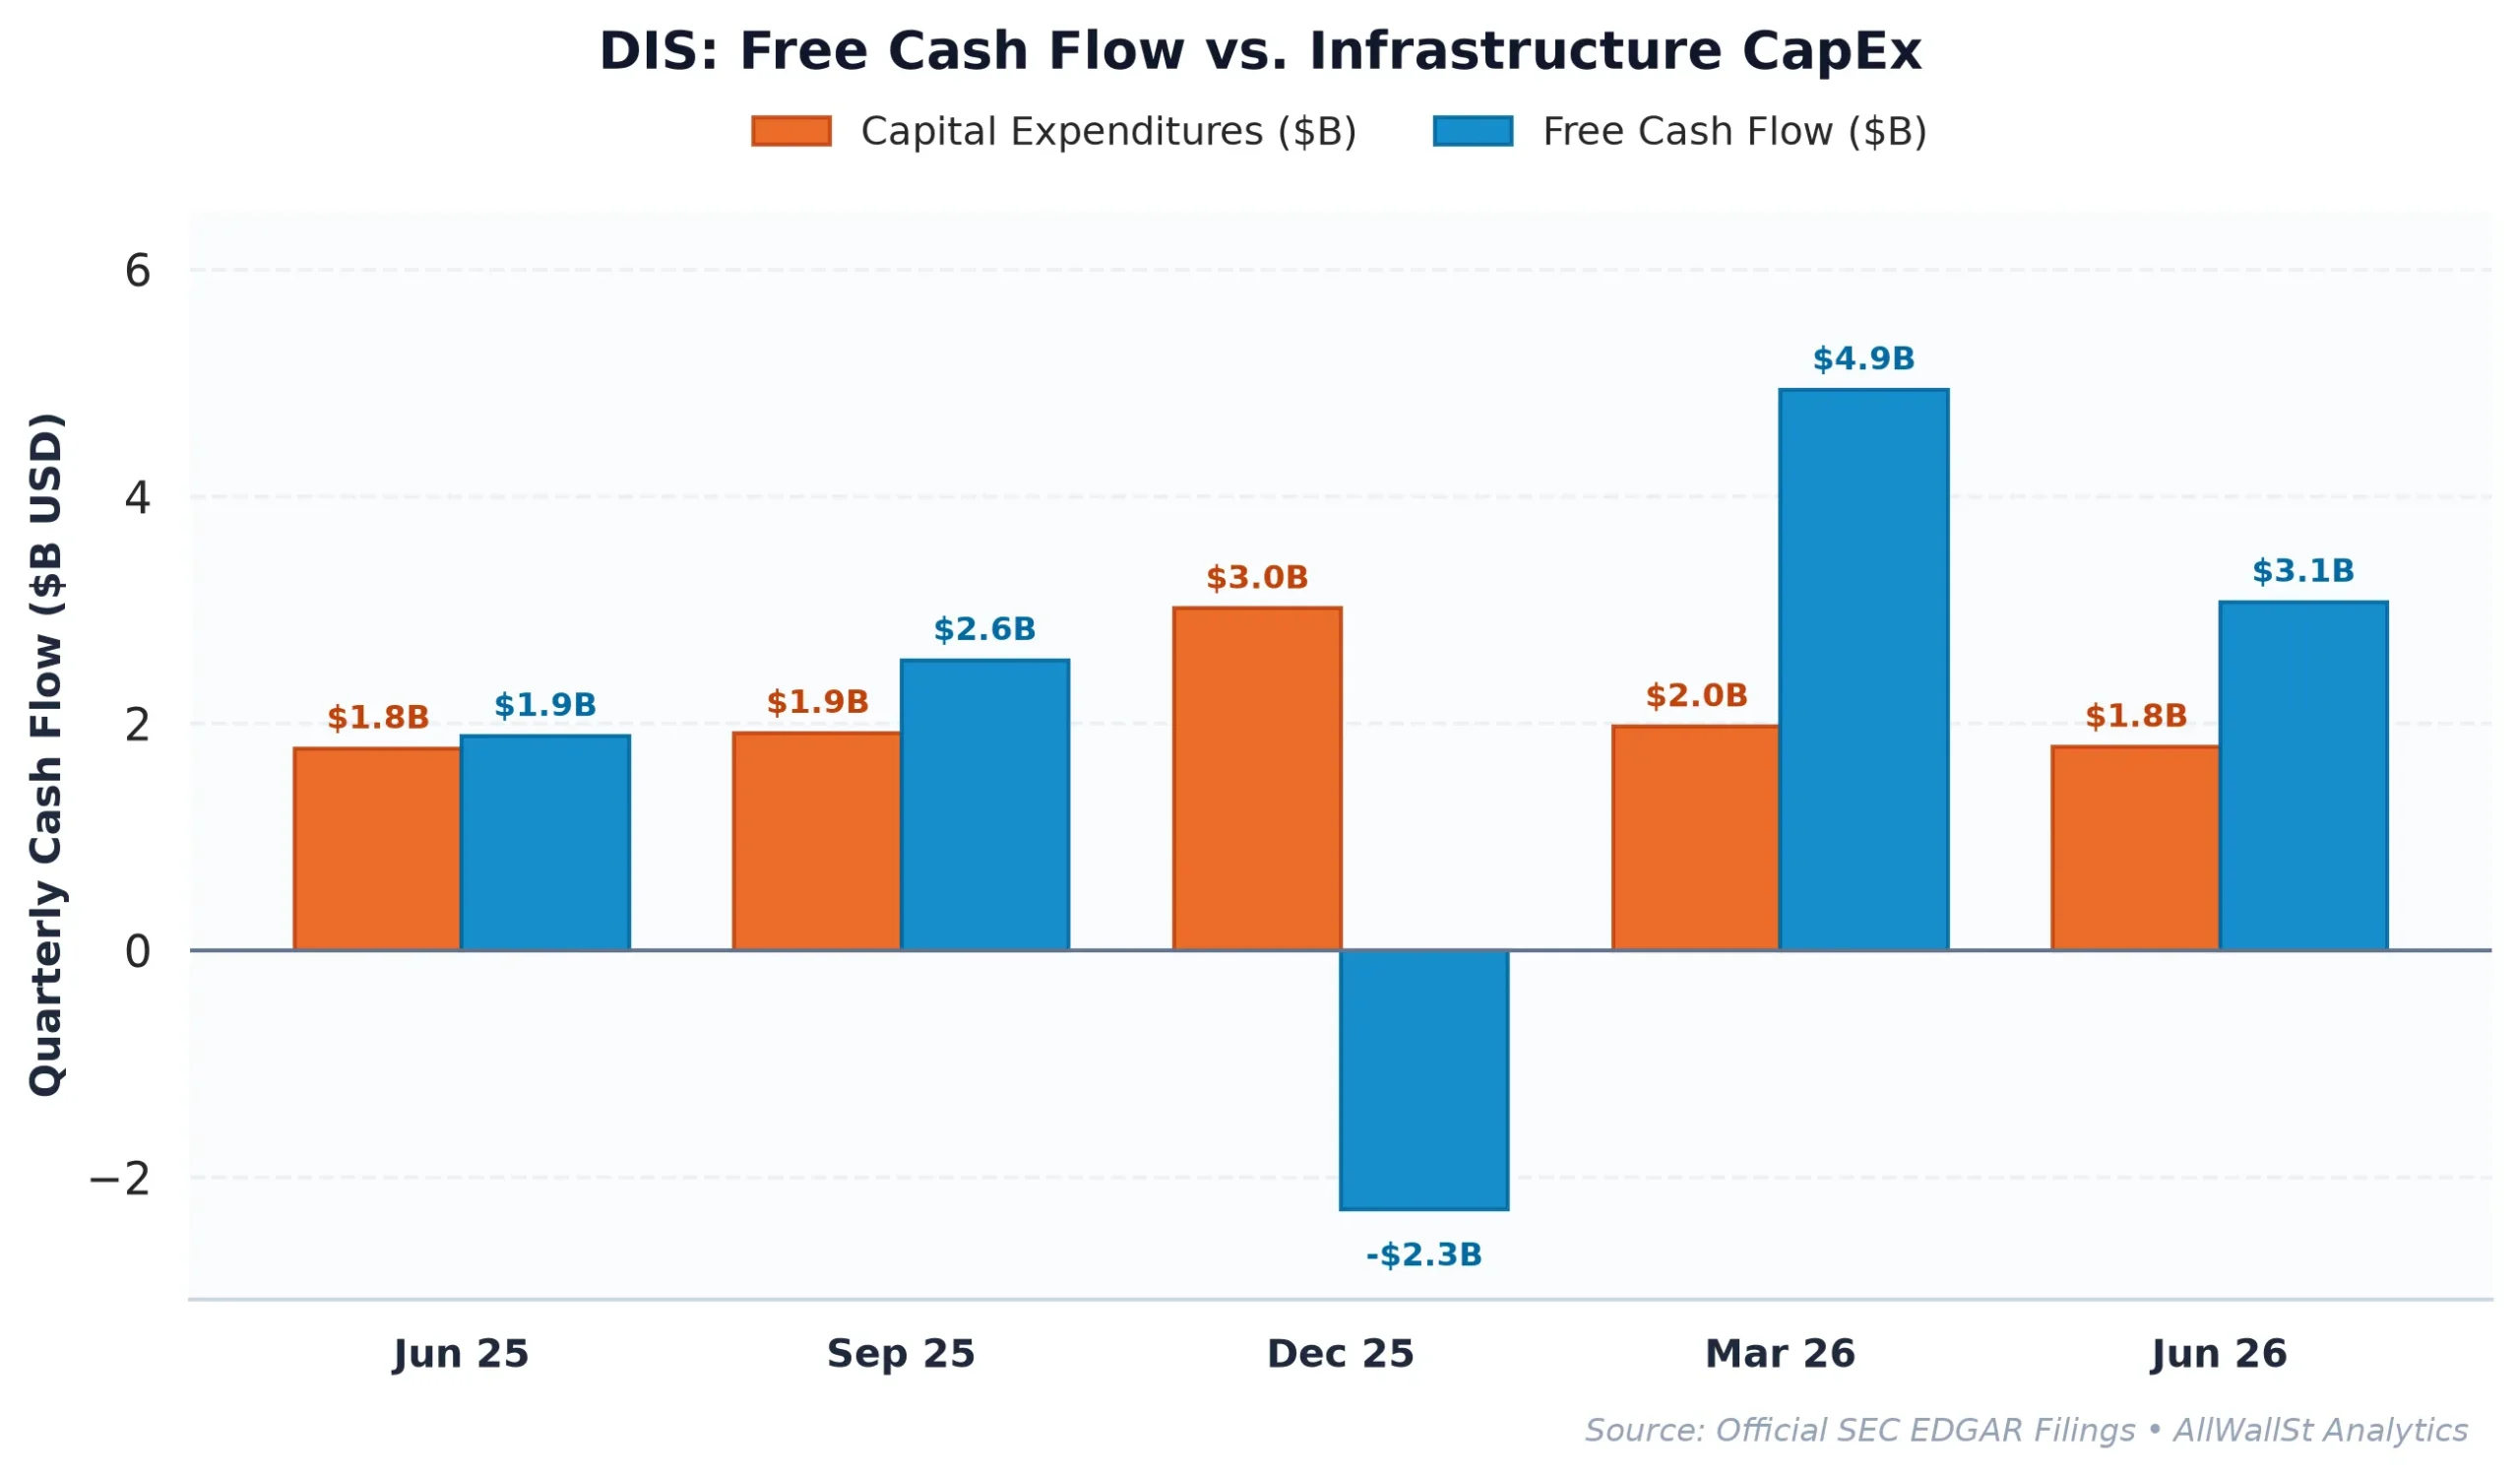
From a fundamental perspective, Disney is trading at a forward P/E of 15.9x, which looks like a bargain compared to the broader market and certainly compared to the 21.7x multiple of Microsoft (MSFT). However, the math gets complicated when you look at the free cash flow yield. At 2.37%, Disney’s cash return is less than half of the 5.15% you can get from a 10-Year Treasury. In institutional terms, this is a negative equity risk premium spread of 2.79%. You are essentially paying a premium for the privilege of owning Mickey Mouse over the US government, which requires a high degree of confidence in Disney’s ability to compound earnings from here.
The options market structure for Disney is currently balanced but carries a heavy technical anchor. Max Pain sits at $80.00, a staggering 32.76% below the current price of $118.97. While this does not mean the stock is headed to $80 tomorrow, it suggests that the massive pile of open interest in downside puts is creating a structural floor that dealers must defend. Near-term resistance is clustered around the $119 and $120 strikes, meaning any pre-earnings rally will likely face a “call wall” where dealers sell shares to hedge their upside exposure, pinning the price into the Tuesday release.
Despite the macro headwinds, Disney’s multi-year trajectory shows a steady climb in operating margins, from 8.2% in FY2022 to 14.6% in FY2025. The job cuts reported today are simply the latest lever to push that margin higher. Compared to peers like Alphabet (GOOGL), which boasts a 33.3% operating margin, Disney has significant room for “efficiency gains.” If D’Amaro can bridge even half of that margin gap, the 15.9x forward multiple will look increasingly misplaced.
Investment Committee Steelman Dissent: The bear case rests on the fact that Disney’s ROIC of 8.09% still sits below its weighted average cost of capital (WACC) of roughly 8.5%, meaning the company is technically destroying economic value on its latest investments. If the job cuts fail to produce a meaningful inflection in the Direct-to-Consumer segment’s profitability, the stock faces a violent mean-reversion toward the $80 Max Pain strike as dealer support evaporates.
AllWallSt Investment Verdict: BUY (Pre-Earnings Position)
The Walt Disney Company (DIS)
Trailing P/E
Marcus Wolfe Screen
Leverage Profile
30D Channel
Dealer Gamma Pinning & Max Pain Alignment (DIS)
🎯 Max Pain: $80.00
Spot $118.97
Ceiling $119C Resistance ▲
Pristine cash flow conversion (1.46x) and healthy accrual ratio (-2.88%). Zero accounting anomalies detected (LOW ANOMALY RISK).
Prudent Leverage (1.95x Net Debt/EBITDA); well within investment-grade covenant headroom.
Negative yield spread (-2.79% vs 5.15% Treasury); equity requires robust multiple expansion or growth.
Max Pain: $80.00 (-32.76%) | P/C Ratio: 1.0 | 30D Channel: $111.71 – $126.23. Dealer gamma bounded between $118 Put Wall and $119 Call Wall.
DIS carries standard index weighting (< 0.6% SPY footprint); sell-side consensus reflects standard earnings momentum rather than index-tracking mandates.
$115.64 – $120.36 (Options Support Pinning)
Sustained weekly close below $118.00 (Put Wall) or gross margin compression below 37.59%.
Bearish IC Dissent: At 24.5x trailing earnings and 2.37% FCF yield against a 5.15% 10-year risk-free hurdle, The Walt Disney Company (DIS) leaves thin margin for top-line deceleration or margin compression (1.95x Net Debt/EBITDA). If institutional flows break below the $118 put wall, dealer de-hedging can accelerate multiple contraction before fundamental buyers step in.
Sources & References
- SEC Form 8-K Primary Filing Body (2026-03-20)
- SEC Form 8-K Exhibit 99.1 (Press Release / Earnings) (2026-08-05)
- SEC SCHEDULE 13D/A Beneficial Ownership Disclosure (2026-03-20)
- SEC DEF 14A Proxy / M&A Filing (2026-01-22)
- Federal Register (2026-09-18): Self-Regulatory Organizations; NYSE Arca, Inc.; Notice of Filing of a Propo
- Federal Register (2026-09-18): Self-Regulatory Organizations; NYSE American LLC; Notice of Filing of a Pro
- SEC EDGAR Search for The Walt Disney Company: https://www.sec.gov/edgar/browse/?CIK=0001744489
- Disney Investor Relations: https://thewaltdisneycompany.com
- SEC Form 10-K (Annual Report): https://www.sec.gov/Archives/edgar/data/1744489/000174448925000155/dis-20250927.htm
- SEC Form 10-Q (Quarterly Report): https://www.sec.gov/Archives/edgar/data/1744489/000174448926000057/dis-20260627.htm
Regulatory Disclaimer: This report is for informational purposes only and does not constitute investment, legal, or tax advice. AllWallSt is a financial journalism organization, not a registered investment advisor. Investing in equities involves substantial risk, including the loss of principal. Past performance is not indicative of future results. Information provided is sourced from primary SEC filings and market data feeds believed to be reliable but not guaranteed for accuracy or completeness. Always consult with a qualified financial professional before making investment decisions. Standardized verdicts represent the AllWallSt Quantitative Desk conviction at the time of publication and are subject to change based on market conditions.