
⚡ Executive Morning Takeaways
- Overnight Futures & Rates Impulse: E-Mini Nasdaq futures (NQ=F) are leading the pre-market bounce with a 1.26 percent gain, while the 10-Year Treasury yield softens slightly to 4.84 percent, providing a temporary reprieve for high-duration equity multiples.
- Sector Rotation Leaders & Laggards: Capital is seeking shelter in defensive pockets like Communication Services (XLC) and Utilities (XLU), while the Technology sector (XLK) remains the primary laggard, down 8.00 percent as the market re-prices the cost of AI infrastructure.
- Primary Corporate Catalyst: Microsoft Corporation (MSFT) is under pressure in the extended session, trading down 1.37 percent to 528.60 dollars as investors digest a massive 192.88 billion dollar CapEx bill that has effectively neutralized near-term free cash flow.
🌐 Pre-Market Macro, Futures & Rates Dashboard
| Asset / Benchmark | Ticker | Current Price / Level | Change (%) | 52-Week Low | 52-Week High |
|---|---|---|---|---|---|
| E-Mini S&P 500 Futures (ES=F) | ES=F | $7398.75 | +0.21% | $6353.25 | $7897.50 |
| E-Mini Nasdaq 100 Futures (NQ=F) | NQ=F | $27089.25 | +1.26% | $22961.50 | $31616.50 |
| S&P 500 (SPY) | SPY | $733.00 | -4.41% | $629.28 | $781.62 |
| Nasdaq 100 (QQQ) | QQQ | $647.05 | -6.49% | $555.60 | $762.86 |
| Russell 2000 (IWM) | IWM | $270.98 | -4.59% | $228.90 | $305.18 |
| 20+ Year Treasury (TLT) | TLT | $81.93 | +0.21% | $76.43 | $90.86 |
| High Yield Corporate (HYG) | HYG | $77.28 | -0.31% | $76.39 | $81.24 |
| Gold (GLD) | GLD | $375.49 | +0.81% | $354.67 | $509.70 |
| WTI Crude Oil (CL=F) | CL=F | $90.96/bbl | +0.49% | $54.98 | $119.48 |
| US Dollar Index Bullish (UUP) | UUP | $28.92 | +0.07% | $26.40 | $29.25 |
| CBOE Volatility Index (^VIX) | ^VIX | 26.73 | -5.15% | 13.38 | 35.30 |
| 2-Yr US Treasury Yield (2YY=F) | 2YY=F | 4.75% | +0.00% | 3.38% | 4.88% |
| 10-Yr US Treasury Yield (^TNX) | ^TNX | 4.84% | -1.16% | 3.96% | 5.36% |
The macro environment is currently defined by a tense standoff between cooling Treasury yields and a stubbornly high volatility index. While the 1.16 percent drop in the 10-Year yield usually acts as a green light for growth stocks, the VIX remaining elevated at 26.73 suggests that institutional desks are still paying a premium for downside protection. The slight recovery in Nasdaq futures appears more like a relief bounce than a structural trend change, especially as the spread between the S&P 500 earnings yield and risk-free debt remains uncomfortably thin.
Crude oil and Gold are both ticking higher, signaling that inflationary tail risks have not been entirely extinguished. For equity investors, the 4.84 percent benchmark yield on the 10-Year Treasury remains the ultimate gravity well. Any corporation failing to generate a cash yield above this hurdle is effectively asking shareholders to subsidize their growth with hope rather than capital.
📊 Sector Rotation Leaders & Laggards
| Rotation Rank | Sector ETF | Ticker | Price | Change (%) | Trailing P/E | Dividend Yield | 52-Week Low | 52-Week High |
|---|---|---|---|---|---|---|---|---|
| Leader (#1) | Communication Services (XLC) | XLC | $104.34 | -0.59% | 16.6x | 1.38% | $99.33 | $120.41 |
| Leader (#2) | Utilities (XLU) | XLU | $43.30 | -0.71% | 17.8x | 2.79% | $39.03 | $47.80 |
| Leader (#3) | Consumer Staples (XLP) | XLP | $91.25 | -0.75% | 24.6x | 2.46% | $75.16 | $93.40 |
| Laggard (#8) | Consumer Discretionary (XLY) | XLY | $117.64 | -3.83% | 24.6x | 0.81% | $105.19 | $125.01 |
| Laggard (#9) | Industrials (XLI) | XLI | $162.47 | -4.12% | 26.1x | 1.13% | $147.14 | $188.19 |
| Laggard (#10) | Technology (XLK) | XLK | $162.38 | -8.00% | 28.6x | 0.47% | $126.68 | $203.25 |
The rotation data confirms a flight to safety. Institutional money is moving into Communication Services and Utilities, where valuations are more grounded (16.6x to 17.8x P/E) and dividend yields provide a tangible floor. The Technology sector is the clear outlier, bearing the brunt of the selling pressure with an 8 percent decline. This is a classic valuation reset: when the cost of capital stays high, the 28.6x multiple on the XLK becomes a difficult pill to swallow for managers who can get 5 percent from a Treasury bill.
Interestingly, Consumer Staples (XLP) is outperforming on a relative basis despite a high 24.6x P/E, suggesting that investors are currently prioritizing earnings stability over growth. The Industrials sector is also underperforming, likely reflecting concerns about the capital expenditure cycles that have yet to translate into bottom-line acceleration.
📅 Today’s Earnings & Economic Radar
Imminent Corporate Earnings Releases
| Company / Ticker | Timing | Consensus EPS | Consensus Revenue | Key Strategic Theme |
|---|---|---|---|---|
| Bank of America (BAC) | Reported | $1.17 | $30.68B | NII Expansion & Advisory Fees |
| Taiwan Semiconductor (TSM) | Today | $1.95 | $23.20B | AI Foundry Capacity & N2/N3 Node Ramp |
| Netflix (NFLX) | Oct 20 | $5.12 | $9.76B | Ad-Tier Penetration & Operating Margin |
High-Impact Economic Data & Central Bank Actions
| Time (ET) | Event | Impact | Key Institutional Focus |
|---|---|---|---|
| 08:30 AM | US Non-Farm Payrolls (NFP) | CRITICAL | Payroll Breakeven & Wage-Price Spiral Risk |
| 01:00 PM | Baker Hughes Rig Count | MEDIUM | Permian Basin Discipline & CapEx |
The high-stakes event this morning is the Non-Farm Payrolls print at 8:30 AM. Any sign of labor market overheating will likely send yields back toward 5 percent, further complicating the bull case for tech. Simultaneously, Taiwan Semiconductor (TSM) results will serve as the ultimate litmus test for the AI hardware narrative. If the foundry titan signals any slowdown in wafer demand, the entire hyperscaler trade could face a significant de-rating.
🎯 Pre-Market Spotlight: Microsoft Corporation (MSFT)
Microsoft Corporation (MSFT) is currently operating as the worlds most expensive construction project. In its latest quarterly disclosure, the company revealed a CapEx intensity of 55.68 percent, which translates to roughly 192.88 billion dollars spent on the physical infrastructure of the future. While Azure demand remains the primary engine of a record quarter, the immediate result for shareholders is a Free Cash Flow yield of 0.08 percent. For those keeping score at home, that is significantly less than the 4.84 percent yield offered by the 10-Year Treasury, creating a negative spread of nearly 5 percent. Essentially, investors are paying Microsoft for the privilege of watching it buy every GPU ever manufactured.
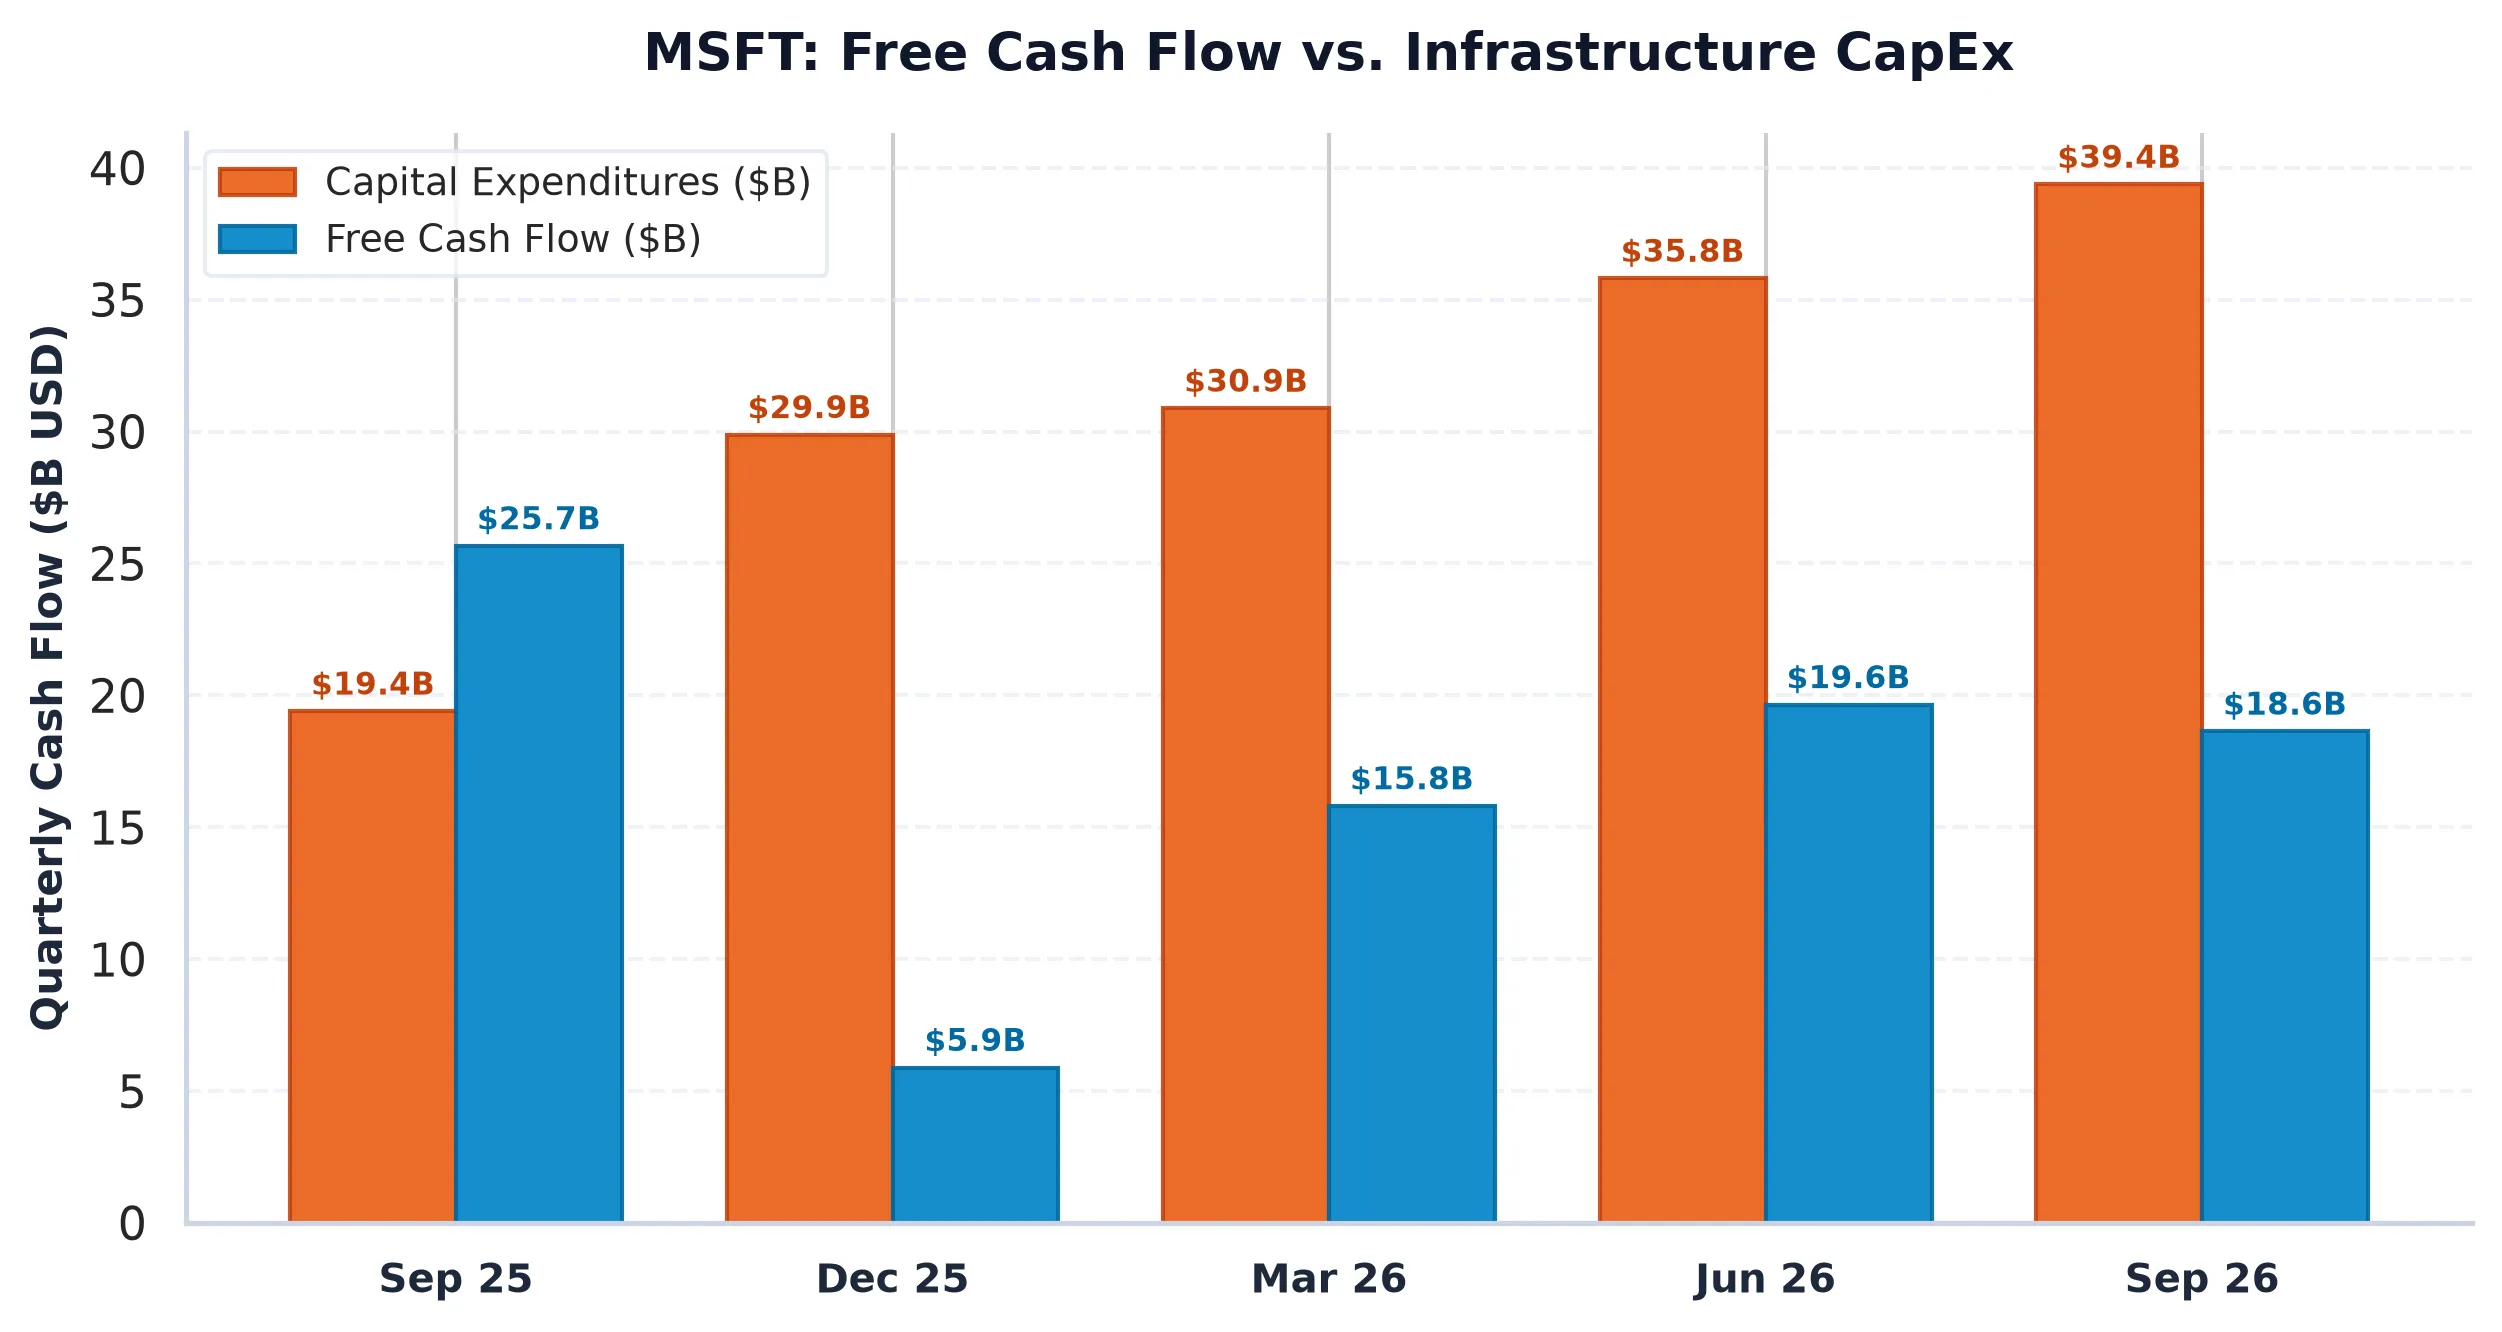
The options market is currently leaning into a speculative long skew, with heavy call concentration at the 537.50 and 540.00 strikes. However, the pre-market quote of 528.60 dollars suggests a localized air pocket. Without a clean break above those call walls, dealers who are long gamma will likely become a source of selling pressure to remain delta neutral. While Wall Street consensus remains a structural Strong Buy, largely because underweighting a 7.2 percent index heavyweight is a fireable offense for most fund managers, the fundamental reality is more nuanced. Microsoft is growing revenue at 18.8 percent, but its Rule of 40 score of 19.7 percent sits well below the elite software hurdle.
When compared to peers, the valuation looks increasingly stretched on a cash-flow basis. Alphabet (GOOGL) is growing faster at 24.7 percent and trades at a more modest 18.2x forward multiple. Oracle (ORCL), while smaller, is putting up nearly 30 percent revenue growth. Microsoft still boasts a massive 25.22 percent Return on Invested Capital, which is excellent, but as the CapEx treadmill accelerates, the lag between spending and cash return is widening. For now, the stock is pinned by its own success and the gravity of the 10-Year Treasury. We prefer to wait for a better entry point or a clearer path to FCF normalization before increasing exposure.
AllWallSt Investment Verdict: HOLD
Microsoft Corporation (MSFT)
Trailing P/E
Marcus Wolfe Screen
Leverage Profile
30D Channel
Dealer Gamma Pinning & Max Pain Alignment (MSFT)
MODERATE WATCHLIST (1 flag): Inventory growth outpaced COGS growth by >15%, signaling potential inventory bloat or pending margin compression.
Prudent Leverage (0.34x Net Debt/EBITDA); well within investment-grade covenant headroom.
Negative yield spread (-4.76% vs 5.10% Treasury); equity requires robust multiple expansion or growth.
Max Pain: $350.00 (-34.69%) | P/C Ratio: 0.0 | 30D Channel: $516.74 – $555.12. Dealer gamma bounded between $535 Put Wall and $537.5 Call Wall.
MSFT commands a massive ~7.2% S&P 500 benchmark footprint. Wall Street sell-side consensus reflects structural career-risk defense: institutional funds face severe benchmark tracking penalties for underweighting mega-cap heavyweights, forcing mandatory allocations regardless of current Free Cash Flow yield.
Accumulation Deferred (Await Pullback toward $524.30 – $545.70 Support Pinning)
Sustained weekly close below $535.00 (Put Wall) or acceleration in margin compression.
Sources & References
- Official SEC Form 10-K Annual Report (Filed 2026-07-29)
-
Microsoft Investor Relations: https://www.microsoft.com/en-us/investor
- SEC EDGAR Filings: https://www.sec.gov/edgar/browse/?CIK=0000789019
- Primary Exchange Feed (Nasdaq): https://www.nasdaq.com/market-activity/stocks/msft
Regulatory Disclaimer: This report is for information purposes only and does not constitute a recommendation to buy or sell any security. AllWallSt and its analysts are not registered investment advisors. Financial markets involve high risk: past performance is never a guarantee of future results. Always consult with a certified financial professional before making significant capital allocations.