
⚡ Executive Morning Takeaways
- Overnight Futures & Rates Impulse: Equity futures are drifting slightly higher with E-Mini Nasdaq 100 (NQ=F) up 0.13%, though the US 10-Year Treasury yield remains a formidable headwind at 5.10%, keeping the equity risk premium in negative territory.
- Sector Rotation Leaders & Laggards: Capital is seeking refuge in Energy (XLE) and Utilities (XLU) as value-oriented sectors lead, while Materials (XLB) and Communication Services (XLC) face selling pressure amid a stronger US Dollar Index (UUP).
- Primary Corporate Catalyst: Palo Alto Networks, Inc. (PANW) is surging 3.17% in pre-market trading following reports of its fastest-ever product ramp for AI security tools, though extreme call-heavy options positioning suggests a potential local top near the $330 resistance level.
🌐 Pre-Market Macro, Futures & Rates Dashboard
| Asset / Benchmark | Ticker | Current Price / Level | Change (%) | 52-Week Low | 52-Week High |
|---|---|---|---|---|---|
| E-Mini S&P 500 Futures (ES=F) | ES=F | $7630.00 | +0.19% | $6353.25 | $7897.50 |
| E-Mini Nasdaq 100 Futures (NQ=F) | NQ=F | $28420.25 | +0.13% | $22961.50 | $31616.50 |
| S&P 500 (SPY) | SPY | $757.12 | -0.35% | $629.28 | $781.62 |
| Nasdaq 100 (QQQ) | QQQ | $688.17 | -0.32% | $555.60 | $762.86 |
| Russell 2000 (IWM) | IWM | $278.44 | -1.64% | $228.90 | $305.18 |
| 20+ Year Treasury (TLT) | TLT | $79.72 | -1.48% | $76.43 | $90.86 |
| High Yield Corporate (HYG) | HYG | $76.98 | -0.48% | $76.39 | $81.24 |
| Gold (GLD) | GLD | $354.89 | -2.82% | $352.92 | $509.70 |
| WTI Crude Oil (CL=F) | CL=F | $88.21/bbl | -0.60% | $54.98 | $119.48 |
| US Dollar Index Bullish (UUP) | UUP | $29.42 | +0.24% | $26.40 | $29.44 |
| CBOE Volatility Index (^VIX) | ^VIX | 18.33 | -1.98% | 13.38 | 35.30 |
| 2-Yr US Treasury Yield (2YY=F) | 2YY=F | 4.75% | +0.00% | 3.38% | 4.88% |
| 10-Yr US Treasury Yield (^TNX) | ^TNX | 5.10% | +2.10% | 3.96% | 5.36% |
The macro environment remains a tug-of-war between resilient earnings narratives and the gravity of sovereign yields. With the 10-Year Treasury (^TNX) pushing toward 5.10%, the cost of capital has reset to a level that demands absolute perfection from high-multiple technology equities. Gold (GLD) is experiencing a sharp 2.82% liquidation, suggesting a dash for dollar liquidity as the US Dollar Index (UUP) hits new 52-week highs.
For equity investors, the negative spread between the S&P 500 earnings yield and risk-free Treasuries is at its most restrictive level in decades. This regime punishes companies that defer cash flow into the distant future. While futures are green this morning, the underlying plumbing of the credit markets (TLT and HYG) continues to signal caution as long-end yields refuse to budge.
📊 Sector Rotation Leaders & Laggards
| Rotation Rank | Sector ETF | Ticker | Price | Change (%) | Trailing P/E | Dividend Yield | 52-Week Low | 52-Week High |
|---|---|---|---|---|---|---|---|---|
| Leader (#1) | Energy (XLE) | XLE | $64.33 | +1.51% | 16.1x | 2.18% | $43.77 | $70.15 |
| Leader (#2) | Utilities (XLU) | XLU | $43.81 | -0.02% | 18.0x | 2.79% | $39.03 | $47.80 |
| Leader (#3) | Technology (XLK) | XLK | $173.77 | -0.34% | 30.6x | 0.47% | $126.68 | $203.25 |
| Laggard (#8) | Industrials (XLI) | XLI | $169.44 | -0.89% | 27.2x | 1.13% | $147.14 | $188.19 |
| Laggard (#9) | Communication Services (XLC) | XLC | $107.56 | -0.96% | 17.1x | 1.38% | $99.33 | $120.41 |
| Laggard (#10) | Materials (XLB) | XLB | $52.34 | -1.28% | 21.8x | 1.64% | $42.22 | $54.63 |
Institutional flows are currently favoring the Energy sector, which offers a combination of modest valuation (16.1x P/E) and a tangible dividend yield of 2.18%. This is a classic “inflation hedge” rotation. Utilities are also holding up as a defensive bond-proxy, despite the volatility in rates.
The Technology sector (XLK) remains the primary source of market liquidity, but its 30.6x P/E multiple is increasingly difficult to justify when compared to the 16x to 18x multiples found in Energy and Utilities. Materials (XLB) are the clear laggards this morning, suffering from the dual headwind of a surging dollar and slowing industrial demand expectations.
⏱️ Today’s Earnings & Economic Radar
Imminent Corporate Earnings Releases
| Company / Ticker | Timing | Consensus EPS | Consensus Revenue | Key Strategic Theme |
|---|---|---|---|---|
| Walt Disney (DIS) | Nov 17 | $1.69 | $25.16B | DTC Streaming Profits & Theme Park Demand |
| NVIDIA (NVDA) | Nov 17 | $2.47 | $108.81B | Blackwell Shipments & AI Data Center Capex |
| Palo Alto Networks (PANW) | Nov 18 | $0.97 | $3.31B | Platformization Billings & Next-Gen Security ARR |
High-Impact Economic Data & Central Bank Actions
| Time (ET) | Event | Impact | Key Institutional Focus |
|---|---|---|---|
| 08:30 AM | Core PCE Price Index | CRITICAL | Fed’s Preferred Inflation Gauge Trajectory |
| 10:00 AM | Univ. of Michigan Sentiment | HIGH | Consumer Inflation Expectations |
| 01:00 PM | Baker Hughes Rig Count | MEDIUM | Weekly Options Dealer Gamma Unwind |
The 08:30 AM Core PCE print is the singular focal point for the morning. Any upside surprise in inflation will likely send the 10-Year yield toward 5.25%, which would be a catastrophic outcome for high-multiple software stocks currently priced for a soft landing.
🎯 Pre-Market Spotlight: Palo Alto Networks, Inc. (PANW)
Palo Alto Networks, Inc. (PANW) is currently the poster child for the “AI ramp” narrative, jumping over 3% in pre-market trading to $332.90 after reports surfaced that its new security tools are ramping faster than any product in the company’s history. This is the kind of headline that makes growth investors feel warm and fuzzy, but the actual mechanics of the business suggest a different story. When you look at the balance sheet, you realize that the company is essentially a giant machine that converts shareholder equity into employee compensation, with a little bit of cybersecurity left over for the customers.
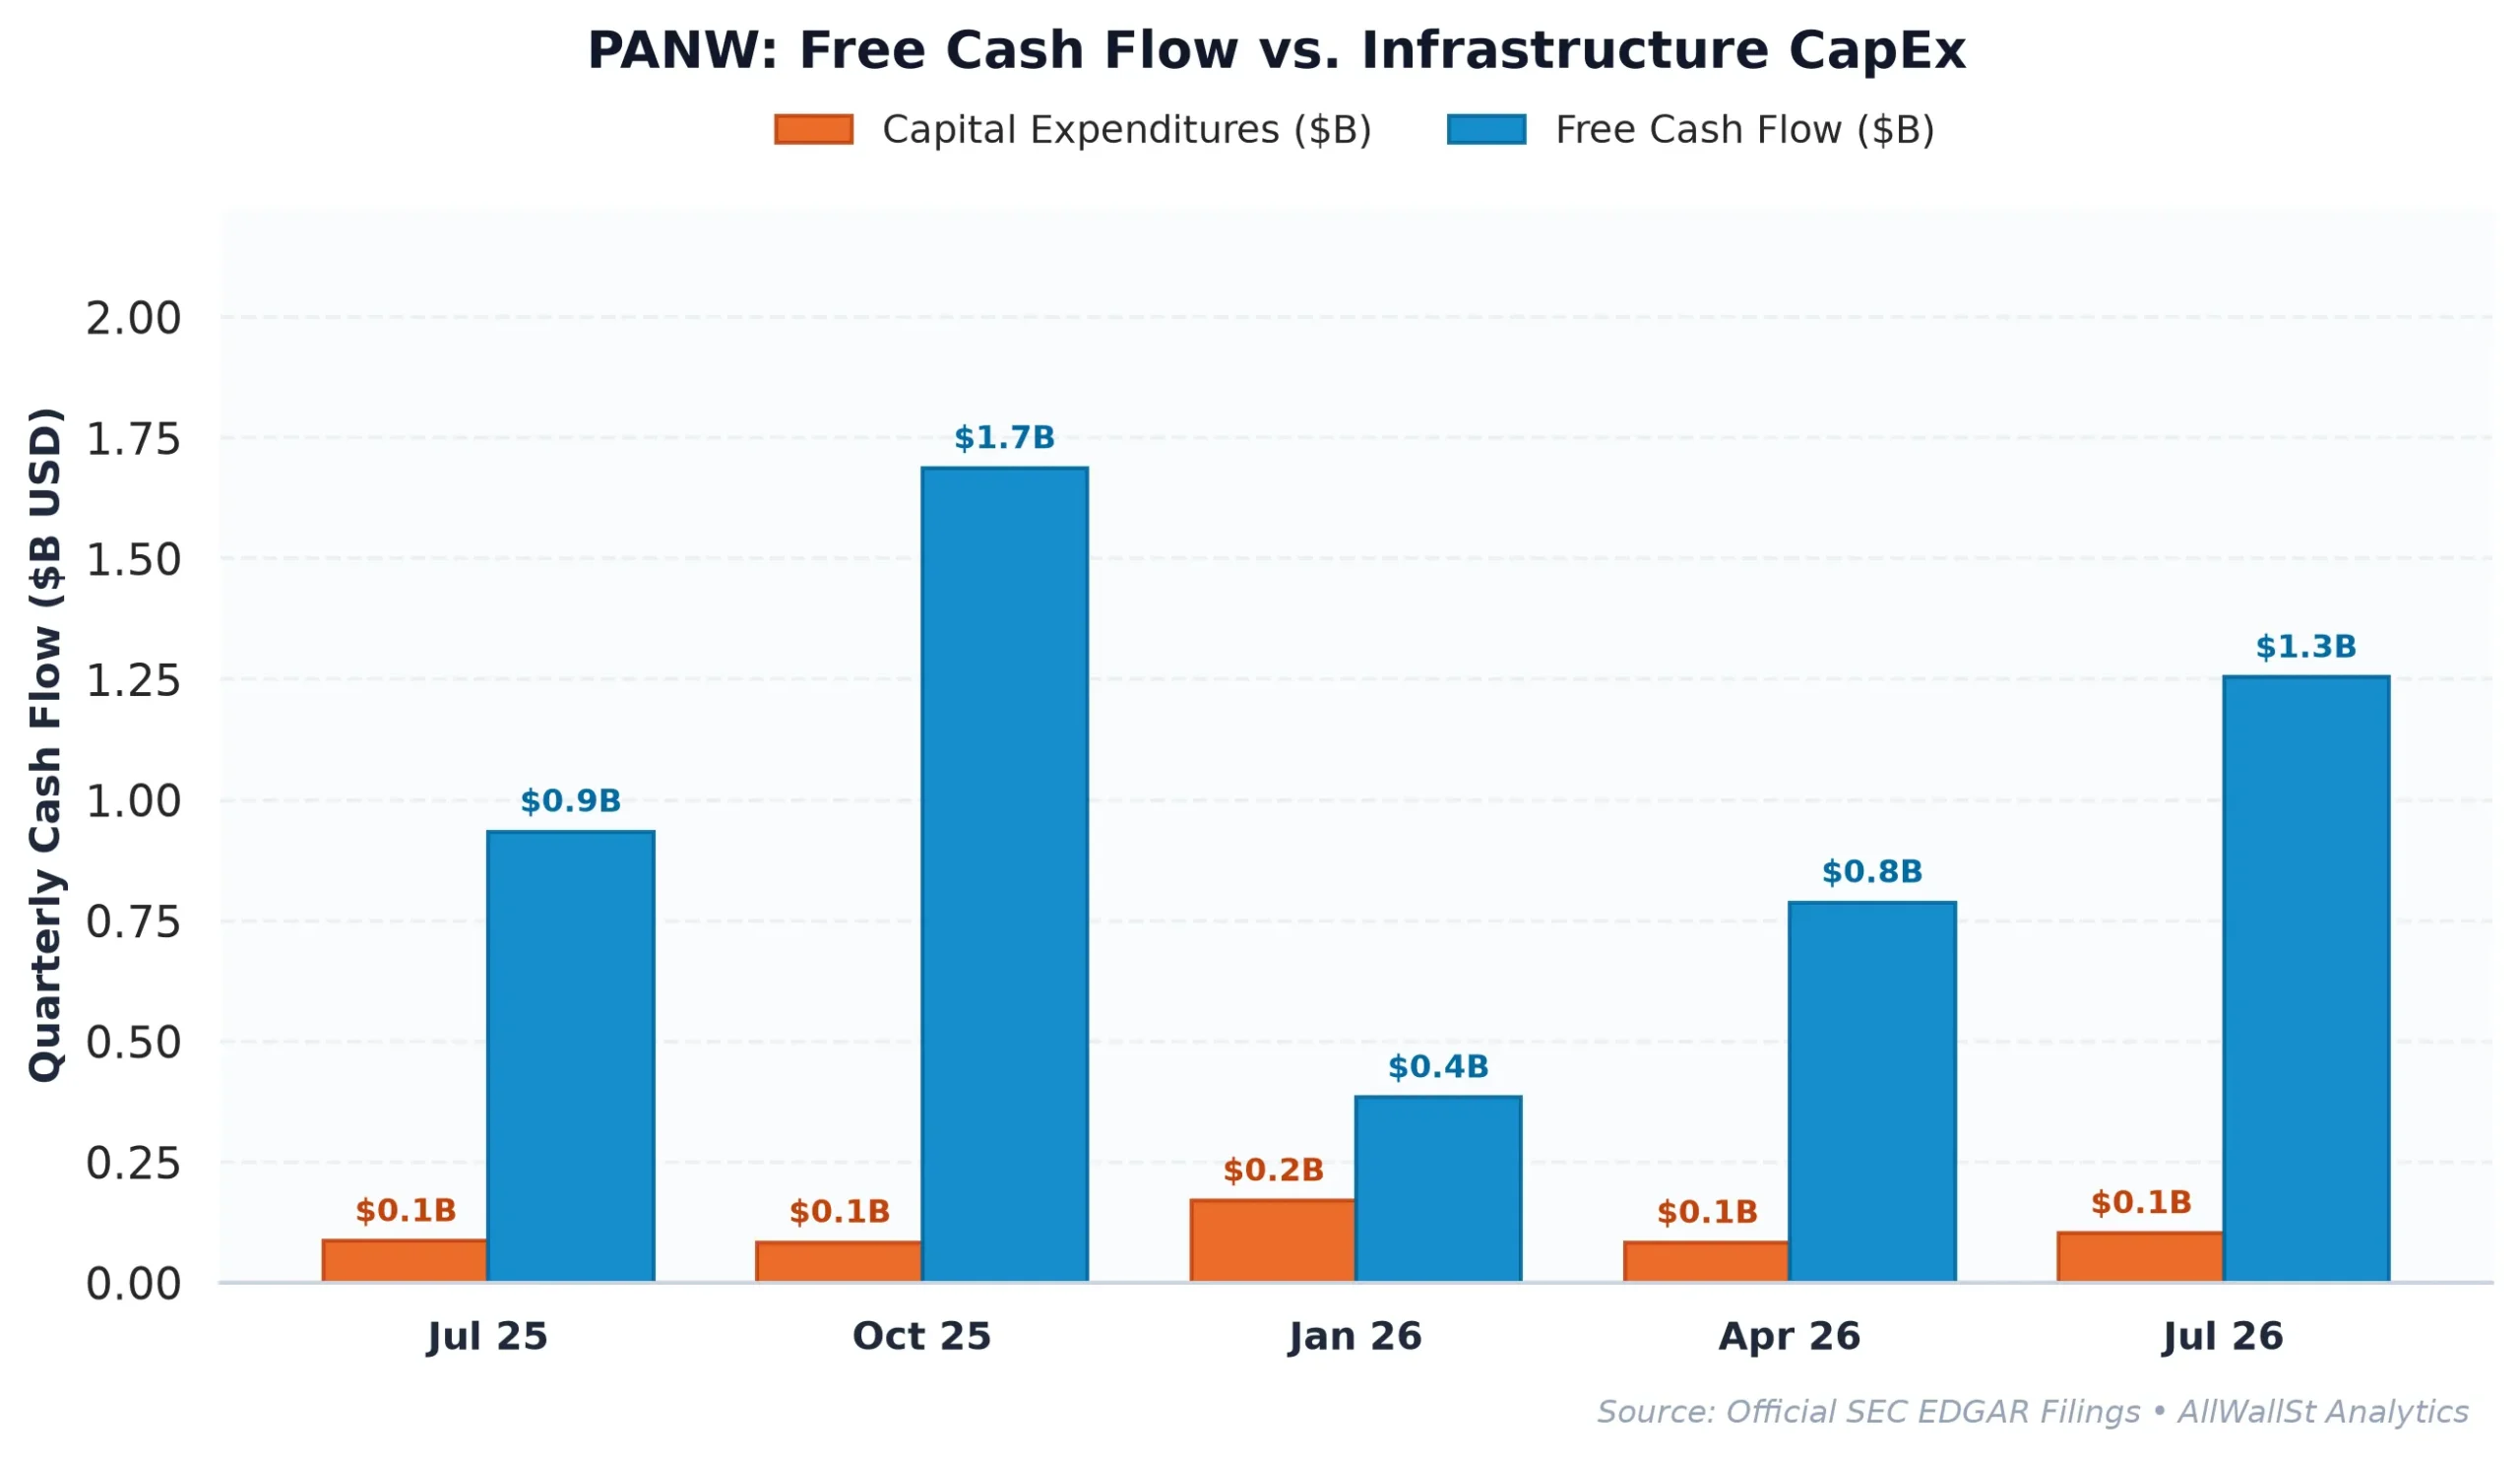
The numbers are quite striking. Palo Alto Networks reported $1.77 billion in stock-based compensation (SBC) over the last year, which represents a staggering 39% of its operating cash flow. If you subtract that SBC from the free cash flow, the “real” yield drops to a negligible 0.93%. In a world where the US 10-Year Treasury gives you 5.10% for doing absolutely nothing, asking investors to accept a sub-1% real yield for the privilege of owning a high-beta software company is a bold request. It is like paying for a five-course meal but only getting to eat the garnish.
Comparing Palo Alto Networks to its peers makes the valuation even more difficult to defend. Fortinet (FTNT) trades at 33.2x forward earnings, roughly half the multiple of PANW’s 66.1x, yet Fortinet maintains operating margins of 32.9% compared to a meager 7.05% for Palo Alto Networks. Even Cisco Systems (CSCO), which is often dismissed as a legacy incumbent, produces far more cash per dollar of revenue. Palo Alto Networks is chasing growth at the expense of capital efficiency: its Return on Invested Capital (ROIC) of 2.36% is significantly lower than its estimated 8.5% cost of capital, meaning the company is technically destroying value as it scales.
The quantitative desk also notes a precarious market structure. The Put/Call open interest ratio is a microscopic 0.02, meaning the market is almost entirely one-way. This speculative long skew makes the stock vulnerable to a dealer-led liquidation if upside momentum pauses near the $330 call wall. With the Max Pain strike sitting all the way down at $210, the gap between current speculative fervor and structural support is a literal canyon. While Wall Street maintains a Market Weight consensus based on career-risk index tracking, the fundamental reality of compressed cash flows and massive dilution makes this a clear candidate for avoidance.
Investment Committee Steelman Dissent: If the platformization strategy successfully consolidates enterprise spending, Palo Alto Networks could achieve a scale that justifies its premium multiple through sheer market dominance. Additionally, the extreme call skew could trigger a mechanical gamma squeeze if the stock breaches the $330 resistance level, forcing dealers to buy shares regardless of fundamental value.
AllWallSt Investment Verdict: SELL
Palo Alto Networks, Inc. (PANW)
Trailing P/E
Marcus Wolfe Screen
Leverage Profile
30D Channel
Dealer Gamma Pinning & Max Pain Alignment (PANW)
🎯 Max Pain: $210.00
Spot $322.66
Ceiling $325C Resistance ▲
Pristine cash flow conversion (14.83x) and healthy accrual ratio (-8.76%). Zero accounting anomalies detected (LOW ANOMALY RISK).
Fortress Balance Sheet (Net Cash Position; zero net refinancing distress).
Negative yield spread (-3.50% vs 5.10% Treasury); equity requires robust multiple expansion or growth.
Max Pain: $210.00 (-34.92%) | P/C Ratio: 0.02 | 30D Channel: $311.11 – $334.21. Dealer gamma bounded between $322.5 Put Wall and $325 Call Wall.
PANW carries standard index weighting (< 0.6% SPY footprint); sell-side consensus reflects standard earnings momentum rather than index-tracking mandates.
$318.50 – $331.50 (Call Wall Resistance Distribution Ceiling)
Sustained weekly close above $325.00 (Call Wall Resistance) or structural rebound in GAAP Free Cash Flow.
Bullish IC Dissent: Despite 806.6x trailing earnings and 1.61% FCF yield, Palo Alto Networks, Inc. (PANW) could stage a sharp short-covering squeeze if management surprises with cost discipline, buyback acceleration, or stabilizing guidance above the $325 call wall. Consensus pessimism already prices in significant deterioration, creating asymmetric upside risk if credit spreads remain contained.
Sources & References
- Official SEC Form 10-K Annual Report (Filed 2026-09-10)
- Official SEC Form 10-Q Quarterly Report (Filed 2026-06-03)
- Official SEC EDGAR Filings: https://www.sec.gov/edgar/browse/?CIK=0001327567
- Palo Alto Networks Investor Relations: https://www.paloaltonetworks.com
- Primary Exchange Feed Data: Nasdaq Global Select Market
Regulatory Disclaimer: This report is for informational purposes only and does not constitute financial, legal, or investment advice. AllWallSt is a financial journalism outlet and does not hold a fiduciary duty to the reader. Investing in public equities involves significant risk. Past performance is not indicative of future results. Metrics and calculations are based on primary SEC filings and market data feeds available at the time of publication. Consult with a licensed financial advisor before making any investment decisions.