
⚡ Executive Morning Takeaways
- Macro & Rates Impulse: The 10-Year US Treasury yield hovers at 5.03%, maintaining pressure on equity valuation multiples while WTI crude surges 2.64% to $99.71 per barrel, injecting renewed input cost friction across corporate supply chains.
- Sector Rotation & Dispersion: Defensive sectors are lagging cyclical growth desks as Consumer Staples (XLP) drops 0.73% to trade at 25.9 times trailing earnings, creating stark multiple dispersion against outperforming Technology (XLK) at 30.9 times.
- Primary Corporate Catalyst: The Procter & Gamble Company (PG) delivered a core earnings per share beat supported by fabric care resilience and its Thorne acquisition, though options dealer inventory firmly pins immediate price action below the $160 call wall.
🌐 Pre-Market Macro & Rates Dashboard
| Asset / Benchmark | Ticker | Current Price / Level | Change (%) | 52-Week Low | 52-Week High |
|---|---|---|---|---|---|
| S&P 500 (SPY) | SPY | $773.09 | +0.53% | $629.28 | $781.62 |
| Nasdaq 100 (QQQ) | QQQ | $725.20 | +1.05% | $555.60 | $762.86 |
| Russell 2000 (IWM) | IWM | $276.48 | +0.25% | $228.90 | $305.18 |
| 20+ Year Treasury (TLT) | TLT | $80.24 | +0.14% | $76.43 | $92.18 |
| High Yield Corporate (HYG) | HYG | $76.98 | +0.20% | $76.39 | $81.33 |
| Gold (GLD) | GLD | $378.95 | +0.34% | $360.12 | $509.70 |
| WTI Crude Oil (CL=F) | CL=F | $99.71/bbl | +2.64% | $54.98 | $119.48 |
| US Dollar Index Bullish (UUP) | UUP | $28.92 | +0.07% | $26.40 | $29.25 |
| CBOE Volatility Index (^VIX) | ^VIX | 18.06 | +8.27% | 13.38 | 35.30 |
| 2-Yr US Treasury Yield (2YY=F) | 2YY=F | 4.75% | +0.00% | 3.38% | 4.88% |
| 10-Yr US Treasury Yield (^TNX) | ^TNX | 5.03% | -2.18% | 3.96% | 5.36% |
Operating in an environment where the 10-Year US Treasury yield trades stubbornly above 5.00% fundamentally recalibrates equity risk premia. When risk-free sovereign paper offers a reliable 5.03% return, any corporate equity yielding less than 4% in free cash flow operates at an immediate disadvantage. The equity duration penalty is no longer an academic abstraction; institutional allocators can lock in risk-free sovereign yields without taking on corporate operating risk, inventory cycles, or consumer price sensitivity.
Simultaneously, the commodity backdrop presents emerging margin risks. WTI crude oil is knocking on the door of $100 per barrel, up 2.64% to $99.71. For packaging-heavy, distribution-intensive consumer giants, rising petroleum feedstocks translate directly into higher plastic packaging resin expenses and elevated freight charges. With the US Dollar Index holding firm at $28.92, multinational operators face both transactional foreign exchange headwinds and domestic logistics inflation, testing whether consumer demand will tolerate another wave of pricing action.
📊 Sector Valuation & Performance Landscape
| Sector ETF | Ticker | Price | Change (%) | Trailing P/E | Dividend Yield | 52-Week Low | 52-Week High |
|---|---|---|---|---|---|---|---|
| Technology (XLK) | XLK | $188.54 | +1.67% | 30.9x | 0.43% | $126.68 | $203.25 |
| Communication Services (XLC) | XLC | $108.97 | -1.11% | 16.0x | 1.24% | $105.03 | $120.41 |
| Financials (XLF) | XLF | $56.04 | +0.57% | 16.0x | 1.55% | $47.67 | $58.60 |
| Healthcare (XLV) | XLV | $178.94 | -0.49% | 31.9x | 1.52% | $141.97 | $180.06 |
| Energy (XLE) | XLE | $68.16 | +0.28% | 19.4x | 2.48% | $43.19 | $68.64 |
| Consumer Discretionary (XLY) | XLY | $115.53 | +0.03% | 25.5x | 0.86% | $105.19 | $125.01 |
| Consumer Staples (XLP) | XLP | $87.11 | -0.73% | 25.9x | 2.73% | $75.16 | $90.14 |
| Utilities (XLU) | XLU | $42.00 | +0.29% | 19.0x | 3.07% | $39.03 | $47.80 |
| Industrials (XLI) | XLI | $168.31 | +0.91% | 27.7x | 1.13% | $147.14 | $188.19 |
| Materials (XLB) | XLB | $51.32 | +0.18% | 23.9x | 1.77% | $42.03 | $54.19 |
Cross-sector valuation spreads reveal a clear institutional preference for balance sheet duration with high operational leverage over slow-growing defensive proxies. Consumer Staples (XLP) dropped 0.73% in early trade, commanding a rich trailing price-to-earnings multiple of 25.9 times despite delivering aggregate revenue growth barely matching core inflation. When dividend-rich defensive proxies trade at nearly 26 times earnings while paying an aggregate dividend yield of only 2.73%, their yield spread relative to short-dated fixed income sits deeply inverted.
In contrast, Financials (XLF) trade at 16.0 times trailing earnings while benefiting from a steepened sovereign yield curve and sustained net interest margins. Investors are actively questioning whether paying a growth multiple for defensive safety makes mathematical sense when the risk-free rate is north of 5.00%. If defensive consumer staples cannot accelerate organic unit volumes, their valuation multiples face mechanical compression back toward historical averages closer to 18 to 20 times.
📅 Today’s Earnings & Economic Radar
Imminent Corporate Earnings Releases
| Company / Ticker | Timing | Consensus EPS | Consensus Revenue | Key Strategic Theme |
|---|---|---|---|---|
| Procter & Gamble (PG) | Today (BMO / AMC) | $1.89 | $22.82B | Organic Volume Elasticity vs Pricing Power |
| Honeywell (HON) | Today (BMO / AMC) | $2.16 | $5.01B | Aerospace Backlog & Industrial Automation Conversion |
| Union Pacific (UNP) | Today (BMO / AMC) | $3.48 | $7.13B | Intermodal Freight Volumes & Operating Ratio Efficiency |
| Lockheed Martin (LMT) | Today (BMO / AMC) | $7.52 | $20.46B | Defense Production Ramp & Supply Chain Bottlenecks |
| Meta Platforms (META) | Yesterday (Reported) | $6.80 | $63.41B | Digital Ad Monetization & Infrastructure CapEx Run-Rate |
High-Impact Economic Data & Central Bank Actions
| Time (ET) | Event | Impact | Consensus |
|---|---|---|---|
| 08:30 AM | Initial Jobless Claims & Continuing Claims | HIGH | 218K |
| 08:30 AM | Philadelphia Fed Business Outlook Index | HIGH | +5.2 |
| 10:30 AM | EIA Natural Gas Storage Report | MEDIUM | +78 Bcf |
| 01:00 PM | US 30-Year Treasury Bond Auction | HIGH | Yield Discovery |
Institutional trading desks are focused squarely on the 08:30 AM labor prints and the early afternoon 30-Year Treasury bond auction. With long-term yields probing cyclical highs, any weak dealer takedown or high auction tail at 1:00 PM will trigger instantaneous rate sensitivity across equities, penalizing high-multiple defensive stocks whose cash flows extend far into the future.
🎯 Pre-Market Spotlight: The Procter & Gamble Company (PG)
There is an old, comforting Wall Street belief that people will buy laundry detergent and toilet paper regardless of whether the sovereign bond market is having a mild existential crisis. This thesis has served The Procter & Gamble Company (PG) exceptionally well for nearly two centuries. When macroeconomic uncertainty rises, portfolio managers instinctively buy the maker of Tide, Pampers, and Gillette. It feels safe, responsible, and thoroughly defensible to an investment committee.
The trouble is that financial gravity eventually catches up with comfort. In its latest Form 8-K filed on October 22, 2026, Procter & Gamble reported a solid quarter. Core earnings per share beat expectations, sales rose 4%, and organic volumes held firm across laundry and home products, supplemented by growth from the Thorne acquisition. Management reaffirmed its fiscal 2027 outlook, demonstrating once again that its brand portfolio can withstand consumer belt-tightening and geopolitical friction.
The mechanical dilemma does not lie in operational execution. P&G is an exceptionally well-run machine, generating $15.75 billion in trailing net income on $87.03 billion in total revenue, good for a gross margin of 50.87% and an operating margin of 22.08%. The friction lies in how that cash is priced.
THE PROCTER & GAMBLE COMPANY: CASH RETURN VS. SOVEREIGN HURDLE
[==================================================]
  P&G Free Cash Flow Yield:         3.65%
  10-Year US Treasury Benchmark:    5.03%
  --------------------------------------------------
  Equity Risk Premium Spread:      -1.39%  (Duration Deficit)
  Net Debt / EBITDA:                1.01x  ($25.08B Net Debt)
  Price-to-Earnings Growth (PEG):   4.01x  (Sub-2% Top-Line)
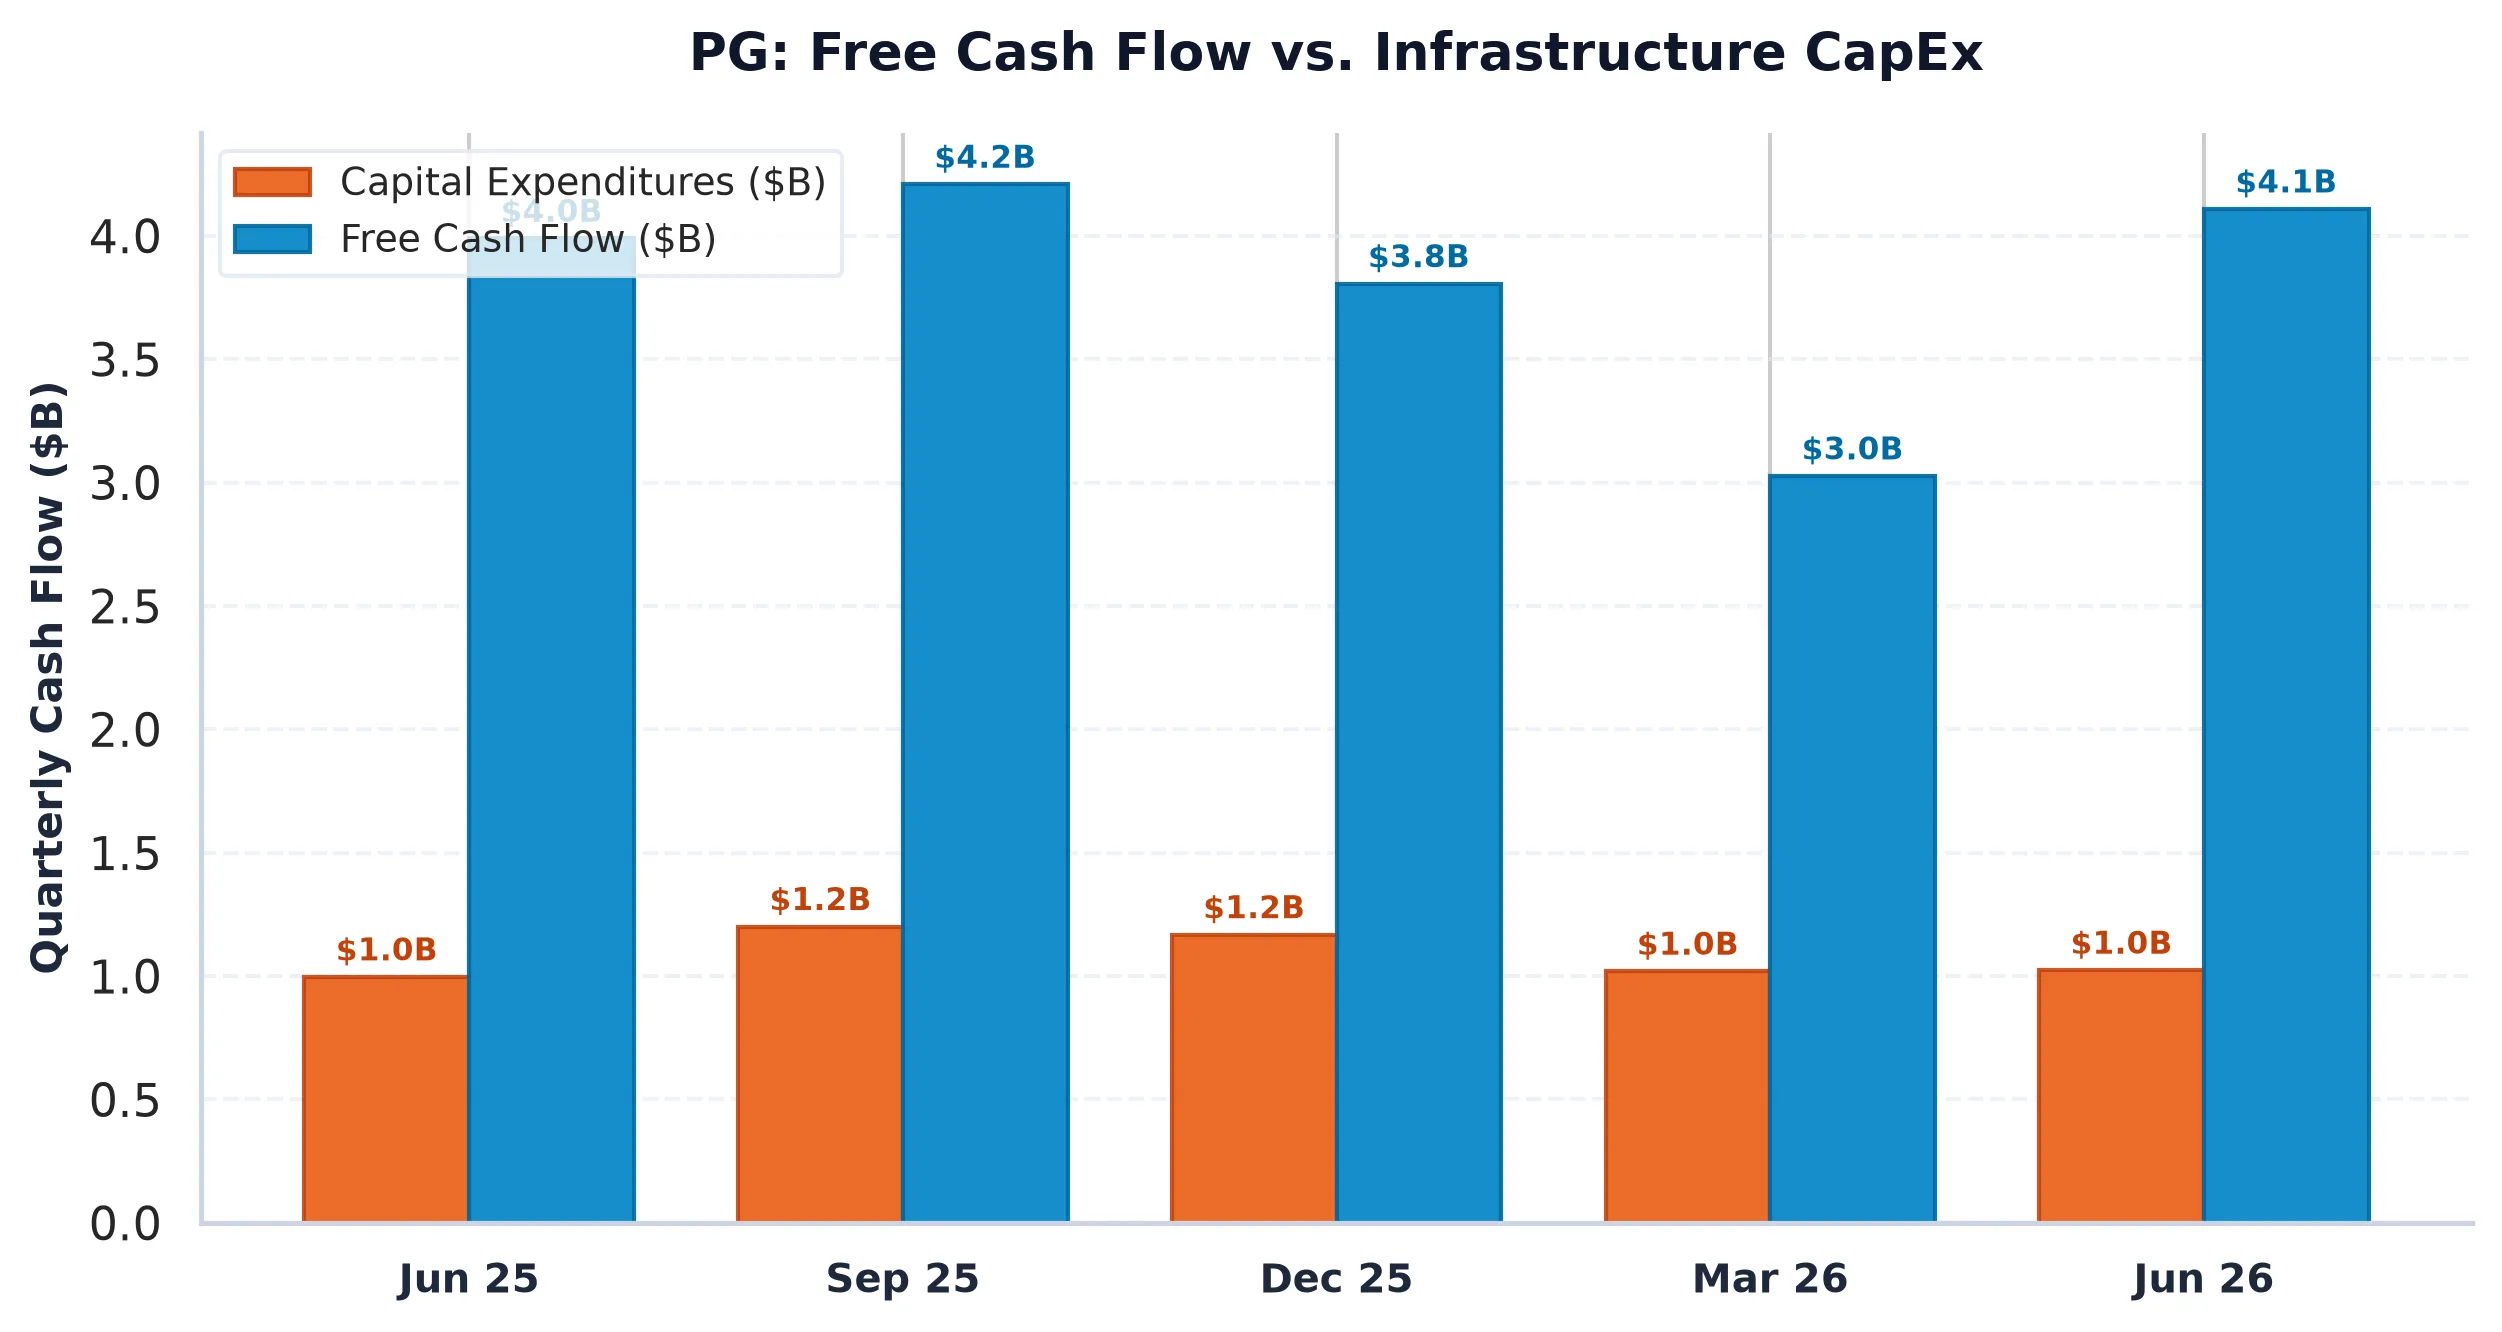
At its current equity price of $156.84, Procter & Gamble carries an enterprise value of $390.63 billion and generates $13.28 billion in trailing free cash flow. That gives the stock a Free Cash Flow Yield of 3.65%.
When compared to the US 10-Year Treasury yield benchmark of 5.03%, P&G trades at an Equity Risk Premium spread of negative 1.39%. You are paying a premium to take operational risk on consumer elasticities, retailer shelf negotiations, and resin price inflation, while receiving 138 basis points less cash yield than risk-free sovereign debt.
Furthermore, capital intensity remains non-trivial. Capital expenditures totaled $6.28 billion over the trailing twelve months, representing 7.21% of revenue as the company modernizes supply chains and expands manufacturing capacity. With top-line revenue growing at just 1.50% year over year, the company trades at a Price-to-Earnings Growth (PEG) ratio of 4.01. Investors are effectively treating a mature, low-growth consumer staple as if it were a high-moat utility with guaranteed regulatory returns, overlooking the reality that household balance sheets are actively trading down to private-label alternatives at mass retailers.
From a market structure perspective, equity derivatives desks have effectively neutralized near-term directional volatility. Leo Richter’s quantitative inspection reveals that Procter & Gamble is caught in a tight dealer gamma pin:
OPTIONS MARKET PLUMBING: THE PG GAMMA CORRIDOR
------------------------------------------------------------
Current Spot Price:          $156.84
Put/Call Open Interest:      0.72 (Slight Call Overhang)
Max Pain Anchor:             $152.50 (-2.77% from spot)
Primary Call Resistance:     $160.00 (4,267 contracts)
Secondary Call Resistance:   $157.50 (3,729 contracts)
Primary Put Support:         $152.50 (2,213 contracts)
30-Day Implied Volatility:   1.56%
30-Day Expected Move:        +/-$0.71 (+/-0.45%)
The options market is pricing virtually zero turbulence. At an implied volatility of just 1.56%, the deterministic 30-day expected move is a tiny plus or minus $0.71. Market makers sit in a balanced gamma position, selling into slight upticks toward the $157.50 and $160 call walls, while buying dips toward the $152.50 put wall and max pain strike. This mechanical pinning cushions the stock against sharp post-earnings drawdowns, but it also caps immediate upside.
Procter & Gamble remains an elite corporate enterprise with minimal balance sheet leverage (Net Debt to EBITDA sits at a clean 1.01 times). However, capital allocation is about opportunity cost. As long as sovereign risk-free yields remain anchored north of 5.00%, paying 23.7 times trailing earnings for a 3.65% cash flow yield leaves equity investors exposed to duration compression whenever macro yields tick higher.
The Procter & Gamble Company (PG)
Trailing P/E
Marcus Wolfe Screen
Leverage Profile
30D Channel
Pristine cash flow conversion (1.22x) and healthy accrual ratio (-2.77%). Zero accounting anomalies detected (LOW ANOMALY RISK).
Manageable liability structure relative to institutional cash flow.
Evaluated against 5.10% US 10-Yr Benchmark (FCF Spread: -1.39% (vs 10Y Yield of 5.03%)).
Max Pain: $152.50 (-2.77%) | P/C Ratio: 0.72 | 30D Channel: $145.60 – $168.08.
$144.29 – $150.57 (-4% to -8% Pullback Accumulation)
Sustained weekly close below $141.16 (-10.0% structural stop) or fundamental cash flow deterioration.