
⚡ Executive Morning Takeaways
- Overnight Futures & Rates Impulse: Equity index futures are trading higher ahead of the cash open, led by E-Mini S&P 500 futures (+0.91%) and E-Mini Nasdaq 100 futures (+0.22%). The 10-Year Treasury yield sits at 4.95%, keeping pressure on high-duration valuation multiples as the US dollar index gains 0.17%.
- Sector Rotation Leaders & Laggards: Growth sectors are driving momentum, with Technology (XLK +1.31%) and Communication Services (XLC +1.18%) outperforming. Defensive and commodity-linked sectors are under pressure, led lower by Consumer Staples (XLP -2.07%) and Materials (XLB -2.01%).
- Primary Corporate Catalyst: QUALCOMM Incorporated (QCOM) ticks up 1.19% in pre-market trading to $166.39 ahead of its earnings release. Options market structure shows a neutral Put/Call ratio of 0.96 with a Max Pain anchor at $172.50, implying upside room into dealer gamma limits.
🌐 Pre-Market Macro, Futures & Rates Dashboard
| Asset / Benchmark | Ticker | Current Price / Level | Change (%) | 52-Week Low | 52-Week High |
|---|---|---|---|---|---|
| E-Mini S&P 500 Futures (ES=F) | ES=F | $7666.25 | +0.91% | $6353.25 | $7897.50 |
| E-Mini Nasdaq 100 Futures (NQ=F) | NQ=F | $28366.75 | +0.22% | $22961.50 | $31616.50 |
| S&P 500 (SPY) | SPY | $754.35 | +0.30% | $629.28 | $781.62 |
| Nasdaq 100 (QQQ) | QQQ | $685.28 | +0.62% | $555.60 | $762.86 |
| Russell 2000 (IWM) | IWM | $279.79 | +0.23% | $228.90 | $305.18 |
| 20+ Year Treasury (TLT) | TLT | $81.11 | -0.76% | $76.43 | $90.86 |
| High Yield Corporate (HYG) | HYG | $76.98 | +0.12% | $76.39 | $81.24 |
| Gold (GLD) | GLD | $359.26 | -0.66% | $354.67 | $509.70 |
| WTI Crude Oil (CL=F) | CL=F | $94.46/bbl | -1.70% | $54.98 | $119.48 |
| US Dollar Index Bullish (UUP) | UUP | $29.01 | +0.17% | $26.40 | $29.25 |
| CBOE Volatility Index (^VIX) | ^VIX | 18.50 | -11.19% | 13.38 | 35.30 |
| 2-Yr US Treasury Yield (2YY=F) | 2YY=F | 4.75% | +0.00% | 3.38% | 4.88% |
| 10-Yr US Treasury Yield (^TNX) | ^TNX | 4.95% | +0.00% | 3.96% | 5.36% |
Cross-asset dynamics depict a market pricing in lower immediate volatility as the CBOE Volatility Index drops 11.19% to 18.50. However, fixed income yields remain elevated. With the 10-Year Treasury yield hovering at 4.95%, the equity risk premium across large-cap technology equities remains thin. Capital flows are rewarding businesses with current free cash flow over distant earnings promises.
Energy assets are easing back as WTI Crude drops 1.70% to $94.46 per barrel, providing a slight margin tailwind for broader corporate input costs. Meanwhile, high-yield corporate credit (HYG) shows modest stability (+0.12%), signalling that balance sheet leverage is not driving systemic concern into this morning’s session.
📊 Sector Rotation Leaders & Laggards
| Rotation Rank | Sector ETF | Ticker | Price | Change (%) | Trailing P/E | Dividend Yield | 52-Week Low | 52-Week High |
|---|---|---|---|---|---|---|---|---|
| Leader (#1) | Technology (XLK) | XLK | $176.51 | +1.31% | 28.9x | 0.43% | $126.68 | $203.25 |
| Leader (#2) | Communication Services (XLC) | XLC | $101.44 | +1.18% | 14.9x | 1.24% | $99.33 | $120.41 |
| Leader (#3) | Industrials (XLI) | XLI | $171.32 | +0.95% | 28.1x | 1.13% | $147.14 | $188.19 |
| Laggard (#8) | Energy (XLE) | XLE | $66.68 | -0.85% | 19.0x | 2.48% | $43.55 | $70.15 |
| Laggard (#9) | Materials (XLB) | XLB | $52.59 | -2.01% | 24.5x | 1.77% | $42.22 | $54.19 |
| Laggard (#10) | Consumer Staples (XLP) | XLP | $88.95 | -2.07% | 26.4x | 2.73% | $75.16 | $90.99 |
Sector rotation highlights institutional risk-seeking within tech and communications. Technology (XLK) trades at 28.9x trailing earnings while capturing the top rotation spot, reflecting robust demand for semiconductor and software infrastructure.
Conversely, defensive areas like Consumer Staples (XLP) are facing selling pressure despite offering a 2.73% dividend yield. At a 26.4x trailing multiple, capital is exiting staples to chase secular earnings growth in capital-efficient hardware providers.
📅 Today’s Earnings & Economic Radar
Imminent Corporate Earnings Releases
| Company / Ticker | Timing | Consensus EPS | Consensus Revenue | Key Strategic Theme |
|---|---|---|---|---|
| Qualcomm (QCOM) | Today (BMO / AMC) | $2.16 | $10.14B | Handset Licensing Royalties & Automotive Snapdragon Pipeline |
| McDonald’s (MCD) | Today (BMO / AMC) | $3.38 | $7.28B | Value-Menu Traffic Elasticity vs Franchisee Cash Flow |
| ConocoPhillips (COP) | Tomorrow (Pre-Market) | $3.05 | $18.96B | LNG & Lower-48 Capital Efficiency vs Variable Return of Cash |
High-Impact Economic Data & Central Bank Actions
| Time (ET) | Event | Impact | Key Institutional Focus |
|---|---|---|---|
| 08:15 AM | ADP National Employment Report | HIGH | Private Payroll Momentum & Wage Growth |
| 10:00 AM | ISM Services PMI & Employment Sub-Index | CRITICAL | Services Inflation & Pricing Power |
| 10:30 AM | EIA Weekly Petroleum Status Report | HIGH | Crude & Gasoline Implied Demand |
Institutional desks are focusing on the 10:00 AM ISM Services PMI print. With services inflation holding the key to Federal Reserve rate expectations, any upside surprise in the prices paid component will immediately transmit into higher front-end yields.
🎯 Pre-Market Spotlight: QUALCOMM Incorporated (QCOM)
QUALCOMM Incorporated enters the pre-market session trading up 1.19% at $166.39, supported by recent institutional buying from Rakuten Investment Management and First Nebraska Trust, alongside a strategic participation in Hark’s $700 million funding round. The market continues to treat the company as a cyclical smartphone chip supplier, yet its balance sheet tells a significantly more durable capital allocation story. QUALCOMM generates $10.24 billion in free cash flow, representing a 5.83% cash flow yield that offers a +0.88% spread over the 10-Year Treasury yield.
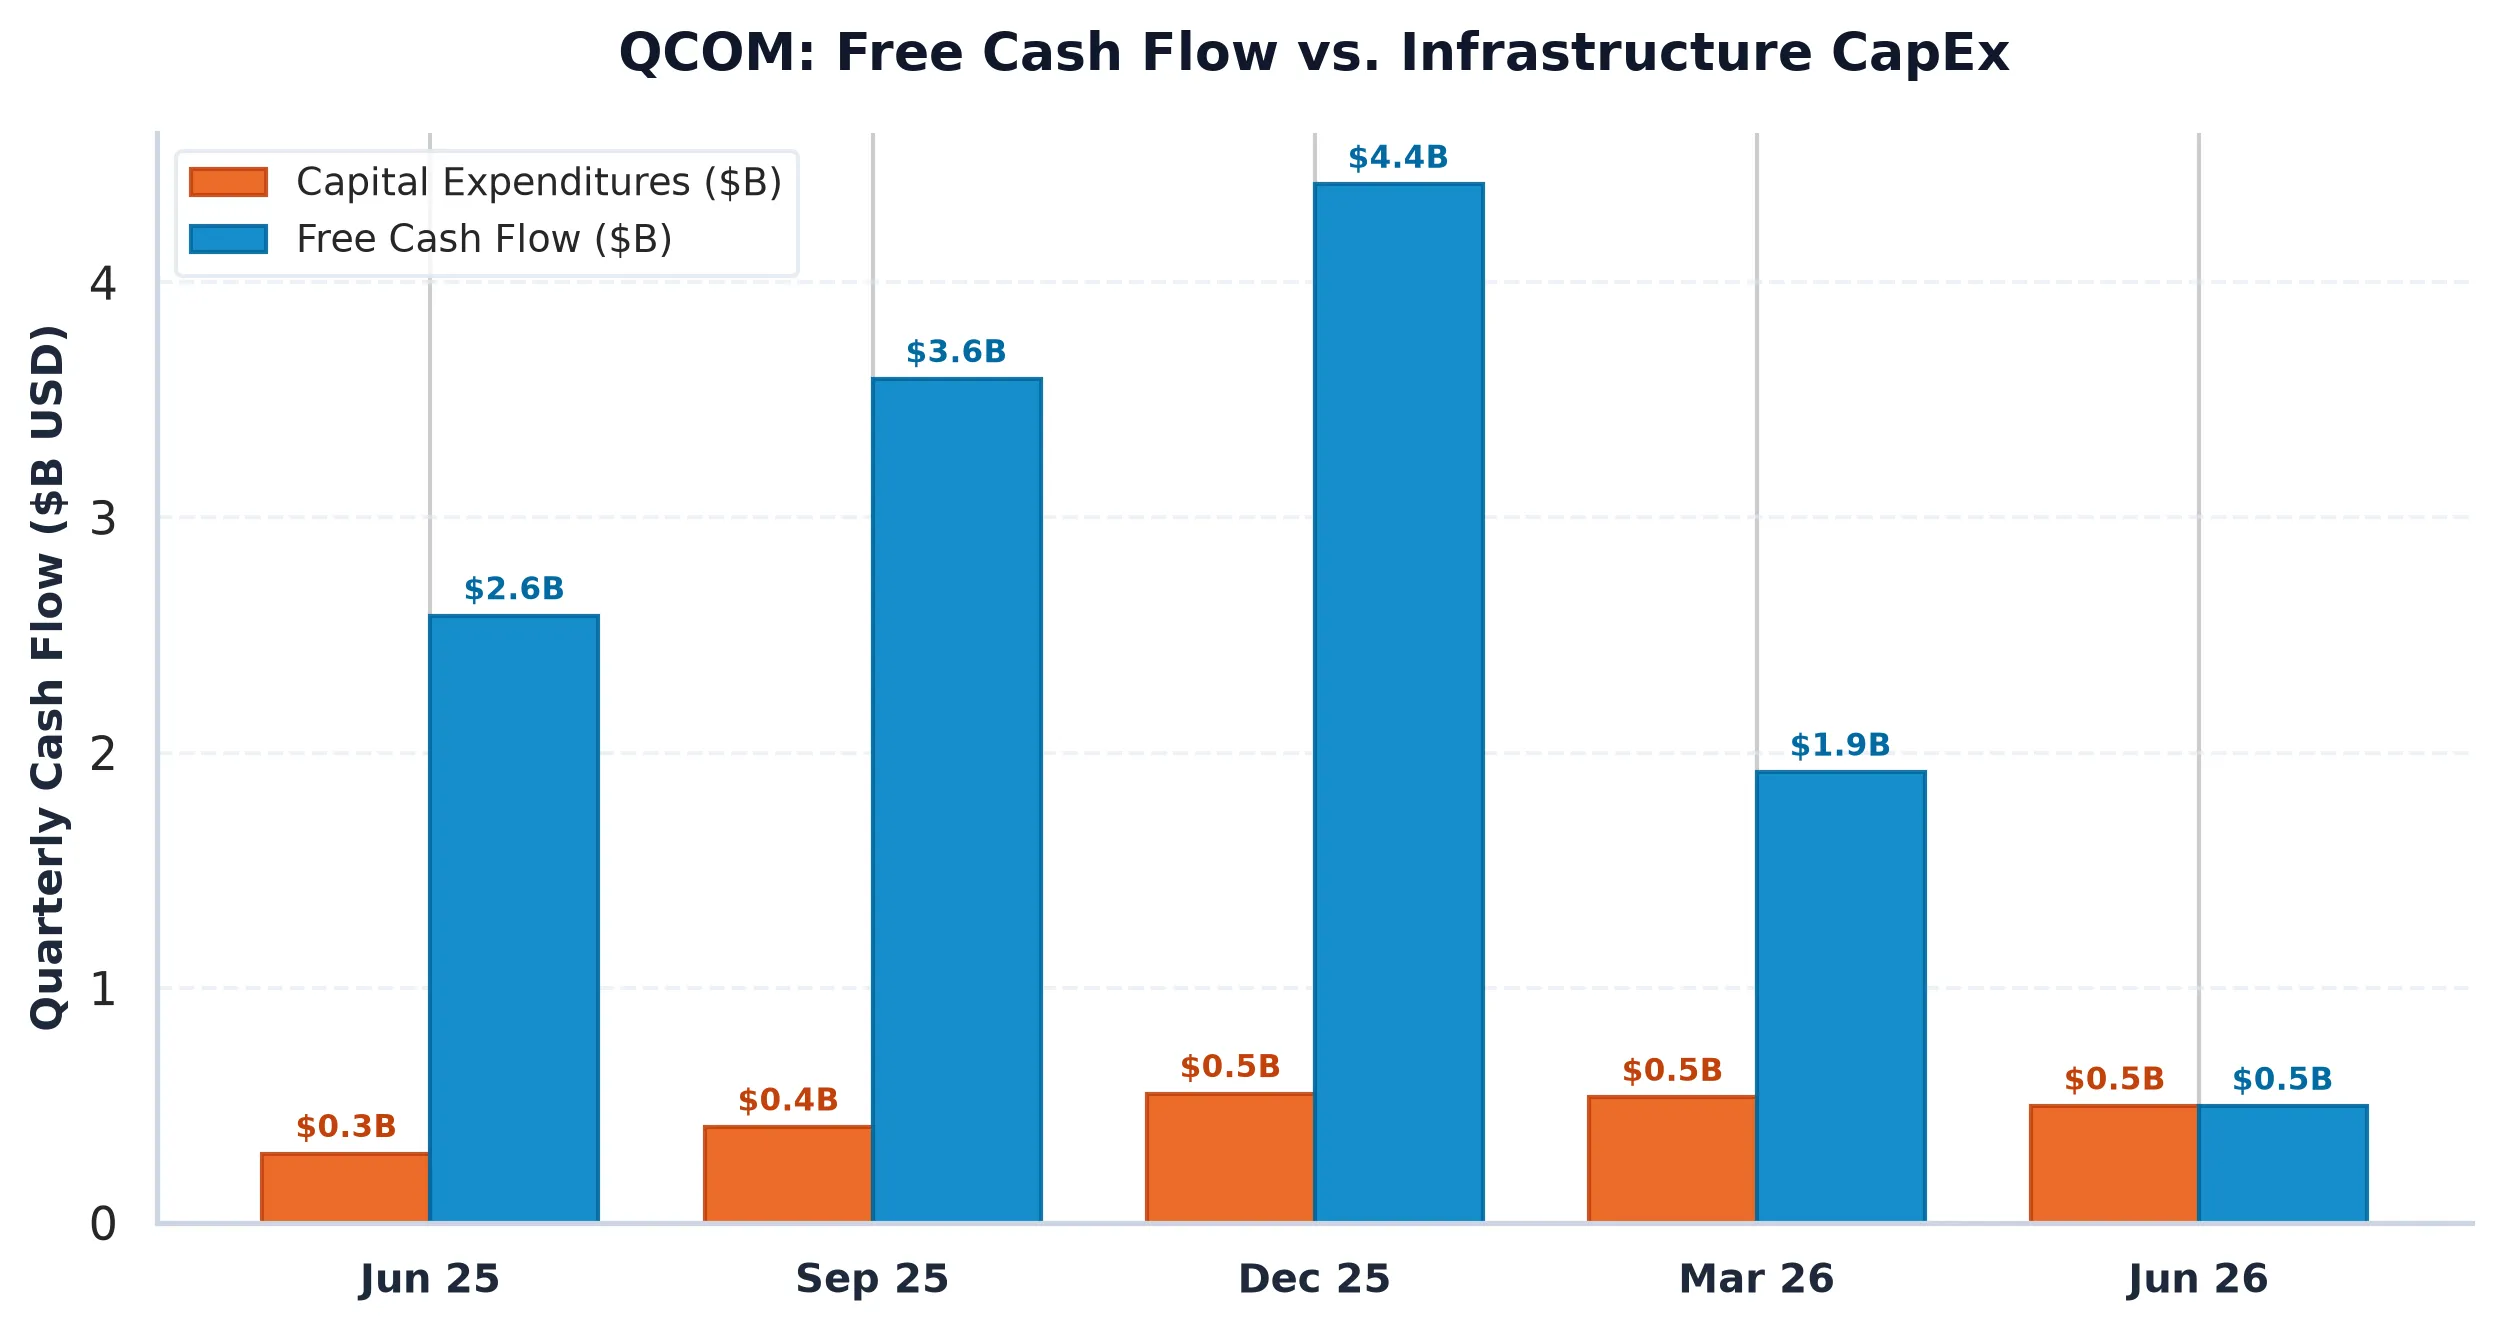
From a valuation perspective, QUALCOMM trades at a forward P/E of 16.2x and an EV/EBITDA multiple of 15.0x. Comparing these metrics to peers reveals a stark valuation disconnect: Broadcom (AVGO) commands an EV/EBITDA of 31.0x, Texas Instruments (TXN) trades at 27.2x, and Advanced Micro Devices (AMD) trades at 81.7x EV/EBITDA. While QUALCOMM reported a temporary YoY revenue decline of 4.00%, its return on invested capital stands at an impressive 18.48%, well above its ~8.5% cost of capital hurdle rate. Operating with a low net debt to EBITDA ratio of 0.58x and light CapEx intensity of 4.90% ($2.16 billion), the business funnels capital back to shareholders through a combined dividend and buyback yield of 7.25%.
Options market positioning reveals a balanced setup heading into earnings. Total call open interest of 85,663 contracts slightly exceeds put open interest of 82,500, yielding a neutral Put/Call ratio of 0.96. The Max Pain strike sits at $172.50, representing a +4.91% distance from the current spot price of $164.43. Primary call resistance rests at $170 (9,889 contracts), while key put support holds at $160 and $157.50. The 30-day implied volatility of 12.50% translates into an expected move of +/-$5.89 (+/-3.58%), suggesting the options market is underpricing potential upside post-earnings.
Wall Street consensus maintains a Market Weight rating on QUALCOMM due to near-term handset cyclicality concerns. However, an independent audit of free cash flow durability and shareholder yield supports a clear BUY conviction. With real free cash flow after stock-based compensation standing at $7.46 billion (a 4.25% real FCF yield) and low capital expenditure requirements, QUALCOMM offers an attractive risk-adjusted entry point relative to its expensive semiconductor peer group.
AllWallSt Investment Verdict: BUY
QUALCOMM Incorporated (QCOM)
Trailing P/E
Marcus Wolfe Screen
Leverage Profile
30D Channel
Pristine cash flow conversion (2.53x) and healthy accrual ratio (-16.89%). Zero accounting anomalies detected (LOW ANOMALY RISK).
Prudent Leverage (0.58x Net Debt/EBITDA); well within investment-grade covenant headroom.
Favorable equity risk premium (+0.88% FCF yield spread over 5.10% US 10-Yr Treasury benchmark).
Max Pain: $172.50 (+4.91%) | P/C Ratio: 0.96 | 30D Channel: $158.54 – $170.32. Dealer gamma bounded between $150 Put Wall and $170 Call Wall.
QCOM carries standard index weighting (< 0.6% SPY footprint); sell-side consensus reflects standard earnings momentum rather than index-tracking mandates.
$147.00 – $153.00 (Options Support Pinning)
Sustained weekly close below $150.00 (Put Wall) or gross margin compression below 54.23%.
Sources & References
- Official SEC Form 10-K Annual Report (Filed 2025-11-05)
-
SEC EDGAR Filing Search: QUALCOMM Incorporated (CIK 0000804328)
- Official Investor Relations: QUALCOMM Investor Relations
Disclaimer: This research article is published solely for informational and educational purposes and does not constitute investment advice or a recommendation to purchase or sell securities. Capital markets carry financial risk. Conduct independent analysis and consult a certified fiduciary advisor before making financial decisions.