
⚡ Executive Morning Takeaways
- Macro & Rates Impulse: The 10-Year Treasury yield has retreated to 5.09%, providing a brief reprieve for equity durations, while the US Dollar Index (UUP) shows signs of exhaustion near its 52-week highs.
- Sector Rotation & Dispersion: Defensive rotation is evident as Healthcare (XLV) and Financials (XLF) lead the tape, while Technology (XLK) faces valuation gravity, slipping 0.65% in pre-market action.
- Primary Corporate Catalyst: The Charles Schwab Corporation (SCHW) is navigating an extreme options skew following its recent earnings, with a Put/Call ratio of 0.01 signaling a market almost entirely devoid of downside hedging.
🌐 Pre-Market Macro & Rates Dashboard
| Asset / Benchmark | Ticker | Current Price / Level | Change (%) | 52-Week Low | 52-Week High |
|---|---|---|---|---|---|
| S&P 500 (SPY) | SPY | $771.79 | +0.28% | $629.28 | $781.62 |
| Nasdaq 100 (QQQ) | QQQ | $728.00 | -0.13% | $555.60 | $762.86 |
| Russell 2000 (IWM) | IWM | $275.08 | +1.37% | $228.90 | $305.18 |
| 20+ Year Treasury (TLT) | TLT | $79.97 | +1.37% | $76.43 | $92.19 |
| High Yield Corporate (HYG) | HYG | $77.13 | +0.42% | $76.39 | $81.33 |
| Gold (GLD) | GLD | $382.71 | +1.79% | $360.12 | $509.70 |
| WTI Crude Oil (CL=F) | CL=F | $95.61/bbl | -0.92% | $54.98 | $119.48 |
| US Dollar Index Bullish (UUP) | UUP | $29.00 | -0.41% | $26.40 | $29.25 |
| CBOE Volatility Index (^VIX) | ^VIX | 16.16 | -1.82% | 13.38 | 35.30 |
| 2-Yr US Treasury Yield (2YY=F) | 2YY=F | 4.75% | +0.00% | 3.38% | 4.88% |
| 10-Yr US Treasury Yield (^TNX) | ^TNX | 5.09% | -1.95% | 0.00% | 5.36% |
The macro environment remains tethered to the 10-Year Treasury yield, which at 5.09% continues to act as a formidable hurdle for equity risk premiums. While the slight cooling in yields has supported a bid in the Russell 2000, the broader market is treading water ahead of critical employment data. The tightening of credit spreads, evidenced by the marginal gain in High Yield (HYG), suggests that despite the rate volatility, the “higher for longer” regime has yet to trigger a systemic liquidity event.
📊 Sector Valuation & Performance Landscape
| Sector ETF | Ticker | Price | Change (%) | Trailing P/E | Dividend Yield | 52-Week Low | 52-Week High |
|---|---|---|---|---|---|---|---|
| Technology (XLK) | XLK | $189.19 | -0.65% | 31.0x | 0.43% | $126.68 | $203.25 |
| Communication Services (XLC) | XLC | $112.44 | +1.46% | 16.5x | 1.24% | $105.03 | $120.41 |
| Financials (XLF) | XLF | $55.27 | +1.38% | 15.8x | 1.55% | $47.67 | $58.60 |
| Healthcare (XLV) | XLV | $177.19 | +1.86% | 31.6x | 1.52% | $141.39 | $178.86 |
| Energy (XLE) | XLE | $66.56 | -1.58% | 19.0x | 2.48% | $42.65 | $67.90 |
| Consumer Discretionary (XLY) | XLY | $113.41 | +1.71% | 25.0x | 0.86% | $105.19 | $125.01 |
| Consumer Staples (XLP) | XLP | $86.68 | +0.72% | 25.7x | 2.73% | $75.16 | $90.14 |
| Utilities (XLU) | XLU | $41.65 | -0.17% | 18.9x | 3.07% | $39.03 | $47.80 |
| Industrials (XLI) | XLI | $167.89 | +0.51% | 27.6x | 1.13% | $147.14 | $188.19 |
| Materials (XLB) | XLB | $50.56 | +1.79% | 23.6x | 1.77% | $42.03 | $54.19 |
We are witnessing a distinct bifurcated tape. Capital is rotating out of the high-multiple Technology sector (31.0x P/E) and into relative value pockets like Financials and Communication Services. The Financials sector (XLF), trading at a more reasonable 15.8x trailing multiple, is benefiting from a steepening bias in the yield curve and resilient capital markets activity. Meanwhile, Energy (XLE) is the morning’s primary laggard, weighed down by a nearly 1% drop in WTI Crude prices.
📅 Today’s Earnings & Economic Radar
Imminent Corporate Earnings Releases
| Company / Ticker | Timing | Consensus EPS | Consensus Revenue | Key Strategic Theme |
|---|---|---|---|---|
| Charles Schwab (SCHW) | Yesterday (Reported) | $1.73 | $7.41B | Operating Margins & Capital Return |
| Netflix (NFLX) | 2026-10-20 | $0.82 | $12.88B | Ad-Tier Subscriber Growth |
| Intuitive Surgical (ISRG) | 2026-10-20 | $2.64 | $2.91B | Procedure Volume & Capital Allocation |
| GE Aerospace (GE) | 2026-10-20 | $2.01 | $12.88B | Engine Backlogs & Margin Expansion |
| RTX Corp (RTX) | 2026-10-20 | $1.78 | $24.11B | Defense Backlogs & Supply Chain |
High-Impact Economic Data & Central Bank Actions
| Time (ET) | Event | Impact | Consensus |
|---|---|---|---|
| 08:30 AM | US Employment Situation (NFP) | CRITICAL | +185K / 4.1% |
| 10:00 AM | Univ. of Michigan Consumer Sentiment | HIGH | 70.5 |
| 01:00 PM | Baker Hughes Weekly Rig Count | MEDIUM | 585 Rigs |
Institutional desks are laser-focused on the 08:30 AM Employment Situation report. Any significant upside surprise in Non-Farm Payrolls will likely re-ignite the “good news is bad news” trade, pushing the 10-Year yield back toward its recent highs and pressuring the equity risk premium.
🎯 Pre-Market Spotlight: The Charles Schwab Corporation (SCHW)
The Charles Schwab Corporation (SCHW) is, in the most literal sense, a bank that happens to have a very successful brokerage business attached to it. When you look at a 52.28% operating margin, you aren’t looking at a traditional software company: you are looking at the structural elegance of net interest income. The company reported earnings yesterday, and the market is still digesting the implications of its $96.36 billion cash pile against its $75.78 billion debt load.
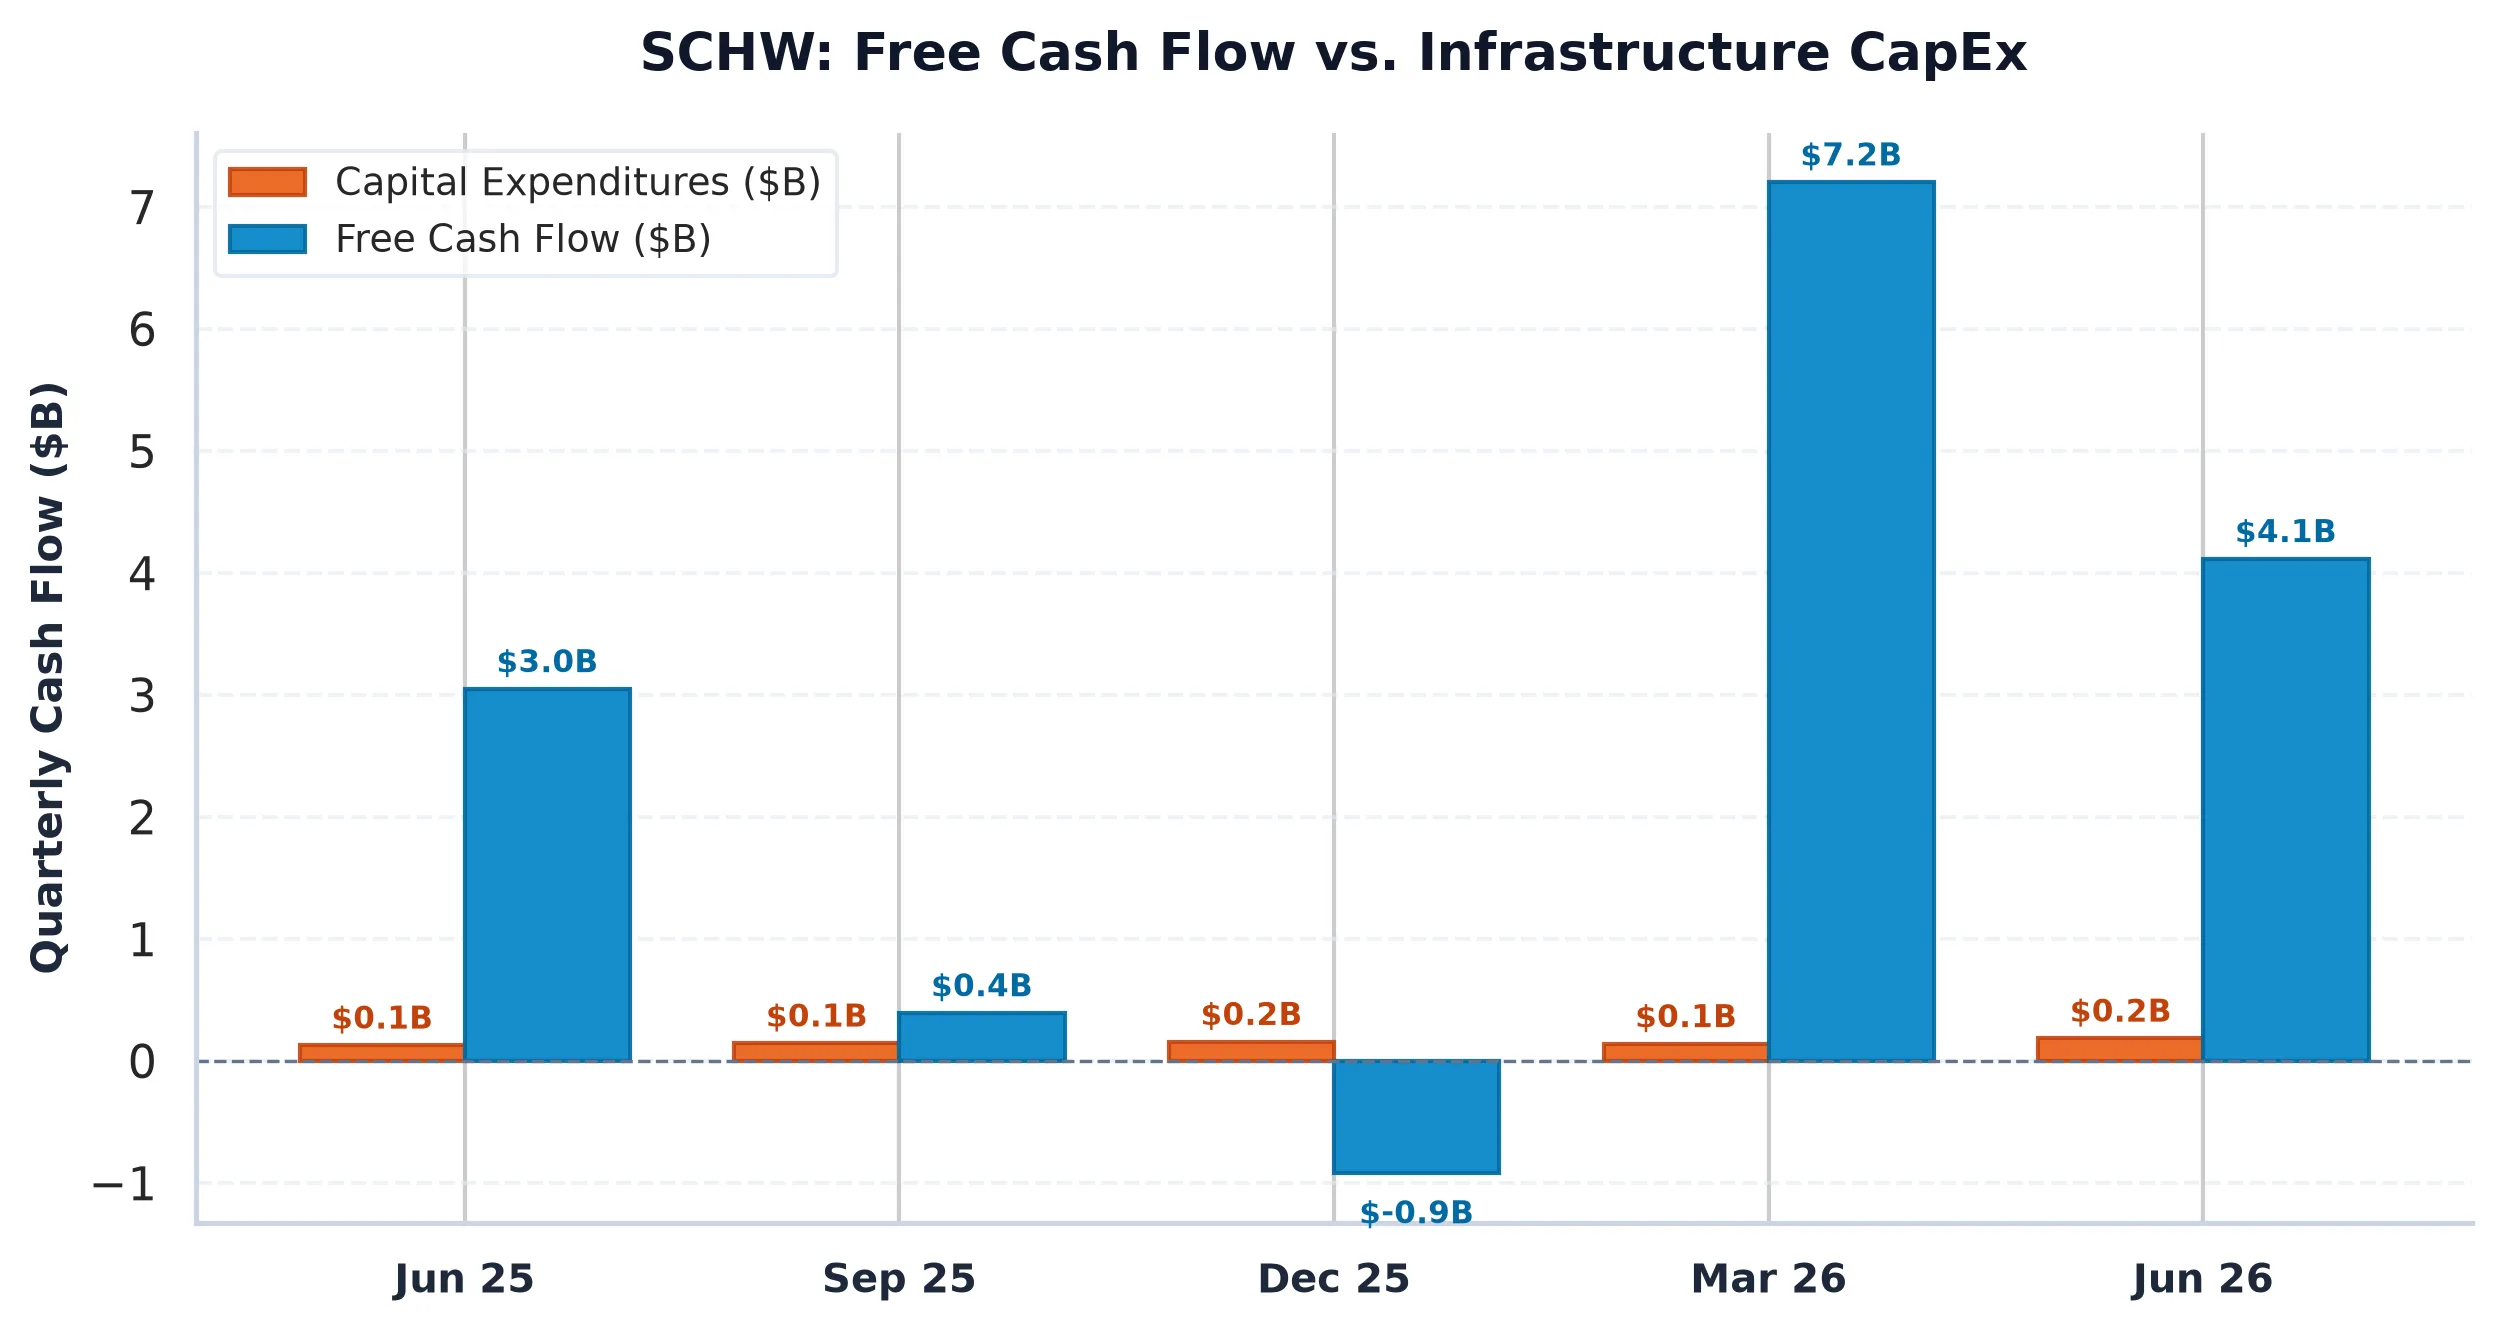
From a fundamental perspective, Schwab is trading at a forward P/E of 11.96x. In a world where the risk-free rate is 5.09%, an earnings yield of roughly 8.36% provides a respectable 327 basis point spread. This is not exactly “deep value,” but for a firm with a 20.27% Return on Equity and 20.9% revenue growth, it suggests the market is still pricing in some skepticism regarding “cash sorting” (the tendency of clients to move money from low-yield sweep accounts into higher-yielding money market funds).
However, the real story this morning is the market structure. The options market for The Charles Schwab Corporation is currently exhibiting a state of pure, unadulterated bullishness, or perhaps, pure complacency. The Put/Call Open Interest ratio sits at a staggering 0.01. For those who don’t spend their days staring at dealer inventory models, this means that for every 100 call contracts, there is exactly one put contract.
This extreme skew creates a precarious plumbing situation. There is a massive Call Wall at $135 (92 contracts in the front months) and secondary resistance at $75. With the stock at $94.16, the Max Pain strike of $50 is nearly 47% below the current spot. This massive gap suggests that the options market is essentially ignoring the possibility of a downside move. If the stock fails to maintain its upward momentum, dealers who are long delta to hedge those calls will be forced to sell, creating a mechanical air pocket.
The Charles Schwab Corporation remains a high-quality compounder, but when the options market stops buying insurance entirely, it usually pays to check the exits.
| Metric | Value |
|---|---|
| Current Price | $94.16 |
| Forward P/E | 11.96x |
| Operating Margin | 52.28% |
| Put/Call OI Ratio | 0.01 |
| Primary Call Wall | $135.00 |
📊 AllWallSt Investment Verdict
| Company / Ticker | Rating | Word/Horizon |
|---|---|---|
| The Charles Schwab Corporation (SCHW) | HOLD | 12-18 Months |
Conviction rating derived from quantitative fundamental models, options open interest distribution, and primary SEC filing review.
The Charles Schwab Corporation (SCHW)
Trailing P/E
Marcus Wolfe Screen
Leverage Profile
30D Channel
Pristine cash flow conversion (1.05x) and healthy accrual ratio (-0.09%). Zero accounting anomalies detected (LOW ANOMALY RISK).
Tier 1 Regulatory Capital & Liquidity Coverage Ratio (LCR) compliant; balance sheet governed by Basel III capital buffers.
Evaluated against 5.10% US 10-Yr Benchmark; bank net interest margins sensitive to yield curve slope (2s10s spread) and deposit beta.
Max Pain: $96.00 (+4.39%) | P/C Ratio: 0.82 | 30D Channel: $85.37 – $98.55.
$84.60 – $88.28 (-4% to -8% Pullback Accumulation)
Sustained weekly close below $82.76 (-10.0% structural stop) or fundamental cash flow deterioration.