
⚡ Executive Morning Takeaways
- Overnight Futures & Rates Impulse: Equity futures are signaling a tech-led recovery with Nasdaq 100 futures (NQ=F) climbing +0.96% ahead of the open. The 10-Year Treasury yield remains the structural ceiling for valuations, currently hovering at 5.10% as markets digest a heavy sovereign auction schedule.
- Sector Rotation Leaders & Laggards: Capital is seeking shelter in Energy (XLE) and Industrials (XLI), while the Financials (XLF) sector is seeing significant outflows, dropping -1.91% as credit concerns and yield curve shifts weigh on bank balance sheets.
- Primary Corporate Catalyst: Target Corporation (TGT) enters the earnings arena this morning with shares up +2.18% in pre-market trading. Despite the bounce, a speculative call-heavy options skew and a negative spread against risk-free yields suggest the market is demanding perfection from Michael Fiddelke’s strategy.
🌐 Pre-Market Macro, Futures & Rates Dashboard
| Asset / Benchmark | Ticker | Current Price / Level | Change (%) | 52-Week Low | 52-Week High |
|---|---|---|---|---|---|
| E-Mini S&P 500 Futures (ES=F) | ES=F | $7393.25 | +0.47% | $6353.25 | $7897.50 |
| E-Mini Nasdaq 100 Futures (NQ=F) | NQ=F | $27334.50 | +0.96% | $22961.50 | $31616.50 |
| S&P 500 (SPY) | SPY | $732.44 | -1.01% | $629.28 | $781.62 |
| Nasdaq 100 (QQQ) | QQQ | $656.95 | -0.73% | $555.60 | $762.86 |
| Russell 2000 (IWM) | IWM | $269.05 | -1.43% | $228.90 | $305.18 |
| 20+ Year Treasury (TLT) | TLT | $79.55 | +0.21% | $76.43 | $90.86 |
| High Yield Corporate (HYG) | HYG | $76.63 | -0.13% | $76.39 | $81.24 |
| Gold (GLD) | GLD | $352.48 | -0.13% | $351.96 | $509.70 |
| WTI Crude Oil (CL=F) | CL=F | $83.81/bbl | -0.99% | $54.98 | $119.48 |
| US Dollar Index Bullish (UUP) | UUP | $29.54 | -0.07% | $26.40 | $29.57 |
| CBOE Volatility Index (^VIX) | ^VIX | 23.95 | -5.93% | 13.38 | 35.30 |
| 2-Yr US Treasury Yield (2YY=F) | 2YY=F | 4.75% | +0.00% | 3.38% | 4.88% |
| 10-Yr US Treasury Yield (^TNX) | ^TNX | 5.10% | -0.35% | 3.96% | 5.36% |
The macro environment is currently defined by a tug-of-war between resilient tech earnings and the gravity of the 5.10% 10-Year Treasury yield. While the VIX has retreated nearly 6% to 23.95, signaling a brief pause in the recent volatility, the equity risk premium remains historically thin. When risk-free government debt pays over 5%, the hurdle for owning discretionary retail stocks becomes exceptionally high.
Crude oil (CL=F) drifting lower toward $83.81 provides a marginal tailwind for consumer wallet share, but it is not enough to offset the broader tightening of financial conditions. Institutional desks are focused on today’s 20-year Treasury auction, which will serve as a definitive test of global appetite for long-duration US paper.
📊 Sector Rotation Leaders & Laggards
| Rotation Rank | Sector ETF | Ticker | Price | Change (%) | Trailing P/E | Dividend Yield | 52-Week Low | 52-Week High |
|---|---|---|---|---|---|---|---|---|
| Leader (#1) | Energy (XLE) | XLE | $63.36 | -0.52% | 15.8x | 2.18% | $43.77 | $70.15 |
| Leader (#2) | Industrials (XLI) | XLI | $164.75 | -0.55% | 26.4x | 1.13% | $147.14 | $188.19 |
| Leader (#3) | Consumer Discretionary (XLY) | XLY | $117.10 | -0.89% | 24.5x | 0.81% | $105.19 | $125.01 |
| Laggard (#8) | Communication Services (XLC) | XLC | $105.26 | -1.46% | 16.7x | 1.38% | $99.33 | $120.41 |
| Laggard (#9) | Utilities (XLU) | XLU | $43.42 | -1.59% | 17.9x | 2.79% | $39.03 | $47.80 |
| Laggard (#10) | Financials (XLF) | XLF | $57.07 | -1.91% | 15.4x | 1.46% | $47.67 | $60.04 |
The rotation data reveals a defensive undercurrent. Energy (XLE) remains the relative leader despite a flat performance, as its 15.8x P/E offers a valuation cushion that the broader index lacks. In contrast, Financials (XLF) are the primary laggards, suggesting that the “higher for longer” rate regime is beginning to pinch bank margins and loan demand.
Consumer Discretionary (XLY) is holding up better than the defensive Utilities (XLU), but this is largely a function of concentration in a few mega-cap names rather than broad-based retail strength. For a mid-tier operator like Target Corporation, this dispersion creates a difficult backdrop where they must compete for a shrinking pool of “fun” spending.
⏱️ Today’s Earnings & Economic Radar
Imminent Corporate Earnings Releases
| Company / Ticker | Timing | Consensus EPS | Consensus Revenue | Key Strategic Theme |
|---|---|---|---|---|
| Palo Alto Networks (PANW) | Today (Nov 18) | $0.97 | $3.31B | Platformization Billings & Next-Gen Security ARR |
| Target (TGT) | Today (Nov 18) | $2.08 | $26.54B | Discretionary Apparel/Home Basket Size & Inventory Shrink |
| Alibaba Group (BABA) | Tomorrow (Nov 19) | $11.03 | $269.85B | Cloud Intelligence AI Compute Demand & Domestic E-Commerce GMV |
| Home Depot (HD) | Yesterday (Reported) | $2.83 | $39.17B | Pro-Contractor Backlog vs High-Rate Big-Ticket Remodeling |
High-Impact Economic Data & Central Bank Actions
| Time (ET) | Event | Impact | Key Institutional Focus |
|---|---|---|---|
| 08:30 AM | US Housing Starts / Durable Goods Orders | HIGH | Non-Defense Capital Goods ex-Aircraft |
| 10:30 AM | EIA Weekly Petroleum Status Report | HIGH | Commercial Inventory Draw/Build |
| 01:00 PM | US 20-Year Treasury Bond Auction | HIGH | Long-End Sovereign Supply Absorption |
Today’s focus is split between the consumer and the sovereign. Target’s report will provide the ground-truth on whether households are still willing to pay a premium for the “Target experience” or if they are migrating toward Walmart’s grocery-heavy value proposition. Meanwhile, the 1:00 PM Treasury auction will dictate whether the 5.10% yield level is a floor or a ceiling.
🎯 Pre-Market Spotlight: Target Corporation (TGT)
Target Corporation (TGT) finds itself in a classic retail squeeze. The company is trading at a forward P/E of 16.6x, which might look like a bargain compared to Walmart’s 39.5x, but that discount exists for a reason. Target is heavily indexed to discretionary categories like apparel and home decor: items people buy when they feel rich, not when they are paying 7% on a mortgage. While the pre-market quote of $162.98 shows optimism, the fundamental math is unforgiving. The company’s Free Cash Flow yield of 4.74% is currently lower than the risk-free 10-Year Treasury yield of 5.10%, creating a negative spread that makes the stock a difficult “buy” for institutional managers who can get a higher return from government bonds.
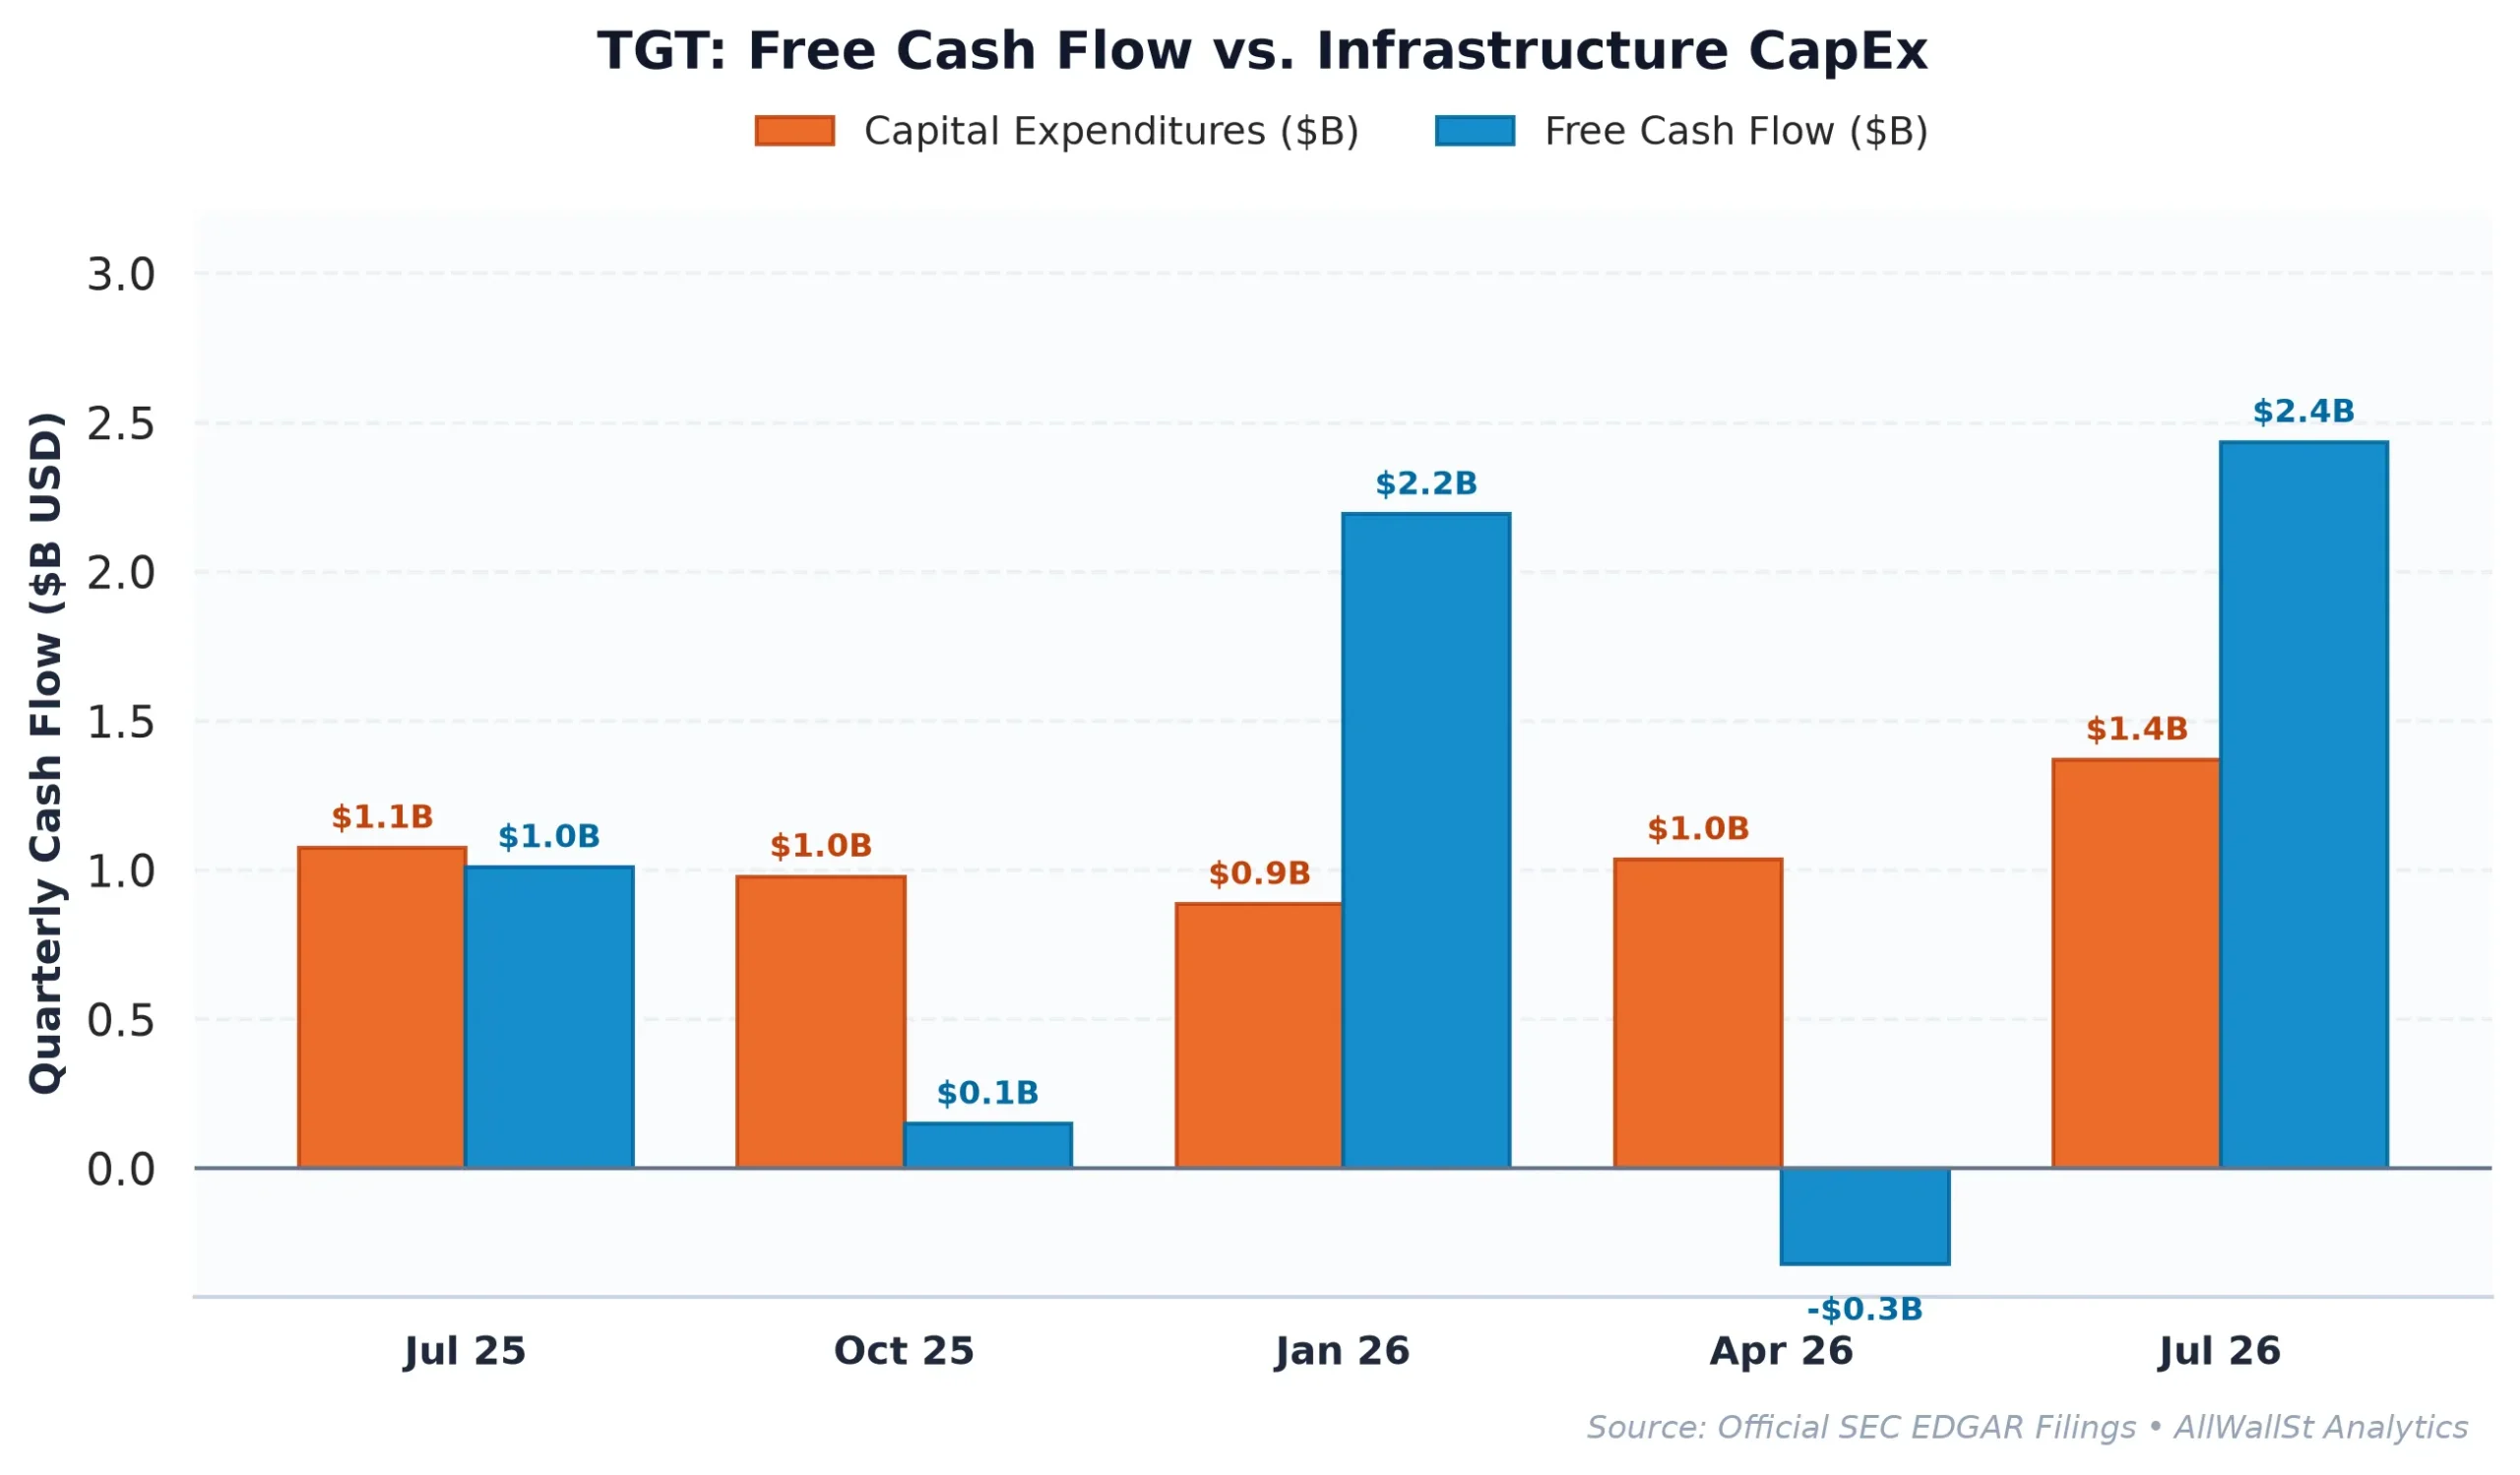
The market structure for Target Corporation is leaning into a speculative call overhang. With a Put/Call ratio of 0.42, the options market is crowded with upside bets, particularly at the $170 Call Wall. This creates a reflexive risk: if the earnings report is merely “good” rather than “spectacular,” those call options will lose value, forcing dealers to sell the underlying shares they bought to hedge those positions. Furthermore, the “Max Pain” strike sits at $150, nearly 6% below current levels. In the plumbing of the market, this acts as a magnetic anchor that could pull the price lower if the post-earnings momentum stalls.
Target’s board is clearly aware of the need to sharpen its brand, as evidenced by the recent appointment of Sally Grimes, the former CEO of Diageo North America, to the board. As noted in the November 12 Form 8-K, Grimes will serve on the Audit & Risk and Infrastructure & Finance committees, bringing experience in “turning consumer trends into compelling products.” This is a long-term fix for a short-term problem: Target’s operating margin of 5.03% is respectable but pales in comparison to the 12.2% managed by TJX Companies, which thrives on the very inventory clearance that Target is trying to avoid.
Investment Committee Steelman Dissent: The bull case rests on the idea that Target has successfully “cleansed” its inventory, and any stabilization in discretionary spending will lead to a massive earnings beat against low expectations. If the company shows it can control “inventory shrink” (retailer-speak for theft and loss) better than peers, the current speculative call skew could transform into a violent short-covering rally toward $180.
AllWallSt Investment Verdict: HOLD
Target Corporation (TGT)
Trailing P/E
Marcus Wolfe Screen
Leverage Profile
30D Channel
Dealer Gamma Pinning & Max Pain Alignment (TGT)
🎯 Max Pain: $150.00
Spot $159.53
Ceiling $170C Resistance ▲
MODERATE WATCHLIST (1 flag): Receivables growth outstripped revenue growth by >15%, pointing to potential revenue recognition or collection friction.
Prudent Leverage (1.60x Net Debt/EBITDA); well within investment-grade covenant headroom.
Negative yield spread (-0.37% vs 5.10% Treasury); equity requires robust multiple expansion or growth.
Max Pain: $150.00 (-5.97%) | P/C Ratio: 0.42 | 30D Channel: $138.66 – $180.40. Dealer gamma bounded between $150 Put Wall and $170 Call Wall.
TGT carries standard index weighting (< 0.6% SPY footprint); sell-side consensus reflects standard earnings momentum rather than index-tracking mandates.
Accumulation Deferred (Await Pullback toward $147.00 – $153.00 Support Pinning)
Sustained weekly close below $150.00 (Put Wall) or acceleration in margin compression.
IC Counter-Thesis: While our neutral stance balances 16.6x trailing earnings and 4.74% FCF yield against a 5.10% 10-year yield hurdle (1.60x Net Debt/EBITDA), a decisive breakout above $170 on accelerating earnings revisions could leave sidelined capital underexposed. Conversely, a breach of $150 would confirm that valuation support is illusory alongside 1 flagged accrual anomalies.
Sources & References
- Official SEC Form 10-K Annual Report (Filed 2026-03-11)
- Official SEC Form 10-Q Quarterly Report (Filed 2026-08-28)
- SEC Form 8-K Primary Filing Body (2026-08-14)
- SEC Form 8-K Exhibit 99.x (2026-11-12)
- SEC DEF 14A Proxy / M&A Filing (2026-04-27)
- Federal Docket: Parekh v. Target Corporation (2026-11-17)
- SEC EDGAR: Target Corporation (CIK: 0000027419) Browse Filings
- Target Investor Relations: Corporate Portal
- SEC Form 8-K (Filed 2026-11-12): Board Appointment Disclosure
Regulatory Disclaimer: This report is for information purposes only and does not constitute investment advice or a solicitation to buy or sell any securities. AllWallSt and its analysts are not registered investment advisors. Financial markets involve significant risk, and past performance is not indicative of future results. Always consult with a qualified financial professional before making investment decisions. Data provided by primary SEC filings and market feeds; accuracy is not guaranteed.