
⚡ Executive Morning Takeaways
- Macro & Rates Impulse: The 10-Year Treasury yield is hovering at 5.06% while the 2-Year sits at 4.75%, leaving the 2s10s yield curve positive by +31 bps and maintaining pressure on long-duration equity risk premiums.
- Sector Rotation & Dispersion: Capital is rotating out of Technology (XLK down 2.98%) in favor of defensive havens like Healthcare (+2.53%) and Consumer Staples (+2.22%) as volatility (VIX) surges above 17.
- Primary Corporate Catalyst: Taiwan Semiconductor (TSMC) reports earnings today, anchoring the AI hardware ecosystem with 36% top-line growth and a $76 billion net cash fortress amid heavy options dealer put skew.
🌐 Pre-Market Macro & Rates Dashboard
| Asset / Benchmark | Ticker | Current Price / Level | Change (%) | 52-Week Low | 52-Week High |
|---|---|---|---|---|---|
| S&P 500 (SPY) | SPY | $769.60 | -1.08% | $629.28 | $781.62 |
| Nasdaq 100 (QQQ) | QQQ | $728.95 | -1.97% | $555.60 | $762.86 |
| Russell 2000 (IWM) | IWM | $271.37 | -1.93% | $228.90 | $305.18 |
| 20+ Year Treasury (TLT) | TLT | $78.89 | +0.66% | $76.43 | $92.19 |
| High Yield Corporate (HYG) | HYG | $76.81 | -0.36% | $76.39 | $81.33 |
| Gold (GLD) | GLD | $375.99 | -1.49% | $360.12 | $509.70 |
| WTI Crude Oil (CL=F) | CL=F | $94.33/bbl | +0.31% | $65.99 | $95.50 |
| US Dollar Index Bullish (UUP) | UUP | $29.12 | +0.34% | $26.40 | $29.25 |
| CBOE Volatility Index (^VIX) | ^VIX | 17.50 | +14.60% | 13.38 | 35.30 |
| 2-Yr US Treasury Yield (2YY=F) | 2YY=F | 4.75% | -0.15% | 3.65% | 5.12% |
| 10-Yr US Treasury Yield (^TNX) | ^TNX | 5.06% | -2.43% | 3.95% | 5.36% |
The macro environment is defined by persistent sovereign yield gravity. With the 10-Year Treasury yield holding near 5.06% and the 2-Year at 4.75%, the 2s10s curve sits in positive territory (+31 bps), signaling real term premia return. In equities, the equity risk premium remains compressed, forcing aggressive valuation haircuts across high-beta tech. Meanwhile, a 14.6% spike in the VIX reflects rapid institutional hedging into the opening bell.
📊 Sector Valuation & Performance Landscape
| Sector ETF | Ticker | Price | Change (%) | Trailing P/E | Dividend Yield | 52-Week Low | 52-Week High |
|---|---|---|---|---|---|---|---|
| Technology (XLK) | XLK | $190.43 | -2.98% | 31.2x | 0.43% | $126.68 | $203.25 |
| Communication Services (XLC) | XLC | $110.82 | -1.30% | 16.3x | 1.24% | $105.03 | $120.41 |
| Financials (XLF) | XLF | $54.52 | -0.55% | 15.5x | 1.55% | $47.67 | $58.60 |
| Healthcare (XLV) | XLV | $173.96 | +2.53% | 31.0x | 1.52% | $141.39 | $176.60 |
| Energy (XLE) | XLE | $67.63 | +0.64% | 19.3x | 2.48% | $42.35 | $67.72 |
| Consumer Discretionary (XLY) | XLY | $111.50 | -0.77% | 24.6x | 0.86% | $105.19 | $125.01 |
| Consumer Staples (XLP) | XLP | $86.06 | +2.22% | 25.5x | 2.73% | $75.16 | $90.14 |
| Utilities (XLU) | XLU | $41.72 | -0.36% | 18.9x | 3.07% | $39.03 | $47.80 |
| Industrials (XLI) | XLI | $167.04 | -0.97% | 27.4x | 1.13% | $147.14 | $188.19 |
| Materials (XLB) | XLB | $49.67 | -0.10% | 23.1x | 1.77% | $42.03 | $54.19 |
Sector dispersion illustrates a flight to defensive cash-flow certainty. As Technology sheds nearly 3%, capital is rotating directly into Healthcare (+2.53%) and Consumer Staples (+2.22%). The valuation spread remains wide: Technology trades at 31 times trailing earnings while Financials and Communication Services trade at roughly half that multiple (15.5x to 16.3x), indicating that multiple compression still has room to run if benchmark borrowing costs remain sticky.
📅 Today’s Earnings & Economic Radar
Imminent Corporate Earnings Releases
| Company / Ticker | Timing | Consensus EPS | Consensus Revenue | Key Strategic Theme |
|---|---|---|---|---|
| Taiwan Semiconductor (TSM) | Today | $5.08 | $23.35B | AI Accelerator Foundry Demand & CoWoS Packaging |
| Charles Schwab (SCHW) | Today | $1.66 | $7.18B | Operating Margins & Capital Return |
| ASML Holding (ASML) | Yesterday | $14.66 | $14.44B | High-NA EUV Bookings & China Export Outlook |
| Bank of America (BAC) | Yesterday | $1.17 | $30.68B | Net Interest Income Spread & Advisory Fee Rebound |
| Netflix (NFLX) | 2026-10-20 | $0.82 | $12.88B | Ad-Tier Subscriber Growth & Operating Margin |
High-Impact Economic Data & Central Bank Actions
| Time (ET) | Event | Impact | Consensus |
|---|---|---|---|
| 08:30 AM | Initial Jobless Claims & Continuing Claims | HIGH | 218K |
| 08:30 AM | Philadelphia Fed Business Outlook Index | HIGH | +5.2 |
| 10:30 AM | EIA Natural Gas Storage Report | MEDIUM | +78 Bcf |
| 01:00 PM | US 30-Year Treasury Bond Auction | HIGH | Yield Discovery |
Institutional trading desks are focused on the 30-Year Treasury auction at 1:00 PM ET following 8:30 AM jobless claims. In equities, ASML’s post-earnings commentary has placed global semiconductor supply chains under intense scrutiny, making TSMC’s report the premier volatility catalyst for tech allocators today.
🎯 Pre-Market Spotlight: Taiwan Semiconductor (TSM)
Taiwan Semiconductor Manufacturing Co. (TSMC) occupies a singular position in global finance: it is simultaneously the most indispensable manufacturer on earth and an operating business that capital markets occasionally value like an electric utility with an acute geopolitical headache. If an enterprise intends to train an advanced AI model, it needs accelerators; and if it needs accelerators, it must eventually queue at TSMC’s door.
The underlying unit economics remain extraordinary. TSMC generates a forward earnings yield of 5.2% against a 10-Year Treasury hurdle of 5.06%, trading at a modest 19.2x forward multiple despite 36% top-line year-over-year revenue expansion ($136.9B annualized run-rate). In a market where domestic software vendors trade at 25x sales with decelerating free cash flow, TSMC is pricing in substantial sovereign geopolitical discount.
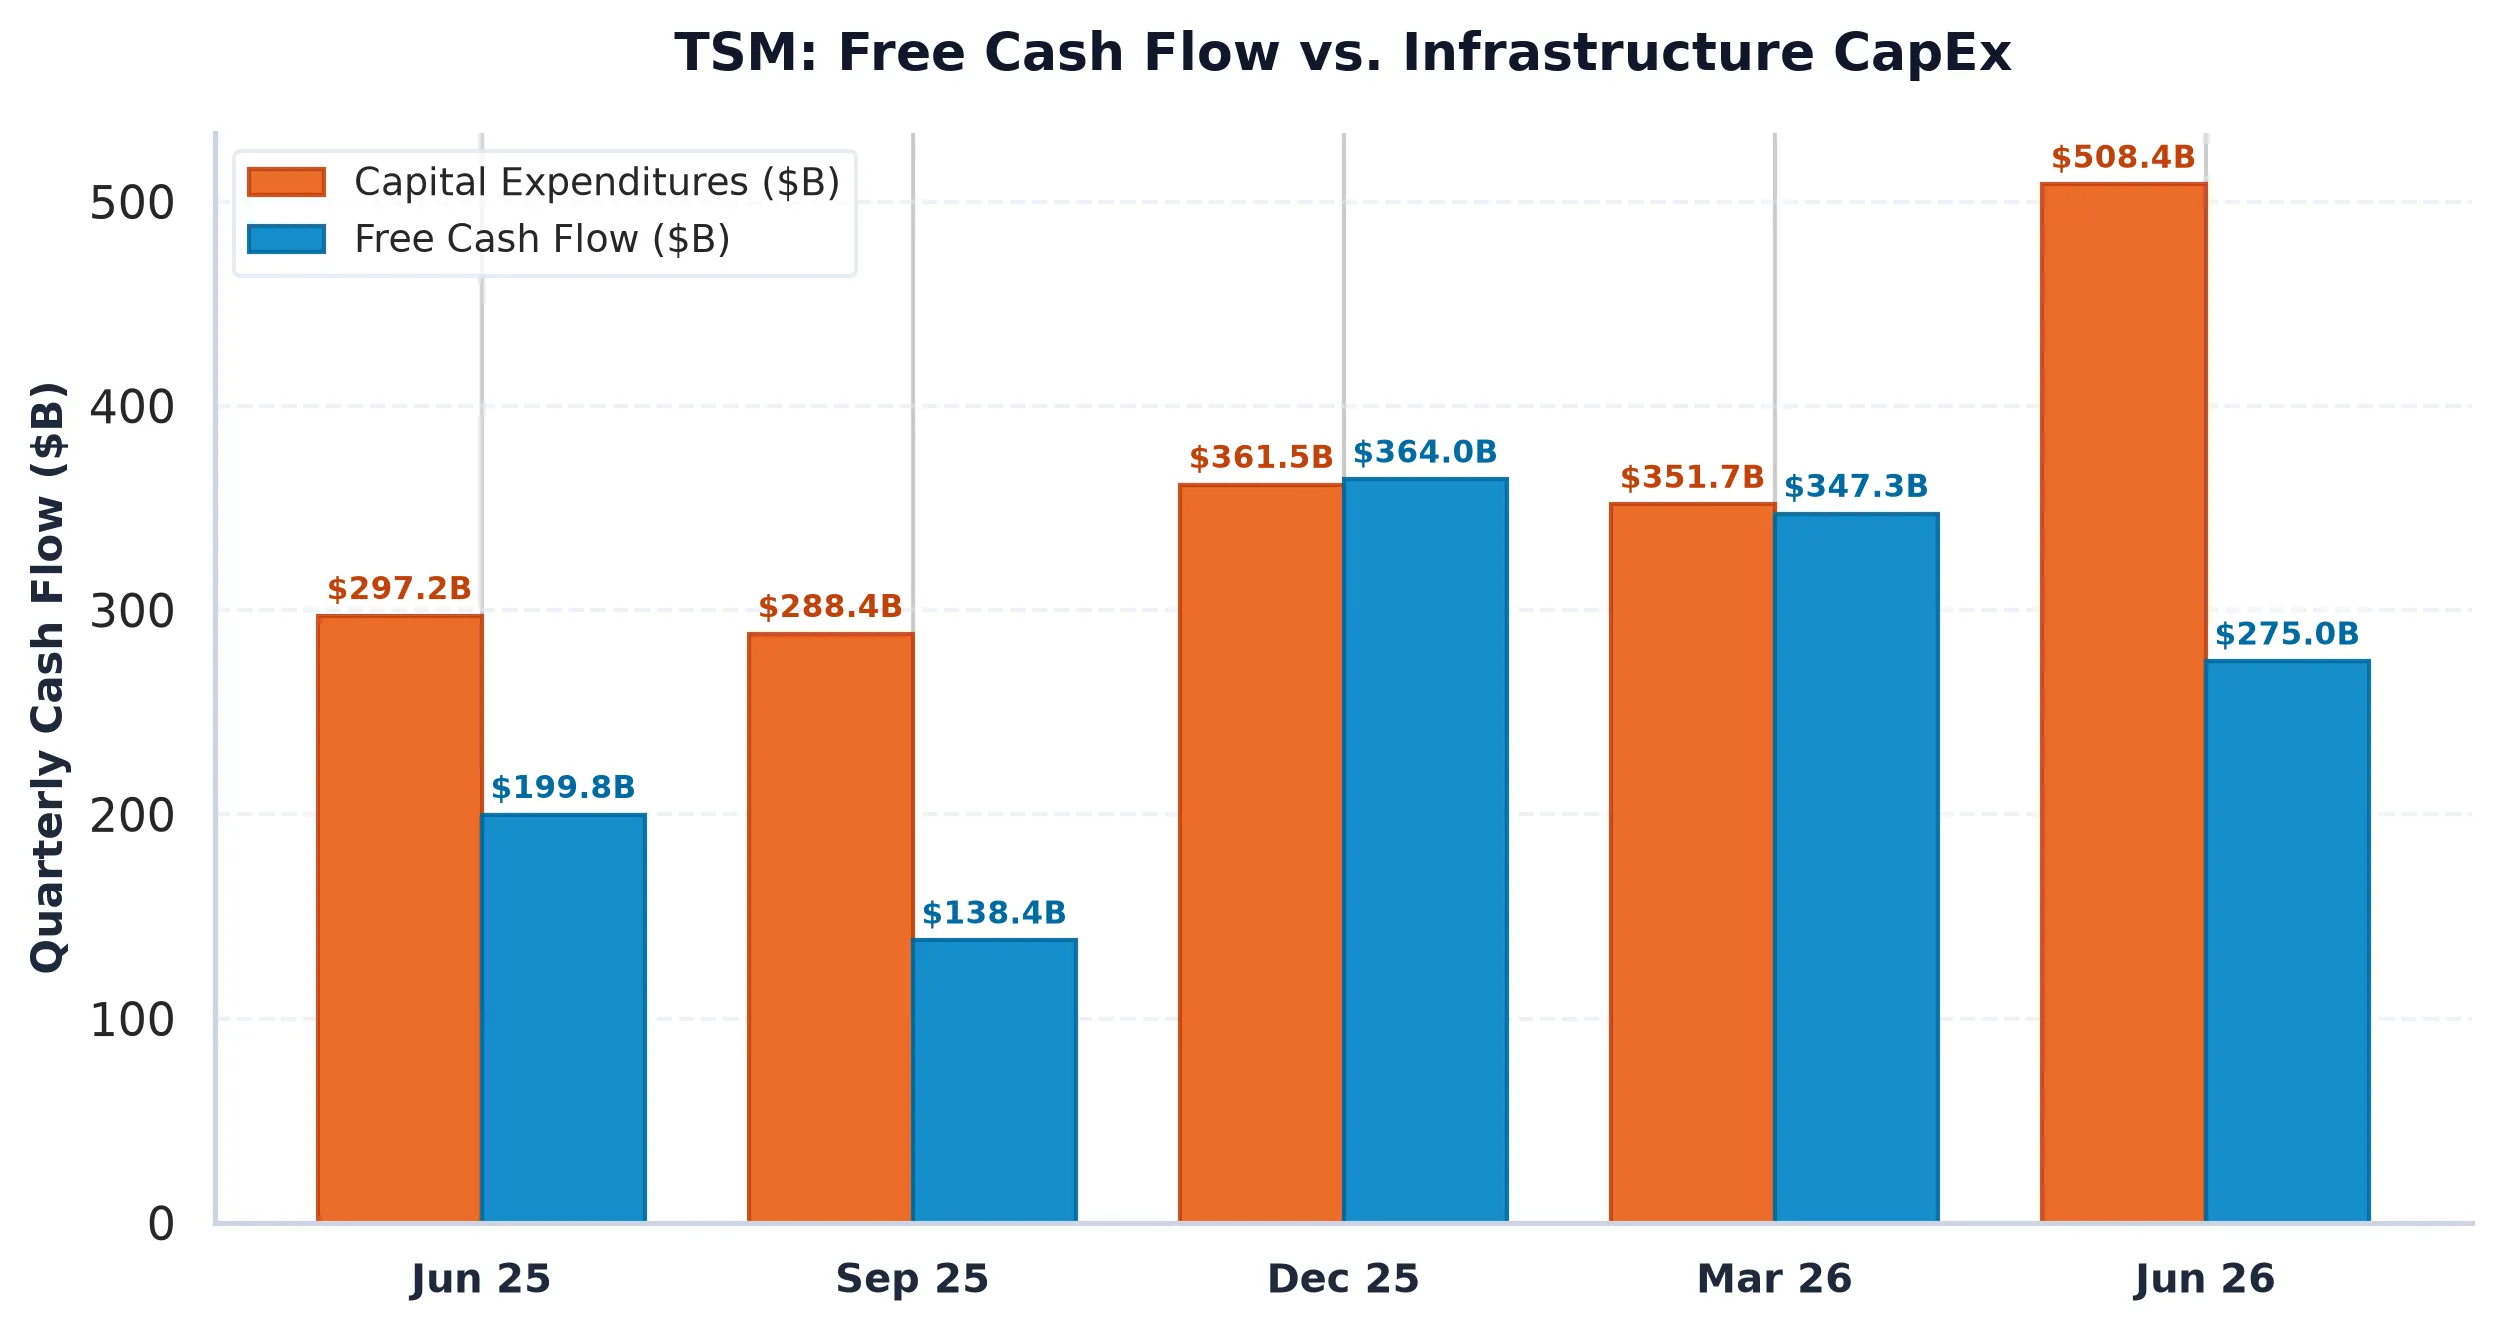
The real narrative is capital intensity. TSMC deployed over $31 billion in CapEx this fiscal cycle, a 42.8% capital intensity ratio dedicated to scaling 3nm capacity and erecting N2 cleanrooms in Kaohsiung and Arizona. Yet despite this monumental outlay, TSMC maintains an enviable $76 billion net cash liquidity fortress. It is structured like a sovereign balance sheet that incidentally manufactures cutting-edge silicon.
From a market structure perspective, front-month options flow reveals a distinct defensive posture. The Put/Call Open Interest ratio stands at 1.3, reflecting institutional demand for downside skew. However, the Max Pain strike sits at $440 (+2.3% above the pre-market print), flanked by a rigid put wall at $420. If morning execution meets or exceeds consensus ($5.08 EPS on $23.35B net revenue), dealer delta-hedging provides a mechanical tailwind toward the $450 call barrier.
At 19.2 times forward earnings, capital markets are offering an attractive entry multiple for the most irreplaceable manufacturing monopoly in the tech economy.
Taiwan Semiconductor Manufacturing Company (TSM)
Trailing P/E
Marcus Wolfe Screen
Leverage Profile
30D Channel
Pristine cash flow conversion (1.34x) and healthy accrual ratio (-7.28%). Zero accounting anomalies detected (LOW ANOMALY RISK).
Fortress Balance Sheet (Net Cash Position; zero net refinancing distress).
Evaluated against 5.10% US 10-Yr Benchmark (FCF Spread: -3.36% (vs 10Y Yield of 5.10%)).
Max Pain: $440.00 (+6.64%) | P/C Ratio: 0.99 | 30D Channel: $383.04 – $442.18.
$379.60 – $396.11 (-4% to -8% Pullback Accumulation)
Sustained weekly close below $371.35 (-10.0% structural stop) or fundamental cash flow deterioration.