
The prevailing narrative in the semiconductor industry for the last two years has been remarkably simple: if you build a chip that can multiply matrices quickly, people will hand you suitcases of cash until you run out of chips. NVIDIA Corporation (NVDA) has been the primary beneficiary of this arrangement, transforming from a high-end gaming hardware provider into the structural foundation of the global compute economy. However, the market is currently grappling with a classic industrial problem: the difference between ordering a machine and actually plugging it into the wall.
The Nasdaq recently tumbled 5% as a wave of skepticism washed over the hyperscaler trade. The anxiety is not that the demand for artificial intelligence has vanished, but rather that the physical infrastructure required to house these chips (data centers, power substations, and cooling systems) cannot keep pace with the silicon delivery schedule. This creates what we call a CapEx air pocket. If a cloud provider has ten billion dollars worth of H100s sitting in a warehouse because the local utility company cannot provide enough megawatts to turn them on, that provider will eventually stop clicking the buy button.
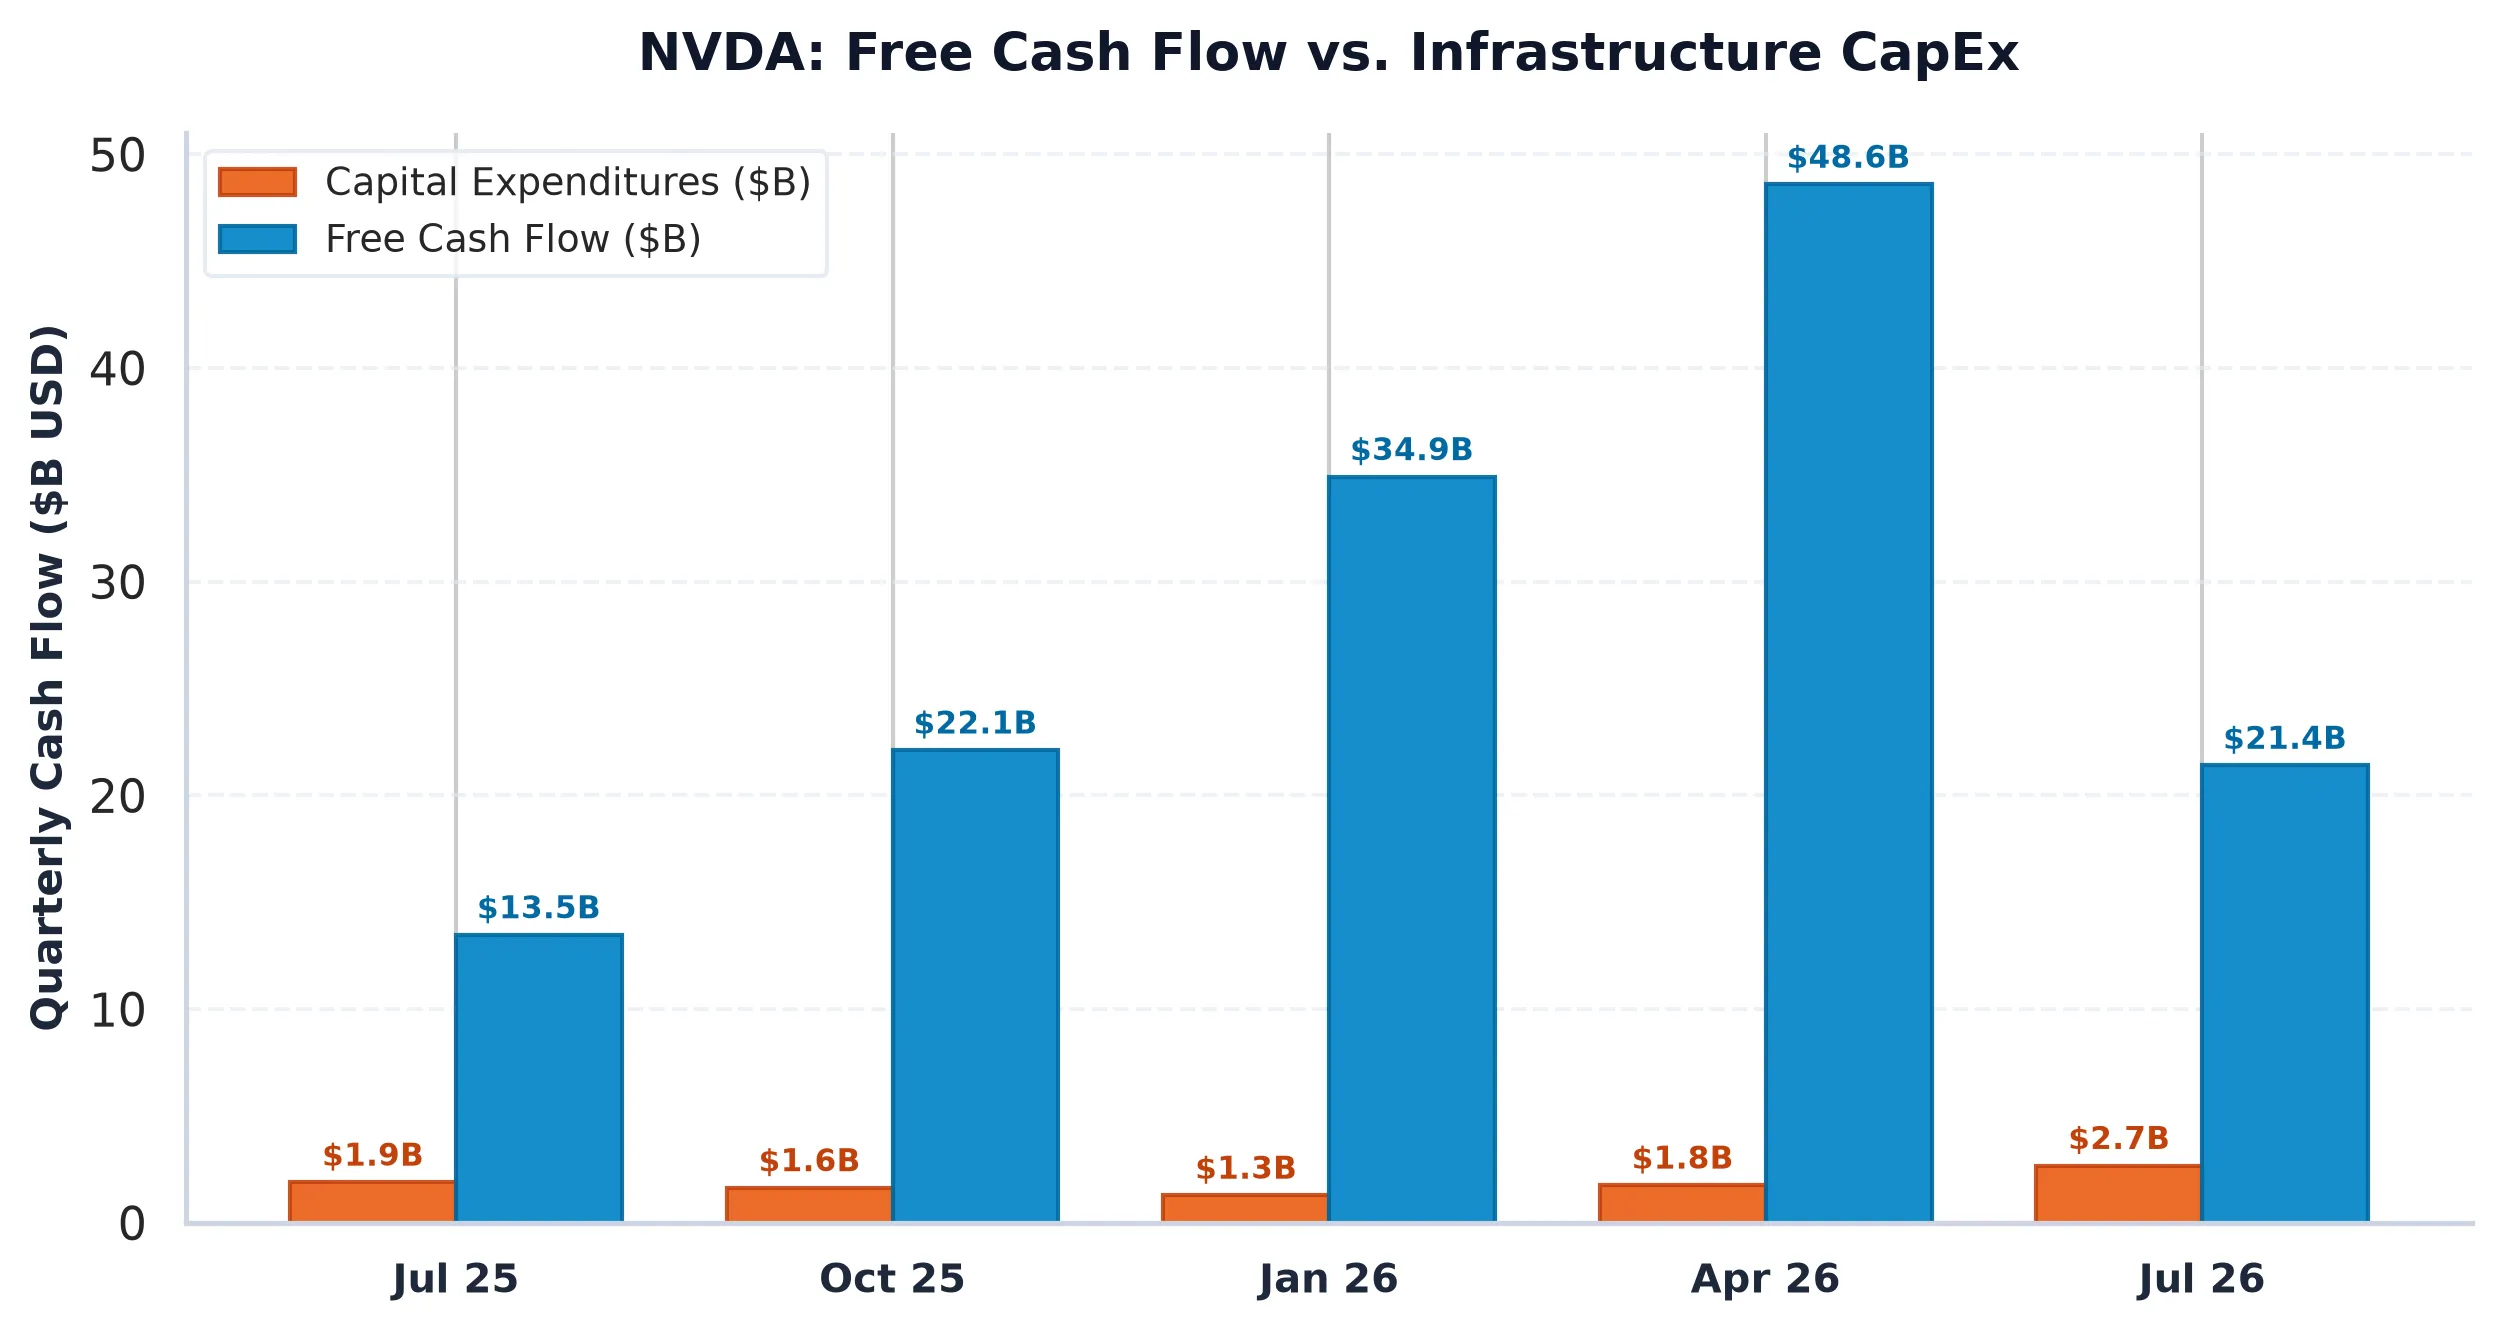
The Cash Flow Asymmetry
When you look at the fundamental trajectory of NVIDIA Corporation, the numbers look like they were generated by a malfunctioning spreadsheet. Revenue jumped from $26.97 billion in FY2023 to a projected $215.94 billion in FY2026. Operating margins have expanded from 20.7% to over 60%. In a vacuum, a company growing revenue at 105% with a forward P/E of 11.4x is a statistical anomaly that should not exist in an efficient market. For context, Advanced Micro Devices (AMD) trades at 24.8x forward earnings while growing at less than half the rate.
The friction, however, lies in the cash. While the accounting earnings are astronomical, the Free Cash Flow (FCF) yield is a modest 0.95%. When you strip out stock-based compensation, the real FCF yield drops to 0.81%. In an environment where the US 10-Year Treasury offers a risk-free 5.10%, the equity risk premium for Nvidia is deeply negative. Investors are essentially paying a massive premium for the privilege of owning the growth, while the actual cash generated is being plowed back into $92.55 billion of capital expenditures. This is the price of maintaining a 77.19% Return on Invested Capital: you have to keep investing the capital.
The Integration Bottleneck and Inventory Risk
The second-order risk that the mainstream wires are just beginning to price is the inventory buildup. Historically, semiconductor cycles do not end because people stop wanting chips: they end because people have too many of them. If hyperscalers enter a digestion phase to integrate the current generation of hardware, Nvidia faces a sudden inventory overhang.
The company currently enjoys a gross margin of 74.67%. That margin is a function of extreme scarcity. If the air pocket manifests and lead times for Blackwell architecture chips collapse, the pricing power shifts back toward the buyers. We have seen this movie before in the memory markets, where Taiwan Semiconductor (TSM) and others have had to navigate sudden shifts in utilization. While Nvidia is an architectural titan, not just a commodity manufacturer, it is still subject to the laws of supply chain physics.
Peer Dynamics and Multiple Compression
Comparing NVIDIA Corporation to its peers reveals a striking divergence in how the market prices AI infrastructure. Broadcom (AVGO) carries an EV/EBITDA of 30.4x with a 2.20% FCF yield, reflecting a more diversified, software-heavy portfolio that the market perceives as less volatile. Nvidia, despite its dominant 66.24% operating margin, is being treated with the skepticism usually reserved for cyclical hardware.
| Company (Ticker) | Market Cap | Forward P/E | Operating Margin | FCF Yield |
|---|---|---|---|---|
| NVIDIA (NVDA) | $4.39T | 11.4x | 66.24% | 0.95% |
| AMD | $663.3B | 24.8x | 21.2% | 1.11% |
| Broadcom | $1.39T | 15.0x | 54.3% | 2.20% |
| TSMC | $1.83T | 15.1x | 58.7% | 1.99% |
The market is essentially saying that it does not believe the 11.4x forward P/E is sustainable because the “E” (Earnings) is at a peak-cycle level that might normalize downward if CapEx budgets are exhausted or paused.
Market Structure and the Gamma Floor
From a quantitative perspective, the options market is currently acting as a stabilizer. The Put/Call Open Interest ratio stands at 0.76, suggesting a healthy but not euphoric level of speculation. More importantly, the current price of $181.60 is hovering just above a significant Put Wall at $180. In market plumbing terms, this means dealers are likely long gamma near these levels, which should dampen volatility and provide a structural floor.
However, the Max Pain strike sits way up at $207.50. This 14.26% gap suggests that while the long-term fundamentalists are worried about the CapEx air pocket, the immediate positioning of the options market is caught offside. If the panic sell-off stabilizes, the mechanical unwinding of hedges could pull the stock back toward that $200 level. But for now, the gravitational pull of the 5.10% Treasury yield is winning the tug-of-war against Nvidia’s growth-adjusted valuation.
AllWallSt Investment Verdict: HOLD
NVIDIA Corporation (NVDA)
Trailing P/E
Marcus Wolfe Screen
Leverage Profile
30D Channel
MODERATE WATCHLIST (1 flag): Inventory growth outpaced COGS growth by >15%, signaling potential inventory bloat or pending margin compression.
Fortress Balance Sheet (Net Cash Position; zero net refinancing distress).
Negative yield spread (-3.88% vs 5.10% Treasury); equity requires robust multiple expansion or growth.
Max Pain: $207.50 (+14.26%) | P/C Ratio: 0.76 | 30D Channel: $146.39 – $216.81. Dealer gamma bounded between $185 Put Wall and $220 Call Wall.
NVDA commands a massive ~8.0% S&P 500 benchmark footprint. Wall Street sell-side consensus reflects structural career-risk defense: institutional funds face severe benchmark tracking penalties for underweighting mega-cap heavyweights, forcing mandatory allocations regardless of current Free Cash Flow yield.
$181.30 – $188.70 (Options Support Pinning)
Sustained weekly close below $185.00 (Put Wall) or gross margin compression below 74.67%.
Sources & References
- Official SEC Form 10-K Annual Report (Filed 2026-02-25)
- NVIDIA Corporation SEC EDGAR Filings
- NVIDIA Investor Relations
- SEC Form 10-Q Filed August 26, 2026
Disclaimer: AllWallSt is a financial publisher, not an investment advisor. This analysis is for informational purposes only and does not constitute a recommendation to buy or sell any security. Investing involves substantial risk. Past performance is not indicative of future results.