
When the Nasdaq drops more than 2% in a single trading session, financial cable television usually blames a combination of rising crude oil prices, geopolitical friction, or general investor fatigue. But beneath the headline noise of the latest market retreat lies a far more specific anxiety: Wall Street has suddenly remembered that capital expenditure requires a return on investment.
When NVIDIA Corporation (NVDA) Chief Executive Officer Jensen Huang noted recently that neocloud demand is off the charts while capital remains scarce, he was articulating a fundamental truth of balance sheet mathematics. Everyone wants infinite compute, but nobody has an infinite balance sheet.
The immediate market narrative suggests that hyperscalers are spending too much money buying artificial intelligence infrastructure. But that misses the second-order mechanics of how corporate capital allocation works. The real risk for NVIDIA Corporation is not that cloud platforms will stop spending money on infrastructure entirely. The real risk is that as these mega-cap customers face pressure from their own shareholders to justify hundreds of billions in capital allocation, they will aggressively transition from buying expensive merchant GPUs to deploying internal, custom-designed application-specific integrated circuits (ASICs).
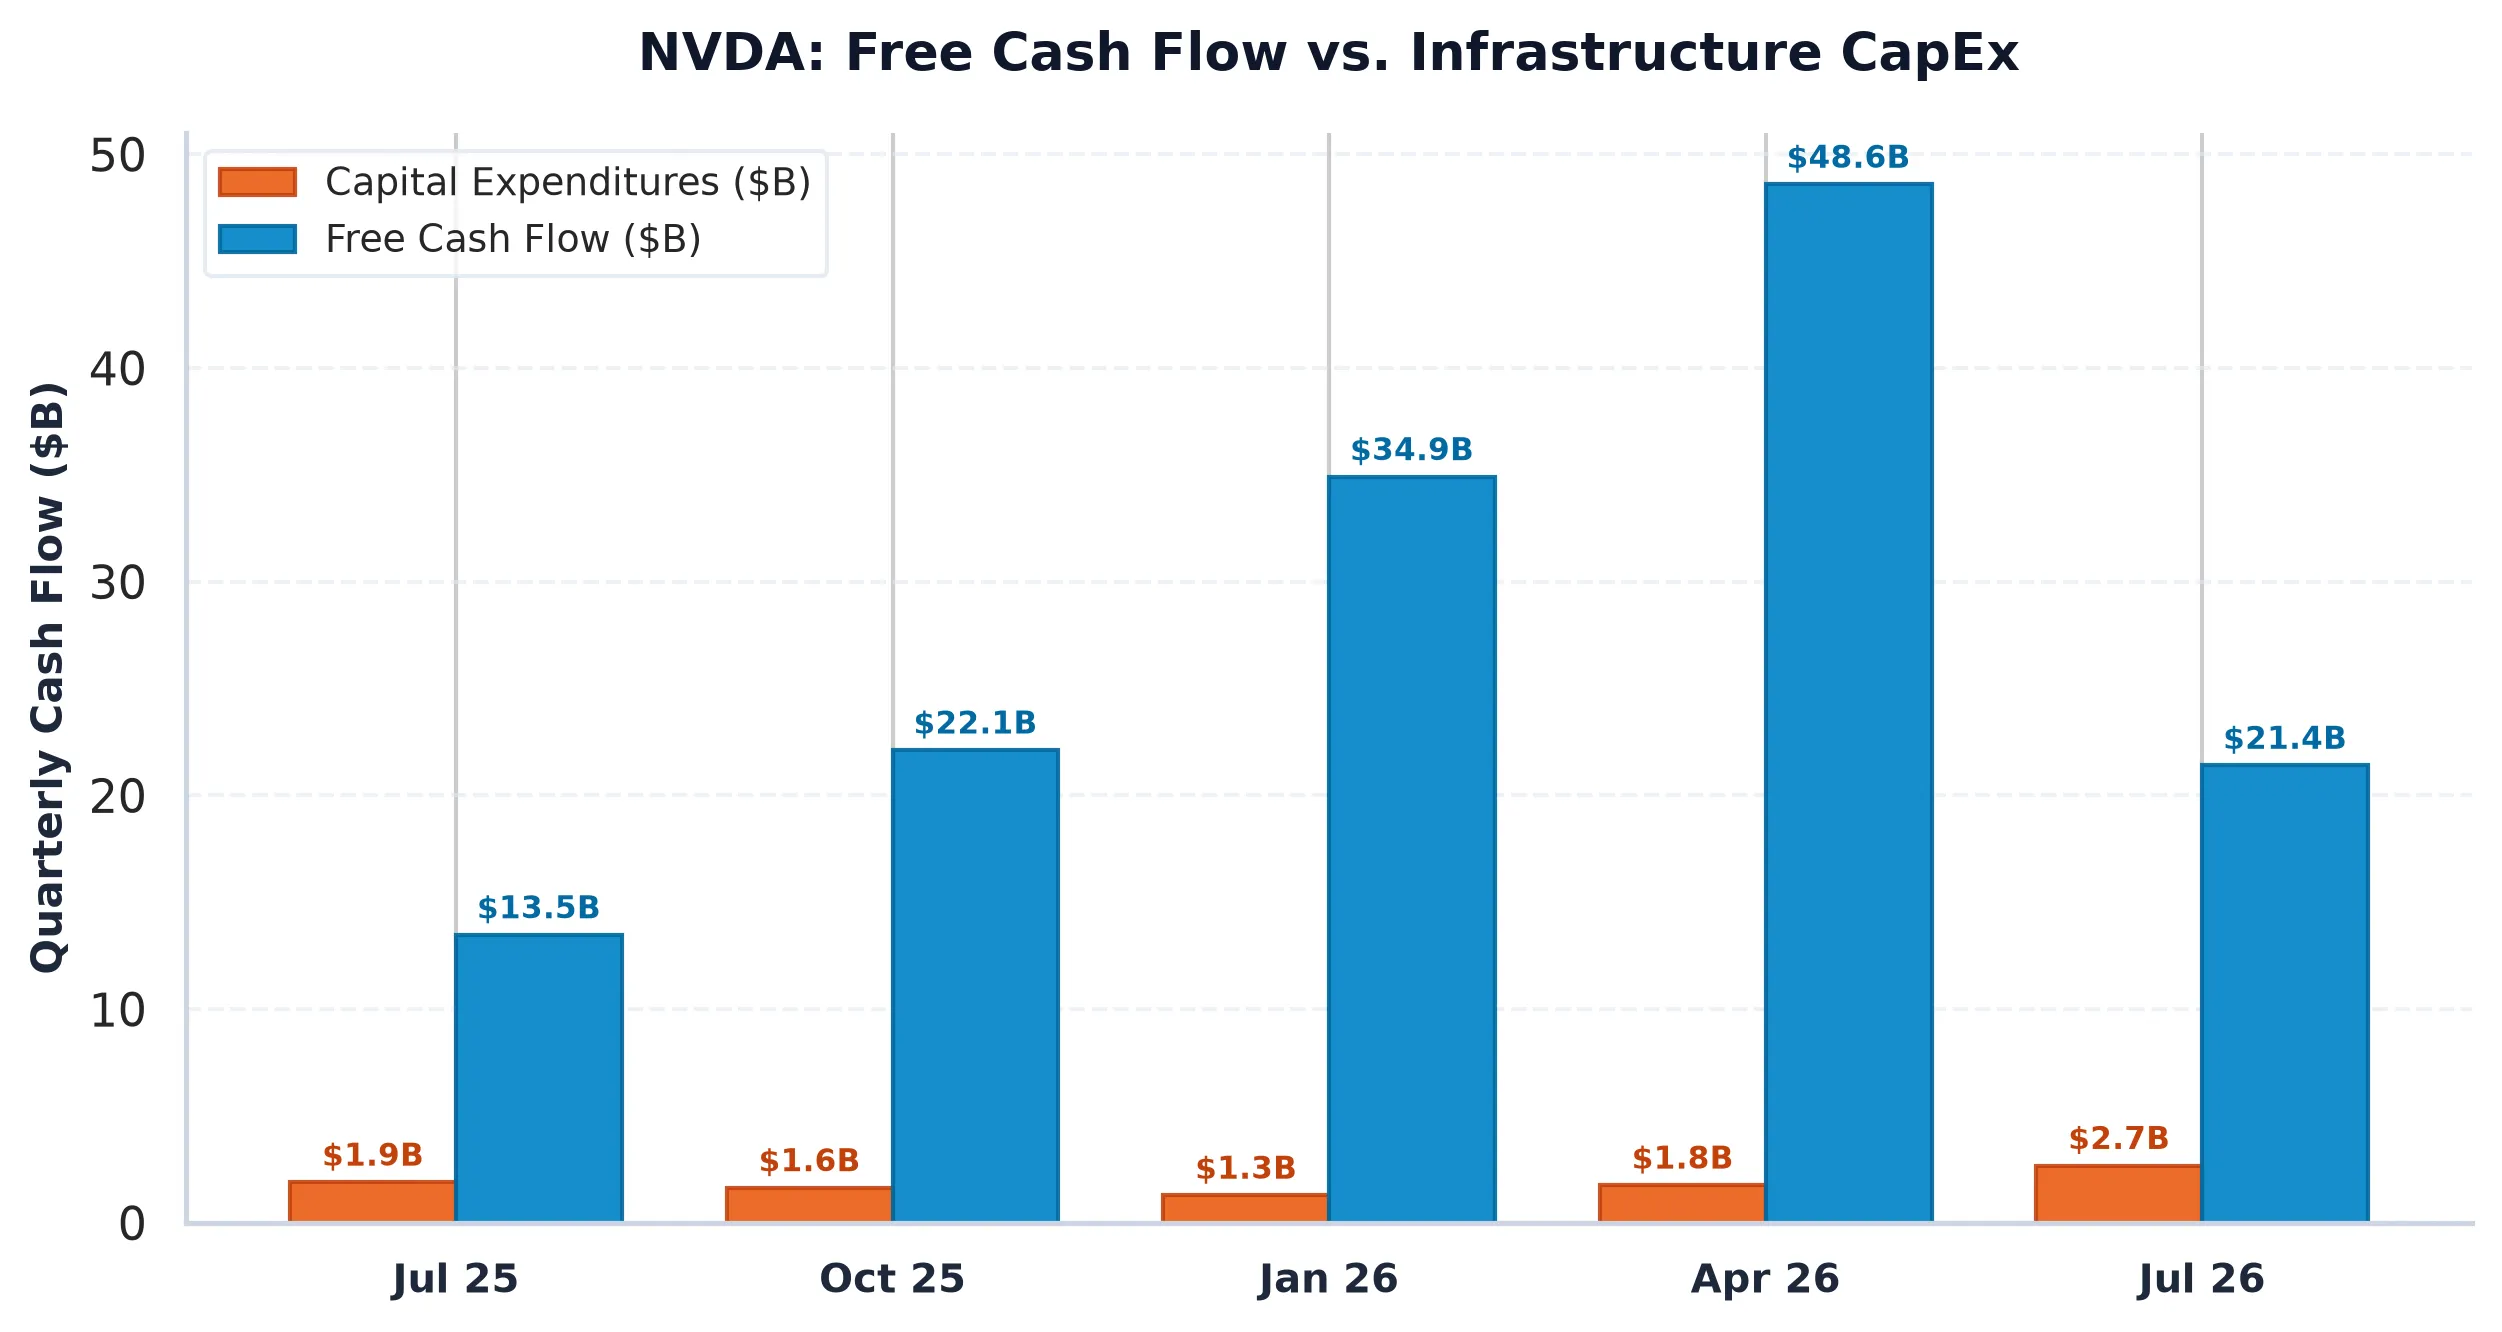
The Balance Sheet Mathematics of 74% Margins
If you run a cloud computing platform, purchasing flagship GPUs from NVIDIA is a brilliant way to establish technological leadership quickly. It is also an extraordinarily expensive way to operate a long-term utility business.
In its latest quarterly Form 10-Q disclosure filed with the SEC on August 26, 2026, NVIDIA reported trailing twelve-month revenues of $302.97 billion, representing YoY top-line growth of 105.90%. More strikingly, the company maintained a gross margin of 74.67% and an operating margin of 66.24%. On paper, these are staggering figures for a hardware designer.
However, one company’s record gross margin is another company’s cost of goods sold. When hyperscalers spend tens of billions of dollars constructing data centers, NVIDIA captures nearly three-quarters of that hardware spend as gross profit. That margin represents a massive capital transfer from cloud balance sheets to NVIDIA shareholders.
+-----------------------------------------------------------------------+
|                 HYPERSCALE CAPEX VS. NVIDIA MARGINS                  |
+-----------------------------------------------------------------------+
|  Hyperscaler CapEx Spend (Cloud Infrastructure Buildout)              |
|  └──> NVIDIA Revenue ($302.97B TTM)                                   |
|       └──> Gross Profit Margin: 74.67%                                |
|       └──> Operating Profit Margin: 66.24%                            |
|                                                                       |
|  ECONOMIC REALITY:                                                    |
|  NVIDIA's 74.67% Gross Margin acts as an economic tax on cloud        |
|  returns on invested capital (ROIC).                                  |
|                                                                       |
|  HYPERSCALER RESPONSE:                                                |
|  Accelerate custom silicon (ASIC) development to capture margin.      |
+-----------------------------------------------------------------------+
From a valuation perspective, NVIDIA trades at a market capitalization of $5.12 trillion, implying an Enterprise Value of $5.33 trillion. While the trailing price-to-earnings multiple sits at 26.83x, the company generates $41.81 billion in free cash flow, yielding just 0.82% against its equity valuation.
In a macroeconomic environment where the benchmark 10-Year US Treasury yield trades at 4.95%, NVIDIA offers a negative equity risk premium spread of -4.14%. Investors buying the stock at current levels are accepting negative cash carry relative to risk-free sovereign debt, betting that NVIDIA can maintain its monopoly-like pricing power indefinitely.
The Second-Order Threat: The ASIC Transition
Mainstream media commentary treats AI capital expenditure as a binary variable: either hyperscalers keep buying GPUs at an accelerating rate, or the entire AI trade collapses. But corporate finance is rarely binary; it is evolutionary.
Hyperscalers are not planning to abandon AI workload expansion. Instead, they are actively changing the unit economics of that expansion. Google’s TPU, Amazon Web Services’ Trainium and Inferentia, Meta’s MTIA, and Microsoft’s Maia chips are not designed to outperform NVIDIA’s top-tier architecture across every general-purpose computing benchmark. They are designed to run specific, high-volume internal inference and training workloads at a fraction of the cost.
Every time a cloud provider moves a mature inference workload from a general-purpose NVIDIA GPU to an in-house custom ASIC, three things happen:
1. The cloud provider’s return on invested capital improves dramatically.
2. The operational cost per token drops for end customers.
3. NVIDIA loses a high-margin chip sale.
This structural substitution does not show up as an immediate corporate collapse in SEC disclosures. Instead, it manifests as a subtle capping of terminal pricing power. NVIDIA can continue growing overall revenue while experiencing a gradual normalization of its industry-leading gross margins toward traditional semiconductor industry averages.
Options Market Structure and Near-Term Mechanics
While long-term fundamental investors deliberate over custom silicon substitution curves, options market plumbing provides clear parameters for near-term price movement.
NVIDIA trades at $212.21, positioned just below its option market Max Pain strike of $220.00. The total option open interest profile shows 536,329 Call contracts against 424,289 Put contracts, establishing a balanced Put/Call Open Interest ratio of 0.79.
+-----------------------------------------------------------------------+
|               NVIDIA OPTIONS MARKET PLUMBING & LEVELS                |
+-----------------------------------------------------------------------+
|  Current Spot Price:               $212.21                            |
|  Max Pain Strike (Magnet):         $220.00 (+3.67%)                   |
|  30-Day Implied Volatility (IV):   33.20%                             |
|  30-Day Expected Move Envelope:    +/- $20.20 (+/- 9.52%)              |
|                                                                       |
|  KEY OPTION STRIKE WALLS:                                             |
|  Call Resistance Walls:            $220 | $230 | $240                 |
|  Put Support Walls:                $200 | $210 | $215                 |
+-----------------------------------------------------------------------+
Option market makers are currently holding a relatively balanced gamma stance. Primary downside Put Walls at $215 (23,163 contracts), $210 (22,789 contracts), and $200 (22,598 contracts) provide strong structural support, limiting systemic intraday liquidity air pockets.
To the upside, formidable Call Resistance Walls cluster at $220 (56,059 contracts), $230 (69,632 contracts), and $240 (59,748 contracts). With 30-day At-The-Money Implied Volatility sitting at 33.20%, the options surface prices in a 30-day expected move envelope of +/- $20.20 (or 9.52%).
Going into upcoming options expirations, dealer delta hedging is likely to act as a stabilizing magnet, pulling spot prices upward toward the $220.00 Max Pain strike while Call Walls at $230 effectively cap speculative upside surges in the absence of massive new institutional buying volume.
Capital Discipline Meets Market Reality
NVIDIA remains one of the most operationally impressive corporations in modern history. Its pristine balance sheet, featuring $62.47 billion in total cash against $38.86 billion in total debt, yields a net cash surplus of $23.61 billion. It is a debt-free cash machine operating at the center of the modern technology stack.
However, great operating businesses do not automatically guarantee outsized equity returns when valuation already prices in perfection. With an equity risk premium of -4.14% relative to sovereign yields, NVIDIA offers zero yield cushion if hyperscale customers slow their purchasing velocity to assimilate current inventory.
As hyperscalers navigate their own earnings calls over the coming quarters, the conversation will increasingly shift from GPU acquisition speed to unit economic efficiency. When that happens, the primary debate will not be whether AI is real, but how much of the ecosystem’s ultimate profit pool NVIDIA gets to keep.
NVIDIA Corporation (NVDA)
Trailing P/E
Marcus Wolfe Screen
Leverage Profile
30D Channel
MODERATE WATCHLIST (1 flag): Inventory growth outpaced COGS growth by >15%, signaling potential inventory bloat or pending margin compression.
Fortress Balance Sheet (Net Cash Position; zero net refinancing distress).
Evaluated against 5.10% US 10-Yr Benchmark (FCF Spread: -4.14% (vs 10Y Yield of 4.95%)).
Max Pain: $220.00 (+3.67%) | P/C Ratio: 0.79 | 30D Channel: $197.00 – $227.42.
$195.23 – $203.72 (-4% to -8% Pullback Accumulation)
Sustained weekly close below $190.99 (-10.0% structural stop) or fundamental cash flow deterioration.