
There is a specific kind of magic in the way we account for the future. If a company buys a fleet of trucks, we call it capital expenditure. If a handful of hyperscalers buy enough GPUs to simulate the heat death of the universe, we apparently call it the primary driver of third-quarter US GDP growth.
According to recent Reuters reporting, robust consumer spending and massive corporate capital allocation toward AI infrastructure are currently powering the American economy. This is a fascinating development for the macro-narrative. It suggests that NVIDIA Corporation (NVDA) has transcended the status of a mere semiconductor designer. It is no longer just a “tech stock” in the traditional sense. Instead, it has become a mandatory productivity utility. If you are a CEO facing sticky labor costs and inflationary pressures, you don’t buy NVIDIA chips because you want to: you buy them because you have to. You are buying a hedge against the cost of human existence.
The Negative Risk Premium Problem
The fundamental problem with treating a chipmaker as a national utility is that utilities are usually boring, slow-growing, and priced for their yield. NVIDIA is none of those things. It is growing revenue at 105.90% year-over-year, which is the opposite of boring. However, the valuation math is starting to look like a puzzle designed by a nihilist.
NVIDIA currently trades with a Free Cash Flow (FCF) yield of 0.81%. Meanwhile, the US 10-Year Treasury yield is hovering around 4.99%. This creates a spread of -4.18%. In the old world, the one where gravity and discounted cash flow models mattered, you generally wanted the risky equity to pay you more than the risk-free government bond. Here, investors are paying a massive premium for the privilege of owning the hardware that powers the GDP.
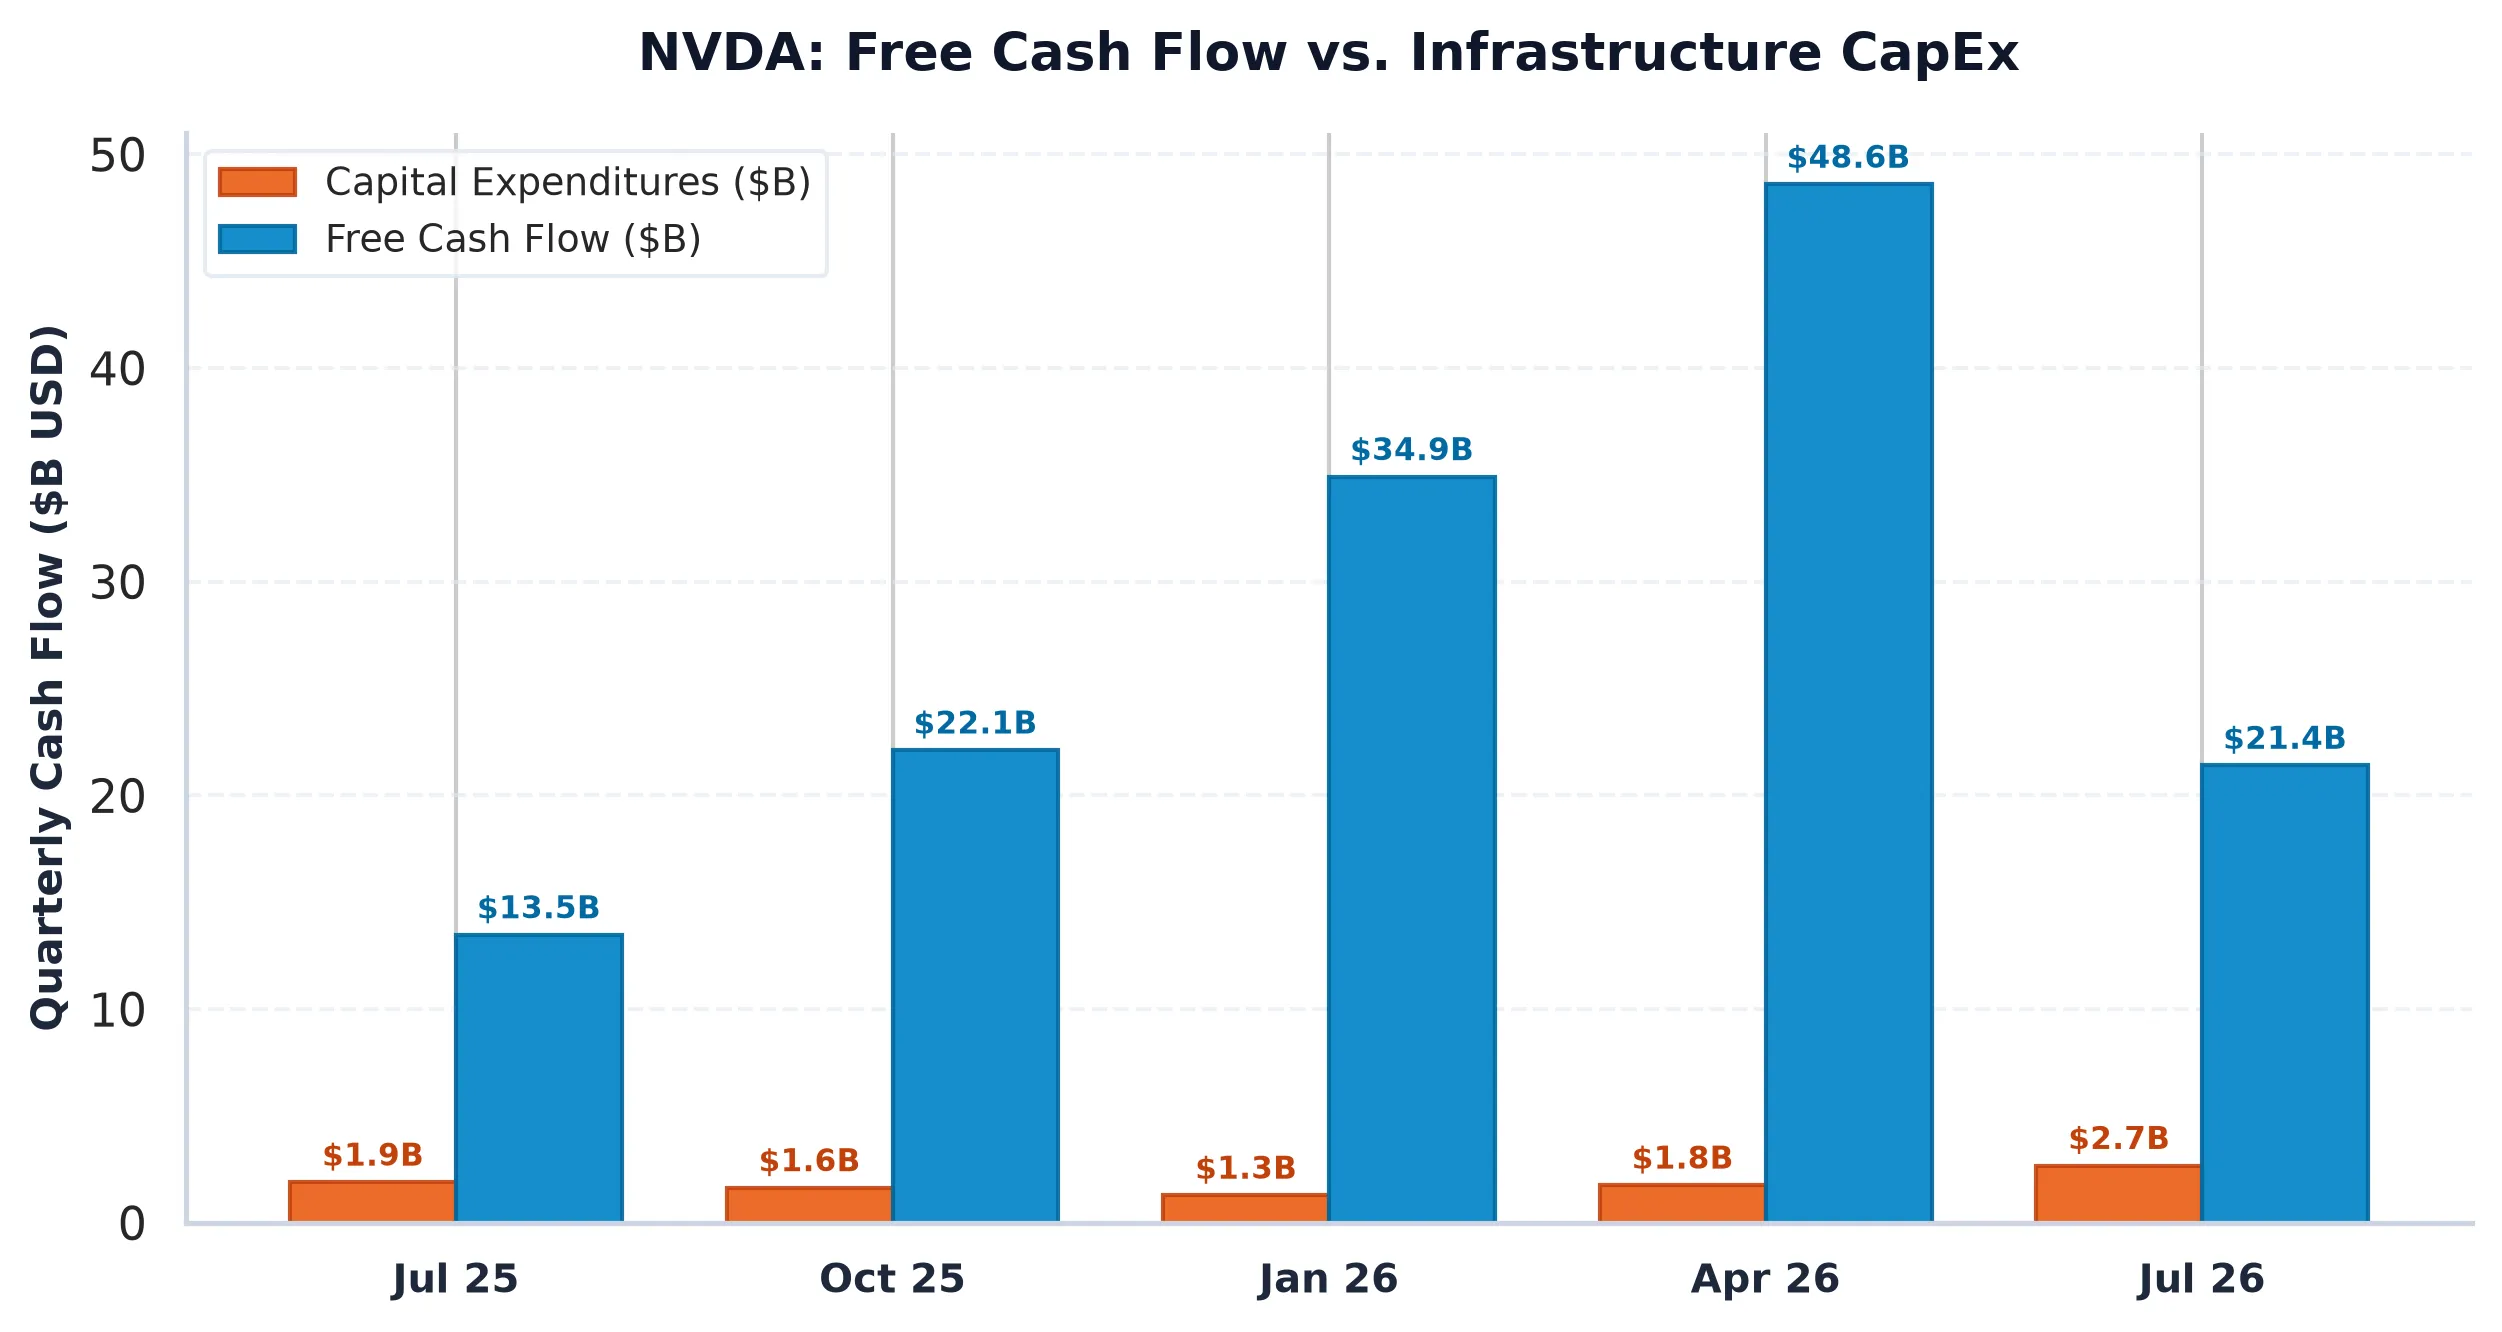
We should look at the CapEx intensity to understand the scale of this commitment. According to its latest Form 10-Q filed in August 2026, NVIDIA is seeing its customers deploy staggering amounts of capital. The company itself has a CapEx intensity of 30.55%, representing over $92 billion in spending. This is not a “discretionary upgrade” cycle. This is an industrial build-out. When the US government reports that AI investment is powering the economy, they are essentially saying that the national growth rate is now leveraged to the Blackwell architecture.
Market Structure and the $215 Magnet
While the macro-strategists debate whether this is a structural necessity or a cyclical bubble, the options market is busy doing something much more practical: pinning the price.
The current market structure for NVIDIA Corporation is remarkably balanced, but it has a very clear ceiling. We see massive Call Walls at the $220 and $225 strikes, with over 130,000 combined contracts sitting there like a physical barrier. On the downside, the Put Wall at $210 provides a floor, but it is much thinner than the resistance above.
The most important number for the immediate term is the Max Pain strike of $215. With the stock trading at $213.66, dealer gamma hedging is likely to act as a magnetic force, pulling the price toward that $215 level as we approach expiration. The market is currently pricing in a 30-day expected move of roughly 8.10% in either direction. This implies that while the long-term story is about GDP and structural utility, the short-term story is about dealers managing their inventory between $210 and $225.
The Career Risk Consensus
Wall Street consensus remains a “Strong Buy,” but we should be honest about why. NVIDIA now commands a nearly 9.4% weight in the S&P 500. If you are an institutional fund manager and you do not own NVIDIA, and NVIDIA goes up, you lose your job. It is that simple. This creates a “career-risk defense” bid that has nothing to do with the -4.18% FCF spread and everything to do with benchmark tracking.
The company is undeniably efficient, with a gross margin of 74.67% and a return on equity of 117.21%. These are “god-tier” metrics. But when the hardware becomes a mandatory utility for the entire economy, the margins eventually attract the attention of regulators and the laws of diminishing returns. For now, the US economy is an NVIDIA subsidiary. We are all just living in the simulation.
NVIDIA Corporation (NVDA)
Trailing P/E
Marcus Wolfe Screen
Leverage Profile
30D Channel
MODERATE WATCHLIST (1 flag): Inventory growth outpaced COGS growth by >15%, signaling potential inventory bloat or pending margin compression.
Fortress Balance Sheet (Net Cash Position; zero net refinancing distress).
Negative yield spread (-4.18% vs 5.10% Treasury); equity requires robust multiple expansion or growth.
Max Pain: $215.00 (+0.63%) | P/C Ratio: 0.69 | 30D Channel: $196.35 – $230.97. Dealer gamma bounded between $210 Put Wall and $225 Call Wall.
NVDA commands a massive ~9.4% S&P 500 benchmark footprint. Wall Street sell-side consensus reflects structural career-risk defense: institutional funds face severe benchmark tracking penalties for underweighting mega-cap heavyweights, forcing mandatory allocations regardless of current Free Cash Flow yield.
$205.80 – $214.20 (Options Support Pinning)
Sustained weekly close below $210.00 (Put Wall) or gross margin compression below 74.67%.
Sources & References
- Official SEC Form 10-K Annual Report (Filed 2026-02-25)
- NVIDIA Corporation SEC EDGAR Filings
- NVIDIA Investor Relations
- Reuters: US Third Quarter Economic Growth Report
- SEC Form 10-Q (Filed August 26, 2026)
Disclaimer: This analysis is for informational purposes only and does not constitute financial, investment, or legal advice. The author holds no position in the securities mentioned at the time of publication. Equity investments involve significant risk, particularly in high-beta semiconductor sectors.