
The current consensus on Palo Alto Networks, Inc. (PANW) is that its Chief Executive, Nikesh Arora, might be the only person capable of rivaling Nvidia’s Jensen Huang in terms of strategic foresight. This is a bold claim for a company that sells cybersecurity software rather than the high-end silicon currently powering the global compute race. The narrative being pushed across the financial wires today is that the company’s “platformization” strategy is not just working, it is becoming the mandatory architecture for a world where AI has made even mediocre hackers dangerous.
Platformization is the industry’s preferred term for bundling. In the old days, you might buy your firewall from one company, your cloud security from another, and your endpoint protection from a third. Palo Alto Networks wants you to buy all of it from them, often by giving away pieces for free today to lock in a massive contract tomorrow. The market has rewarded this ambition with a valuation that suggests the company has already won the future, trading at a trailing price-to-earnings multiple of 757x.
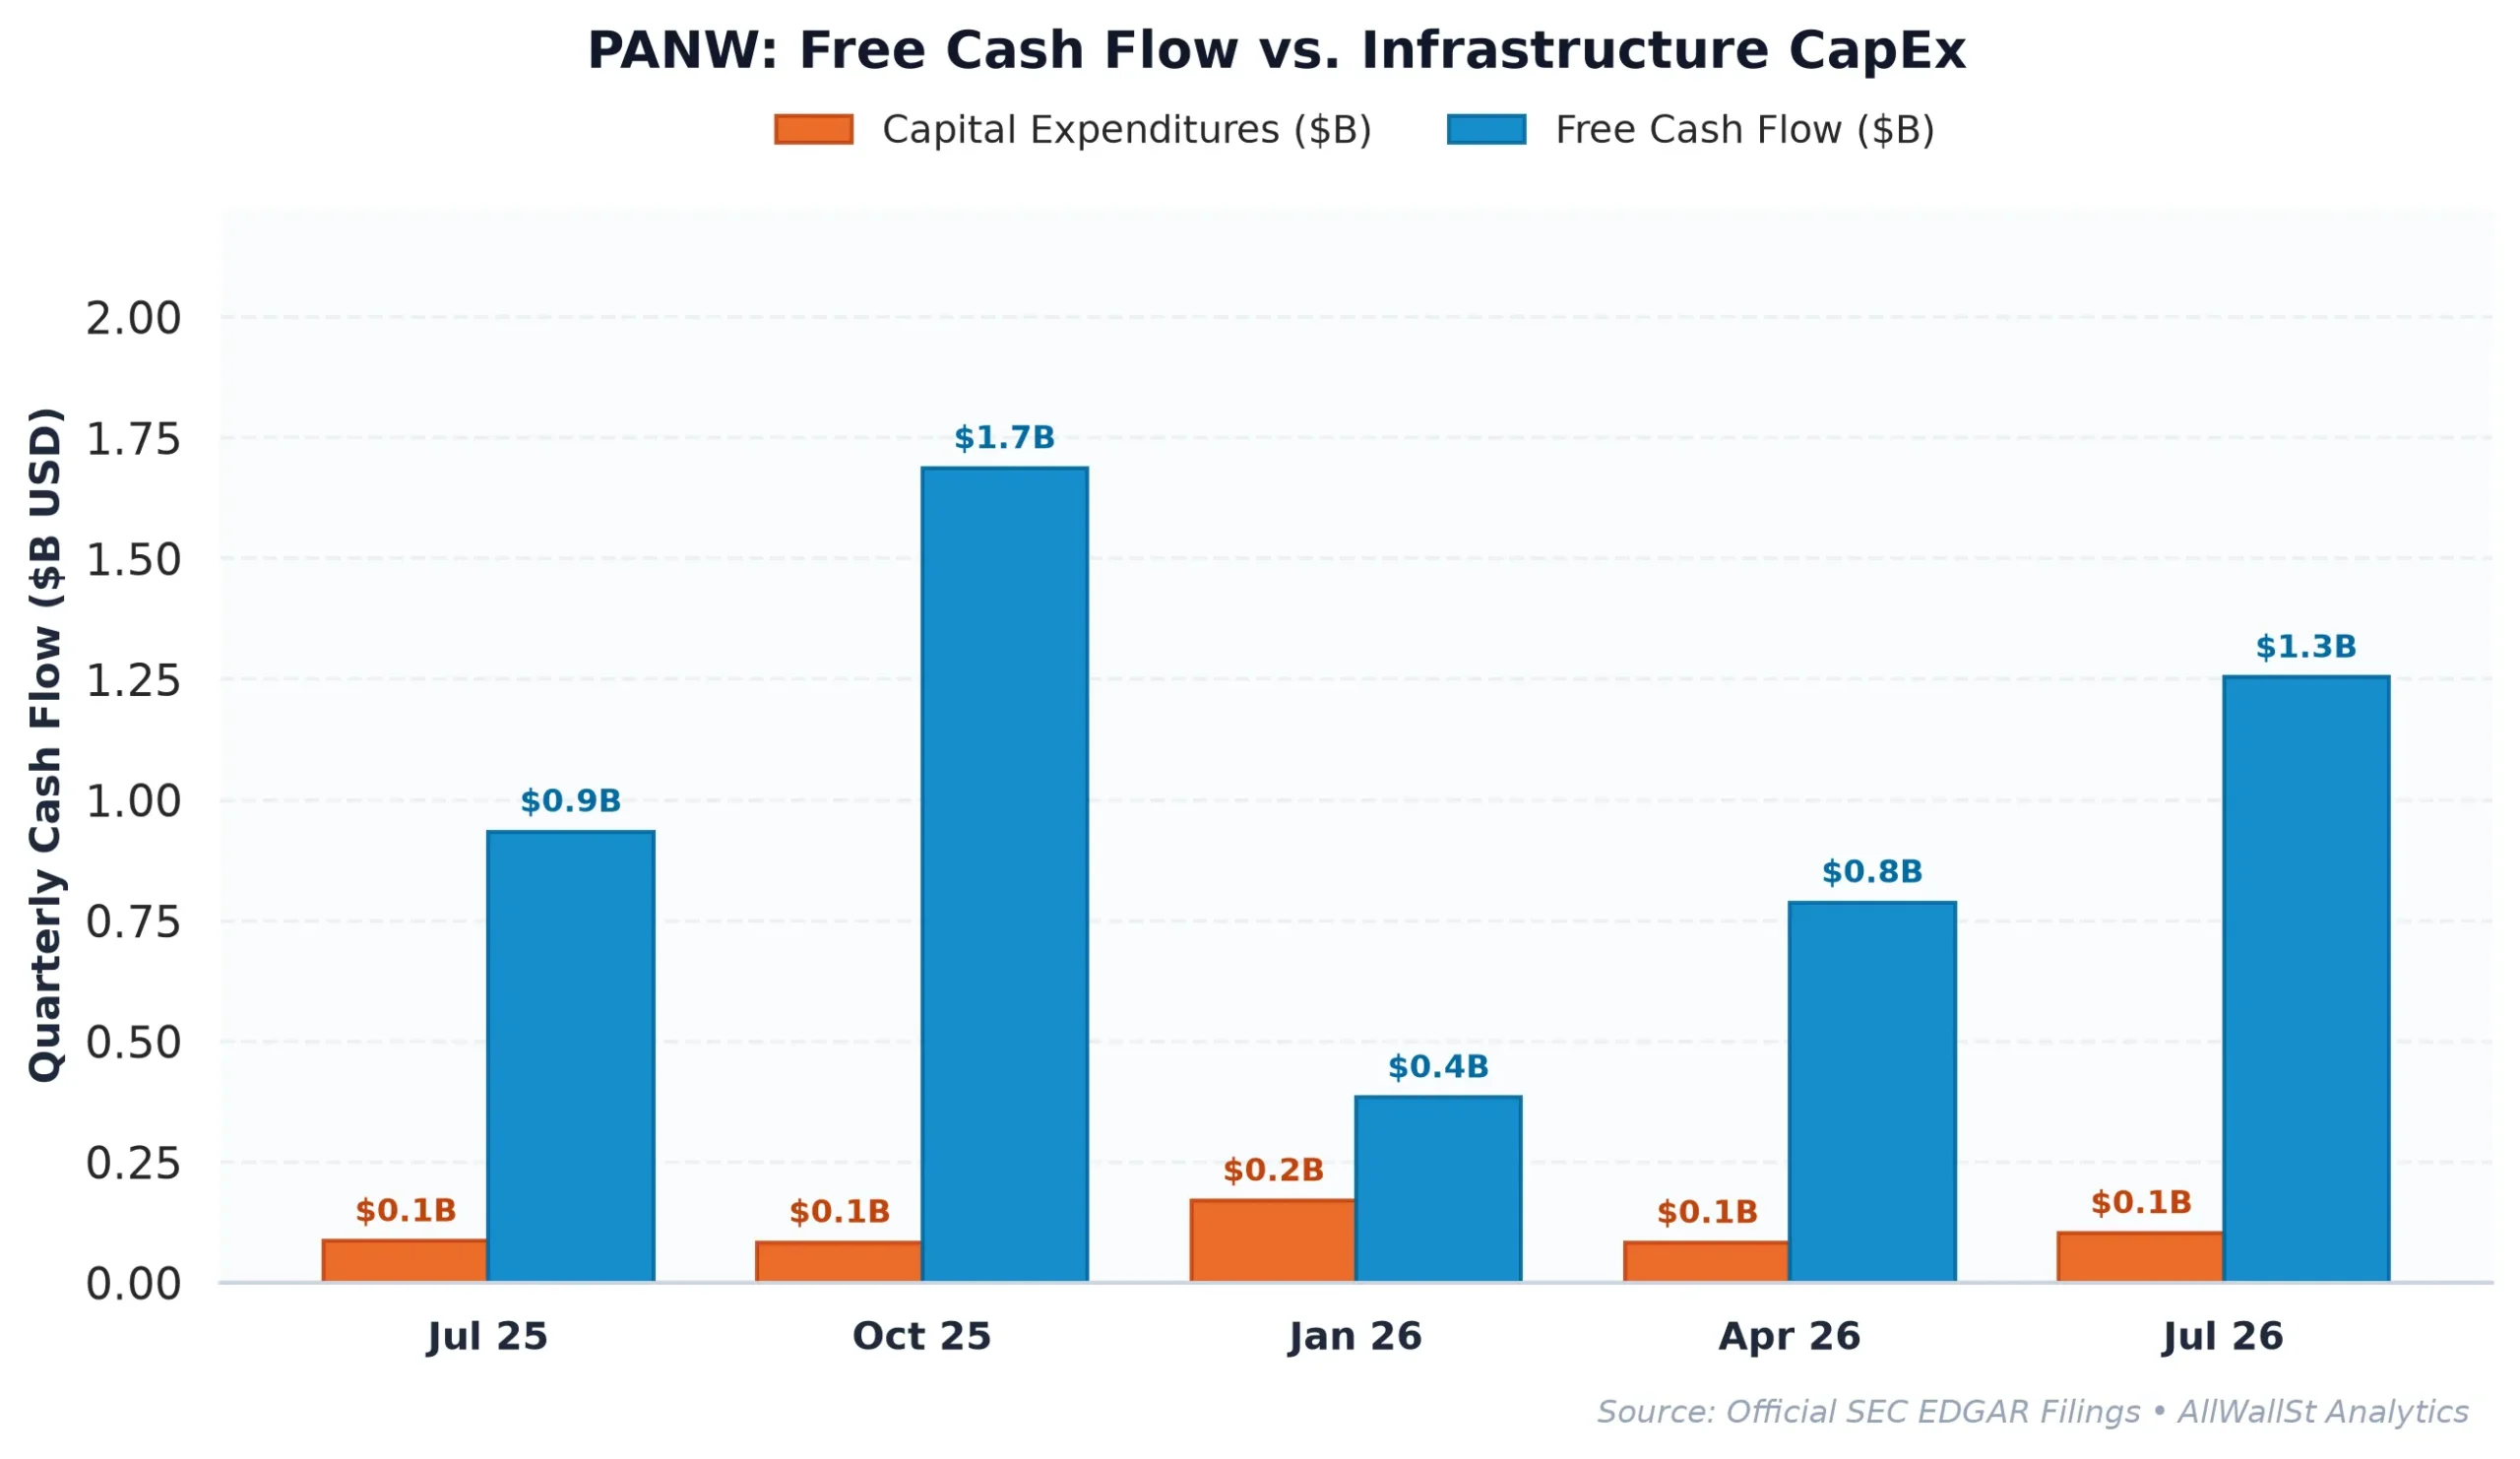
The Accounting Gravity of Cybersecurity Bundling
When a company decides to give away products to win long-term market share, the income statement usually feels the heat before the balance sheet feels the light. Palo Alto Networks generated $11.48 billion in revenue in FY2026 (up 24.5% year-over-year, accelerating to 34.5% trailing twelve-month top-line growth). However, GAAP operating margin sits at a thin 6.1% for FY2026 (7.05% over the trailing twelve months), a reflection of the heavy costs associated with aggressive customer acquisition and the transition to a platform-centric model.
The real tension lies in the gap between reported cash flow and economic reality. The company generated $4.11 billion in FY2026 free cash flow ($4.24 billion over the trailing twelve months), which looks impressive until you account for the cost of keeping the talent from jumping ship to a competitor. Stock-based compensation (SBC) reached $1.77 billion, or roughly 39% of operating cash flow. In plain English, if you paid the employees in cash instead of shares, the real free cash flow yield would drop to a meager 0.99%.
This creates a significant hurdle when compared to the macro environment. With the 10-Year US Treasury yield sitting at 5.10%, an investor is essentially accepting a negative spread of 3.39% to own Palo Alto Networks instead of a risk-free government bond. This is known as a negative equity risk premium, where you are taking all the risks of a volatile tech stock for less than the return of a boring Treasury note.
Furthermore, the company’s Return on Invested Capital (ROIC) stands at 2.37%. When compared to a weighted average cost of capital (WACC) hurdle of roughly 8.5%, the math suggests the business is currently destroying economic value on a per-dollar-invested basis. The market is betting that the “platform” will eventually scale its way into massive profitability, but the historical trajectory shows that as revenue grows, the SBC bill grows right along with it.
| Period | Revenue | Operating Income | Operating Margin | Free Cash Flow | SBC Expense |
|---|---|---|---|---|---|
| FY2023 | $6.89B | $387.3M | 5.6% | $2.63B | $1.07B |
| FY2024 | $8.03B | $684.0M | 8.5% | $3.10B | $1.08B |
| FY2025 | $9.22B | $1.24B | 13.5% | $3.47B | $1.29B |
| FY2026 | $11.48B | $695.0M | 6.1% | $4.11B | $1.77B |
The Valuation Gap and the Peer Paradox
Palo Alto Networks does not exist in a vacuum, and its valuation looks even more precarious when stacked against its peers. While CrowdStrike (CRWD) commands an even higher forward P/E, it does so with a different margin profile and a more focused cloud-native approach. Meanwhile, legacy players like Cisco Systems (CSCO) trade at a fraction of the multiple, reflecting the market’s skepticism toward hardware-heavy incumbents.
The peer table reveals a stark contrast in how the market prices growth versus efficiency. Palo Alto Networks trades at 62.1x forward earnings, nearly double the multiple of Fortinet (FTNT), despite Fortinet boasting a vastly superior operating margin of 32.9%. Fortinet manages to generate more profit per dollar of sales while Palo Alto Networks spends aggressively to maintain its “platform” narrative.
| Company (Ticker) | Market Cap | Forward P/E | EV/EBITDA | Rev Growth (YoY) | Operating Margin | FCF Yield |
|---|---|---|---|---|---|---|
| Palo Alto Networks (PANW) | $248.2B | 62.1x | 165.4x | 34.50% | 7.05% | 1.71% |
| CrowdStrike (CRWD) | $221.8B | 134.4x | N/M (>500x) | 25.8% | -2.5% | 0.90% |
| Fortinet (FTNT) | $89.6B | 31.3x | 31.3x | 20.5% | 32.9% | 2.78% |
| Cisco Systems (CSCO) | $371.0B | 15.6x | 18.7x | 24.4% | 27.2% | 2.92% |
The bull case for Palo Alto Networks rests on the idea that they are the “index” of cybersecurity. If you want to bet on the sector, you buy the biggest player. But for an institutional investor, the price of that index membership is becoming prohibitive. When the EV/EBITDA multiple hits 165.4x, you aren’t just paying for the next few years of growth: you are paying for a decade of flawless execution and the hope that interest rates fall back toward zero.
There is also the matter of “ghost CapEx.” Tech companies often extend the useful life of their servers to make their earnings look better. While Palo Alto Networks maintains a relatively low CapEx intensity of 3.83%, the sheer scale of their cloud transition means they are increasingly beholden to the pricing whims of the hyperscalers. If Amazon or Microsoft raises the rent on the data centers Palo Alto uses to run its security cloud, those margins could compress even further.
Market Plumbing and the Max Pain Magnet
As the company prepares to report earnings tomorrow, the options market is pricing in a massive move. The implied volatility (IV) is currently 77.62%, which is exceptionally high for a stock with a beta of 0.97. This suggests that traders are paying a massive premium for protection or speculation, expecting the stock to swing by as much as $67.38 in either direction over the next 30 days.
In the world of options market making, dealers try to stay delta-neutral, meaning they hedge their exposure by buying or selling the underlying stock. The “Max Pain” strike price (the point where the most option contracts expire worthless) is currently at $330.00. This is nearly 9% above the current spot price, suggesting there is a magnetic pull toward the upside if the earnings report provides even a modest reason for optimism.
However, the Put/Call Open Interest ratio of 0.68 indicates that the market is already leaning heavily into calls. When everyone is already on one side of the boat, even a “good” earnings report can lead to a selloff as traders “sell the news” and dealers unwind their hedges. This is the structural risk of entering a trade when the speculative fever is this high.
The “Put Wall” at $300 acts as a floor where dealers would likely step in to buy the stock to hedge their put positions. But if that wall breaks, the next major support isn’t until $260, creating a significant air pocket for a stock that is already priced for perfection. For a company with a negative real free cash flow spread against Treasuries, that air pocket represents the true risk of the current consensus.
The Investment Committee must acknowledge that Palo Alto Networks has successfully shifted the conversation from “firewalls” to “AI platforms,” a move that has captured the market’s imagination. If the company manages to show that platformization is leading to shorter sales cycles and higher multi-year contract values, the stock could easily pierce through current resistance levels.
AllWallSt Investment Verdict: SELL
(Targeting valuation compression as real FCF yield remains deeply unattractive relative to 5.10% Treasury benchmarks)
Palo Alto Networks, Inc. (PANW)
Trailing P/E
Marcus Wolfe Screen
Leverage Profile
30D Channel
Dealer Gamma Pinning & Max Pain Alignment (PANW)
🎯 Max Pain: $330.00
Spot $303.09
Ceiling $330C Resistance ▲
Pristine cash flow conversion (14.83x) and healthy accrual ratio (-8.76%). Zero accounting anomalies detected (LOW ANOMALY RISK).
Fortress Balance Sheet (Net Cash Position; zero net refinancing distress).
Negative yield spread (-3.39% vs 5.10% Treasury); equity requires robust multiple expansion or growth.
Max Pain: $330.00 (+8.97%) | P/C Ratio: 0.68 | 30D Channel: $235.71 – $370.47. Dealer gamma bounded between $300 Put Wall and $330 Call Wall.
PANW carries standard index weighting (< 0.6% SPY footprint); sell-side consensus reflects standard earnings momentum rather than index-tracking mandates.
$323.40 – $336.60 (Call Wall Resistance Distribution Ceiling)
Sustained weekly close above $330.00 (Call Wall Resistance) or structural rebound in GAAP Free Cash Flow.
Bullish IC Dissent: Despite 757.7x trailing earnings and 1.71% FCF yield, Palo Alto Networks, Inc. (PANW) could stage a sharp short-covering squeeze if management surprises with cost discipline, buyback acceleration, or stabilizing guidance above the $330 call wall. Consensus pessimism already prices in significant deterioration, creating asymmetric upside risk if credit spreads remain contained.
Sources & References
- Official SEC Form 10-Q Quarterly Report (Filed 2026-06-03)
- SEC EDGAR: Palo Alto Networks Inc Complete Filing History
- SEC Form 8-K Primary Filing Body (2026-04-13)
- SEC DEF 14A Proxy / M&A Filing (2026-10-27)
- Federal Register (2026-07-22): Notice Pursuant to the National Cooperative Research and Production Act of 1993-The…
- SEC EDGAR Filing (Form 10-K, Filed 2026-09-10): https://www.sec.gov/Archives/edgar/data/1327567/000132756726000023/panw-20260731.htm
- SEC EDGAR Filing (Form 8-K, Filed 2026-08-21): https://www.sec.gov/Archives/edgar/data/1327567/000119312526361122/d180372d8k.htm
- Palo Alto Networks Investor Relations: https://www.paloaltonetworks.com
- US Treasury 10-Year Benchmark: https://www.treasury.gov
Disclaimer: This report is for informational purposes only and does not constitute financial, legal, or investment advice. The author and AllWallSt are not registered investment advisors. All equity investments carry significant risk, including the potential loss of principal. Quantitative metrics and options market data are subject to rapid change. Verify all filings via SEC EDGAR before making investment decisions.